The global biostimulants market is anticipated to reach USD 11.1 billion by 2035, recording an absolute increase of USD 7.1 billion over the forecast period. The market is valued at USD 4.1 billion in 2025 and is projected to grow at a CAGR of 10.5% during the forecast period. The market size is expected to grow by nearly 2.7 times during the same period, supported by increasing demand for sustainable agricultural productivity solutions worldwide, driving demand for efficient plant health enhancement systems and rising investments in precision agriculture, organic farming, and climate-resilient crop production globally. The regulatory complexity across regions and limited farmer awareness in developing markets may pose challenges to market expansion.
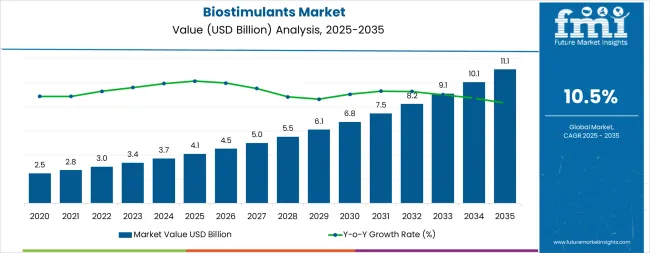
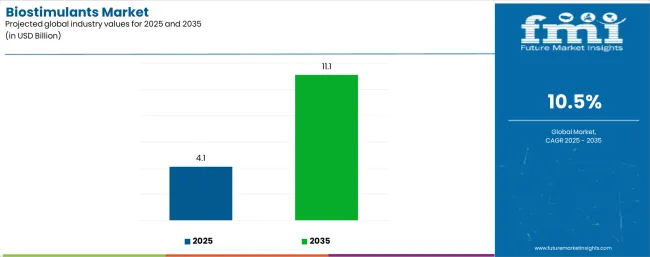
Between 2025 and 2030, the market is projected to expand from USD 4.1 billion to USD 6.6 billion, resulting in a value increase of USD 2.5 billion, which represents 35.2% of the total forecast growth for the decade. This phase of development will be shaped by rising demand for climate stress mitigation in agriculture, product innovation in seaweed extract and microbial formulations, as well as expanding integration with precision agriculture programs and organic farming certification requirements. Companies are establishing competitive positions through investment in bioactive compound research, proprietary extraction technologies, and strategic market expansion across specialty crops, row crops, and protected cultivation applications.
From 2030 to 2035, the market is forecast to grow from USD 6.6 billion to USD 11.1 billion, adding another USD 4.6 billion, which constitutes 64.8% of the overall ten-year expansion. This period is expected to be characterized by the expansion of specialized biostimulant systems, including advanced multi-active formulations and integrated biological programs tailored for specific crop and stress conditions, strategic collaborations between agricultural input companies and biotechnology innovators, and an enhanced focus on regulatory harmonization and evidence-based efficacy validation. The growing focus on nutrient-use efficiency and sustainable intensification will drive demand for advanced, scientifically validated biostimulant solutions across diverse agricultural systems.
| Metric | Value |
|---|---|
| Market Value (2025) | USD 4.1 billion |
| Market Forecast Value (2035) | USD 11.1 billion |
| Forecast CAGR (2025 to 2035) | 10.5% |
The biostimulants market grows by enabling farmers to enhance crop productivity and resilience without increasing synthetic fertilizer or pesticide inputs, addressing mounting pressure for sustainable intensification of agricultural systems. Growers face intensifying challenges from climate variability including drought, heat stress, and irregular precipitation patterns, with biostimulants typically providing 8-15% yield improvements and enhanced stress tolerance through mechanisms including improved nutrient uptake efficiency, enhanced photosynthesis, and stimulated root development. The specialty crop sector's need for quality premiums and consistent production drives adoption of seaweed extracts, amino acid formulations, and humic substances that improve fruit size, color, and shelf life while reducing physiological disorders.
Regulatory frameworks promoting eco-friendly agriculture, including the European Union’s Farm to Fork strategy, organic certification standards, and nutrient management regulations, create favorable conditions for biostimulant adoption as complementary tools reducing synthetic input requirements. Growing consumer preference for environmentally responsible foods accelerates retailer ecofriendly standards and grower commitments to biological input integration across fresh produce, wine, and specialty crop supply chains. The inconsistent field performance across varying environmental conditions and limited understanding of mode-of-action mechanisms may constrain adoption rates among conventional row crop farmers, while fragmented regulatory landscapes create market access barriers for manufacturers operating across multiple jurisdictions.
The market is segmented by active ingredient, crop type, application method, and region. By active ingredient, the market is divided into extract-based, acid-based, and other formulations. Based on crop type, the market is categorized into row crops, fruits & vegetables, turfs & ornamentals, and other crop types. By application method, the market is segmented into foliar, soil/drip, and seed/coating applications. Regionally, the market is divided into Asia Pacific, Europe, North America, Latin America, and Middle East & Africa.
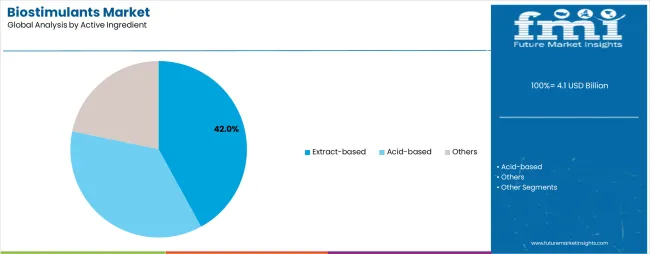
The extract-based segment represents the dominant force in the biostimulants market, capturing approximately 42.0% of total market share in 2025. This advanced ingredient category encompasses formulations derived from natural sources including seaweed extracts, protein hydrolysates, amino acid blends, and humic substances extracted from organic materials, delivering complex mixtures of bioactive compounds that stimulate plant metabolism, enhance stress tolerance, and improve nutrient utilization efficiency. The extract-based segment's market leadership stems from its strong efficacy validation across diverse crops and growing conditions, with products demonstrating consistent benefits in root development, flowering uniformity, and abiotic stress mitigation.
Within the extract-based segment, seaweed extracts account for 24.0% of total market share, serving as the largest single ingredient category through Ascophyllum nodosum and other marine algae providing natural growth regulators, complex polysaccharides, and trace elements. Protein hydrolysates and amino acid blends represent 10.0% share through enzymatic or chemical hydrolysis of plant and animal proteins delivering readily available nitrogen sources and signaling molecules. Humic substances within extract portfolios capture 8.0% share in natural organic matter extracts providing soil conditioning and nutrient chelation benefits.
The acid-based segment maintains substantial market presence with 34.0% share through humic and fulvic acid formulations extracted from leonardite, lignite, and other geological sources. Other biostimulants including microbial amendments, trace minerals, and peptides account for 24.0% of the market.
Key technological advantages driving the extract-based segment include:
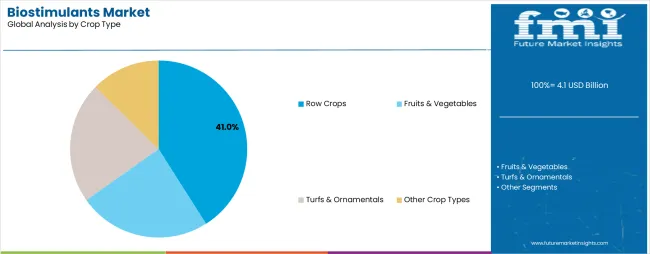
Row crops applications dominate the biostimulants market with approximately 41.0% market share in 2025, reflecting growing adoption in cereals, oilseeds, and pulse production where even modest yield improvements and stress tolerance gains translate to significant economic returns across large acreage. The row crops segment's market leadership is reinforced by increasing focus on nutrient-use efficiency in corn, soybean, wheat, and rice production, drought and heat stress mitigation requirements in rain-fed agriculture, and sustainability certification requirements from food processors and export markets driving biological input adoption.
The fruits & vegetables segment represents the second-largest crop category, capturing 36.0% market share through high-value specialty crop applications where biostimulants deliver quality improvements and stress mitigation supporting premium pricing. Within fruits & vegetables, berries and vines account for 11.0% share through vineyards, berry production, and perennial fruit crops requiring consistent quality. Greenhouse vegetables represent 10.0% share in protected cultivation systems optimizing productivity and resource efficiency. Orchards and citrus capture 9.0% share through tree fruit and citrus production focusing fruit size and quality. Root and leafy vegetables account for 6.0% of the fruits & vegetables segment.
Turfs & ornamentals represent 12.0% market share through turf management, landscape maintenance, and ornamental plant production. Other crop types including plantation crops, herbs & spices, and floriculture account for 11.0% of the market.
Key market dynamics supporting row crops growth include:
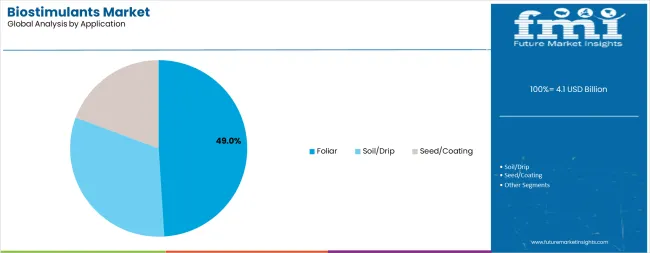
Foliar application dominates the application method segment with approximately 49.0% market share in 2025, reflecting the advantages of leaf-applied biostimulants for rapid plant response, flexible application timing, and integration with existing crop protection spray programs. The foliar segment's market leadership is supported by growers' preference for visible response and ease of application through conventional spray equipment, enabling biostimulant adoption without requiring specialized application infrastructure or significant practice changes.
Within the foliar application segment, single-pass foliar programs combined with nutrition account for 20.0% of total market share, serving tank-mix applications where biostimulants enhance foliar nutrient uptake and utilization. Multi-pass stress-mitigation foliar programs represent 17.0% share through repeated applications timed to critical growth stages or stress periods. Specialty foliar applications including micro-dose formulations and UV-stable products capture 12.0% share in advanced precision applications.
Soil and drip application methods account for 33.0% market share through fertigation systems, soil incorporation, and drip irrigation delivery enabling sustained nutrient availability and root zone benefits. Seed treatment and coating applications represent 18.0% of the market through pre-plant application providing seedling vigor enhancement and early-season stress protection.
Key factors driving foliar application dominance include:
The market is driven by three concrete demand factors tied to agricultural sustainability and productivity challenges. First, climate change impacts including increased frequency of drought, heat stress, and unpredictable precipitation patterns create urgent demand for crop resilience tools, with biostimulants demonstrating 10-20% yield protection under stress conditions compared to untreated controls across multiple field trials, making them essential risk management tools for growers facing weather volatility. Second, regulatory pressure to reduce synthetic fertilizer application rates and improve nutrient-use efficiency drives biostimulant adoption as complementary technologies, with European Nitrates Directive, US state-level nutrient management regulations, and Asian fertilizer reduction programs incentivizing products that enhance nitrogen and phosphorus uptake efficiency by 15-25% enabling compliance while maintaining productivity targets. Third, premium market access and sustainability certification requirements from major food retailers, wine importers, and export markets accelerate biological input adoption, as growers pursuing organic certification, regenerative agriculture labels, or retailer sustainability scorecards require approved biostimulant products meeting program standards.
Market restraints include regulatory fragmentation creating market access barriers and compliance costs, as countries maintain diverse registration requirements, efficacy data standards, and product classification frameworks that complicate international commercialization and require substantial investment in region-specific dossier development. Inconsistent field performance and difficulty quantifying return on investment pose adoption challenges, particularly in row crop applications where variable environmental conditions, soil types, and management practices produce inconsistent biostimulant responses that complicate economic justification compared to conventional inputs with predictable effects. Limited farmer awareness and technical knowledge about biostimulant mechanisms, optimal application timing, and product selection create barriers to adoption, requiring substantial technical service and educational investment by manufacturers to build grower confidence and competency.
Key trends indicate accelerating regulatory harmonization, particularly in Europe where the Fertilising Products Regulation (EU 2019/1009) and its 2025 implementation guidance establish standardized biostimulant definitions, efficacy requirements, and cross-border trade frameworks eliminating previous member-state fragmentation. Innovation in multi-active formulations combining seaweed extracts, amino acids, and microbial inoculants delivers synergistic benefits addressing multiple stress factors and crop needs simultaneously, improving grower value proposition and simplifying product selection. Growing integration with precision agriculture technologies including remote sensing, variable-rate application, and decision support systems enables targeted biostimulant deployment optimizing efficacy and economic returns while generating performance data validating benefits. The market thesis could face disruption if genetic engineering including CRISPR-edited crop varieties incorporates stress tolerance traits that reduce biostimulant value proposition, or if alternative agricultural intensification pathways including controlled environment agriculture and vertical farming systems diminish traditional field crop biostimulant demand.
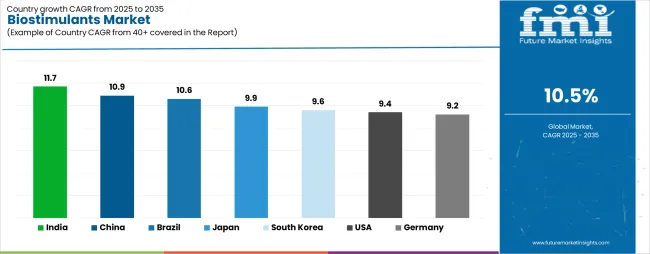
| Country | CAGR (2025-2035) |
|---|---|
| India | 11.7% |
| China | 10.9% |
| Brazil | 10.6% |
| Japan | 9.9% |
| South Korea | 9.6% |
| USA | 9.4% |
| Germany | 9.2% |
The global market is projected to grow robustly between 2025 and 2035, driven by rising demand for sustainable agriculture, soil health improvement, and higher crop yields. India leads with an 11.7% CAGR, supported by increasing adoption of organic farming practices, government incentives, and expanding agricultural production. China follows at 10.9%, driven by strong focus on ecofriendly crop management and technological integration in agriculture. Brazil records a 10.6% CAGR, supported by extensive agricultural exports and growing use of biostimulants in large-scale farming. Japan grows at 9.9%, reflecting focus on advanced agricultural biotechnology and productivity enhancement. South Korea follows with 9.6% growth, supported by precision farming adoption. The United States records a 9.4% CAGR, driven by demand for high-quality produce and green farming practices. Germany shows 9.2% growth, reflecting consistent adoption of innovative agricultural inputs to boost yield and resilience.
The report covers an in-depth analysis of 40+ countries, top-performing countries are highlighted below.
India demonstrates the strongest growth potential in the market with a CAGR of 11.7% through 2035. The country's leadership position stems from rapid horticulture sector expansion including fruits, vegetables, and plantation crops, government initiatives promoting micro-irrigation infrastructure enabling fertigation delivery systems, and Fertilizer Control Order amendments incorporating biostimulant recognition and surveillance frameworks. Growth is concentrated in major horticultural regions, including Maharashtra, Karnataka, Gujarat, and Tamil Nadu, where specialty crop production and protected cultivation are implementing advanced biostimulant programs for yield enhancement and quality improvement. Distribution channels through agricultural input dealers and direct grower engagement by specialty crop advisors expand deployment across grape vineyards, vegetable production, and fruit orchards. The country's climate stress challenges including erratic monsoons and rising temperatures provide compelling use cases for stress mitigation biostimulants.
Key market factors:
In major agricultural provinces including Shandong, Hebei, Henan, and coastal vegetable production regions, biostimulant adoption is accelerating across protected cultivation facilities and high-value crop production, driven by regulatory recognition under fertilizer law and registration framework development. The market demonstrates strong growth momentum with a CAGR of 10.9% through 2035, linked to government policies promoting chemical fertilizer reduction and biological input adoption supporting soil health and environmental sustainability objectives. Chinese producers are developing domestic biostimulant manufacturing capacity while international companies establish registration portfolios and distribution partnerships. The country's extensive greenhouse vegetable production and growing organic agriculture sector create constant demand for biostimulant solutions meeting certification requirements and quality standards.
Key market characteristics:
Brazil's market expansion is driven by comprehensive biologicals adoption in soybean and corn production systems, second-crop stress mitigation requirements during safrinha season facing moisture and heat limitations, and agricultural input industry transformation integrating biological and conventional technologies. The country demonstrates promising growth potential with a CAGR of 10.6% through 2035, supported by major agricultural input companies incorporating biostimulants into product portfolios and agronomic recommendations. Brazilian farmers are implementing biostimulant programs across extensive soybean acreage, second-crop corn facing drought stress, and sugarcane production requiring ratoon vigor enhancement. Growing sophistication in biological product understanding and increasing field validation create compelling adoption momentum across commercial agriculture operations.
Market characteristics:
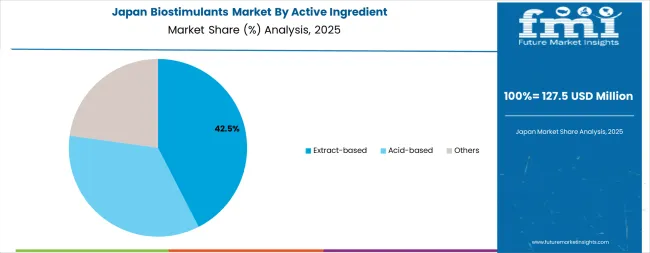
Japan's advanced agricultural technology landscape demonstrates sophisticated implementation of biostimulants in controlled environment agriculture, hydroponic systems, and high-value fruit and vegetable production requiring quality premiums. The country maintains strong growth momentum with a CAGR of 9.9% through 2035, driven by precision agriculture adoption, aging farmer demographics supporting technology-intensive production systems, and stringent quality standards demanding consistent crop performance. Japanese growers are implementing biostimulant programs across greenhouse tomatoes and strawberries, hydroponic leafy vegetables, and specialty fruit production including melons and premium cultivars. Integration with smart farming technologies including environmental monitoring and fertigation automation enables optimized biostimulant delivery synchronized with plant needs.
Key market characteristics:
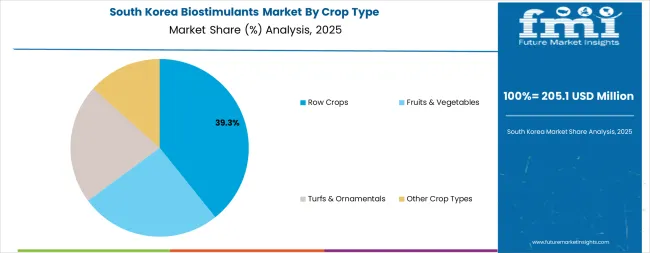
South Korea's agricultural innovation demonstrates sophisticated biostimulant integration in advanced greenhouse facilities, smart farm programs supported by government technology subsidies, and microbial biostimulant development for high-value fruit production. The country shows solid growth potential with a CAGR of 9.6% through 2035, driven by government smart farm initiatives, export-oriented specialty crop production, and food security policies supporting domestic production efficiency. Korean growers are implementing biostimulant programs across greenhouse vegetables including tomatoes and peppers, fruit production including strawberries and melons, and protected cultivation systems incorporating environmental control and precision fertigation. Technology integration including sensors and automation enables data-driven biostimulant application optimization.
Key development areas:
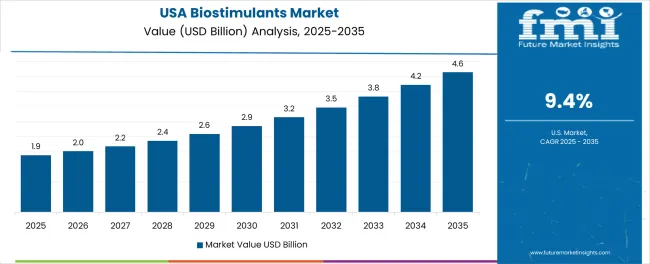
The United States market demonstrates strong biostimulant adoption in specialty crops including vegetables, fruits, and tree nuts, precision agriculture integration enabling variable-rate application, and retailer sustainability requirements driving biological input adoption across fresh produce supply chains. The country shows solid growth potential with a CAGR of 9.4% through 2035, driven by California specialty crop production, eco-friendly agriculture initiatives, and drought resilience requirements in western production regions. American growers are implementing biostimulant programs across salad vegetables, berries, tree fruits, almonds, and wine grapes, with growing interest in row crop applications supporting nutrient-use efficiency and environmental certification. Regulatory clarity under USDA organic standards and EPA oversight frameworks provides market confidence supporting commercial adoption.
Leading market segments:
Germany's sophisticated agricultural system demonstrates strong biostimulant integration aligned with European Union Fertilising Products Regulation, integrated pest management adoption supporting biological input use, and organic agriculture expansion creating demand for approved input solutions. The country maintains steady growth momentum with a CAGR of 9.2% through 2035, driven by environmental regulations, precision agriculture technology adoption, and grower sophistication in biological product evaluation and deployment. German farmers are implementing biostimulant programs across specialty crops, field vegetables, and increasingly in arable crop production supporting nutrient-use efficiency mandates and sustainability commitments. Technical advisory infrastructure and field demonstravtion networks support informed product selection and optimal application practices.
Market deelopment factors:
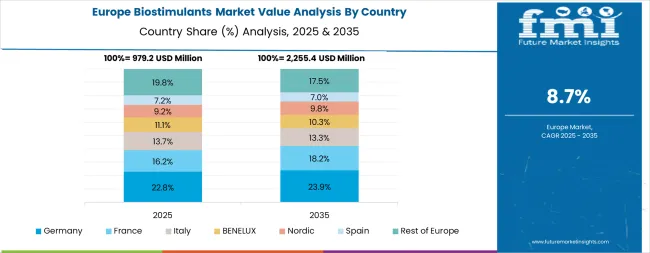
The biostimulants market in Europe accounts for an estimated 34.0% of global spending in 2025, with regional leadership in regulatory frameworks, technical sophistication, and adoption rates across specialty and row crops. Within Europe, Spain leads with approximately 18% of regional market share, supported by intensive fruit and vegetable production including greenhouse clusters in Almería and Murcia regions, strong seaweed extract adoption in horticulture, and irrigation infrastructure enabling fertigation applications.
Italy follows with approximately 16% share driven by high-value specialty crops including vineyards, olive groves, and orchards, dense network of biological formulator companies, and sophisticated grower base demanding proven efficacy. France holds approximately 14% share supported by viticulture leadership, field vegetable production, and national agri-environmental schemes accelerating biological input adoption. Germany contributes approximately 13% share through row crop nutrient-use efficiency programs, precision agriculture adoption, and robust compliance with EU Fertilising Products Regulation frameworks.
The United Kingdom represents approximately 11% share with greenhouse tomato and berry production, controlled environment agriculture investments, and retailer sustainability standards driving fresh produce supply chain requirements. Netherlands accounts for approximately 9% share anchored by world-leading greenhouse horticulture systems and export-oriented floriculture requiring consistent quality and productivity. Nordics and Benelux countries (excluding Netherlands) collectively hold approximately 8% share focusing low-impact agricultural inputs and circular bioeconomy pilot programs. Rest of Eastern Europe represents approximately 11% share expanding through horticultural production hubs, orchard modernization projects, and OEM and private-label biologicals development.
Growth across Europe is fundamentally underpinned by the harmonized EU Fertilising Products Regulation (Regulation EU 2019/1009) and its 2025 implementation guidance including FAQs and updates enabling digital labeling options, which steer demand toward standardized, higher-quality biostimulants validated through approved efficacy protocols and enable cross-border trade at scale eliminating previous member-state regulatory fragmentation. The European framework establishes plant biostimulant as a distinct fertilising product category with clear definitions, composition requirements, and efficacy validation standards supporting market development and consumer confidence.
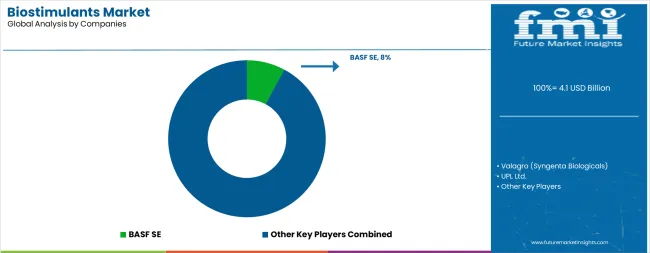
The market features approximately 20-25 meaningful players with moderate concentration, where the top three companies control roughly 22-26% of global market share through established product portfolios and extensive distribution networks. Competition centers on efficacy validation, product consistency, and technical service capabilities rather than price alone. The leading company, BASF SE, commands approximately 8.0% of global market share through its BioSolutions portfolio including seaweed extracts, amino acids, and specialty formulations, supported by acquisition strategy and strategic partnership with Acadian Plant Health announced in October 2024 incorporating seaweed-based biostimulants.
Market leaders include BASF SE, Valagro (part of Syngenta Biologicals), and UPL Ltd., which maintain competitive advantages through comprehensive product portfolios spanning multiple active ingredient categories, global distribution networks, and deep agronomic expertise supporting grower technical service, creating switching barriers through demonstrated field performance and ongoing technical support relationships. These companies leverage research and development capabilities and field trial networks to validate efficacy and expand application recommendations across diverse crops and geographies.
Challengers encompass Koppert B.V. with integrated biological solutions spanning biostimulants and biocontrol, Acadian Plant Health specializing in seaweed extracts with strong North American presence, and FMC Corporation expanding biologicals portfolio through acquisitions. Specialty players including BioAtlantis Ltd. with proprietary seaweed extraction technology, Italpollina S.p.A. with protein hydrolysate expertise, Tradecorp (part of Rovensa) with broad portfolio across Europe and Americas, and Omnia Nutriology with specialty formulations focus on specific ingredient categories or regional markets, offering differentiated capabilities in proprietary extraction methods, application technologies, and crop-specific formulations.
Regional players and emerging biologicals companies create competitive pressure through innovative formulations and direct-to-grower engagement models, particularly in high-growth markets including India, Brazil, and China where local production and distribution provide advantages in market responsiveness and technical service delivery. Market dynamics favor companies that combine proven product efficacy through field trial validation with comprehensive technical support offerings addressing complete agronomic requirements from product selection through application timing, rate optimization, and performance monitoring supporting grower success across diverse crops and production systems.
Biostimulants represent natural or nature-derived substances and microorganisms that enhance plant nutrition efficiency, stress tolerance, and quality characteristics through biological mechanisms distinct from fertilizers and pesticides, delivering 8-15% yield improvements under stress conditions and enhanced crop quality attributes supporting premium market access across diverse agricultural systems. With the market projected to grow from USD 4.1 billion in 2025 to USD 11.1 billion by 2035 at a 10.5% CAGR, these biological systems offer compelling advantages - climate resilience, nutrient-use efficiency enhancement, and sustainability credentials - making them essential for extract-based applications (42% market share), row crop production (41% share), and foliar delivery methods (49% application dominance) serving agriculture sectors seeking alternatives to synthetic-input intensification that face environmental constraints and sustainability requirements. Scaling evidence-based adoption and regulatory harmonization requires coordinated action across agricultural policy development, efficacy validation frameworks, biostimulant manufacturers, farmer education programs, and sustainable agriculture investment capital.
| Item | Value |
|---|---|
| Quantitative Units | USD 4.1 billion |
| Active Ingredient | Extract-based (Seaweed extracts, Protein hydrolysates & amino acid blends, Humic substances within extract portfolios), Acid-based (humic/fulvic acids), Others (microbial amendments, trace minerals, peptides) |
| Crop Type | Row Crops (cereals, oilseeds, pulses), Fruits & Vegetables (Berries & vines, Greenhouse vegetables, Orchards & citrus, Root & leafy veg), Turfs & Ornamentals, Other Crop Types (plantation, herbs & spices, floriculture) |
| Application | Foliar (Single-pass foliar with nutrition, Multi-pass stress-mitigation foliar, Specialty foliar), Soil/Drip, Seed/Coating |
| Regions Covered | Asia Pacific, Europe, North America, Latin America, Middle East & Africa |
| Country Covered | India, China, Brazil, Japan, South Korea, the USA, Germany, and 40+ countries |
| Key Companies Profiled | BASF, Valagro, UPL, Koppert, Acadian Plant Health, FMC Corporation, BioAtlantis, Italpollina, Tradecorp, Omnia Nutriology |
| Additional Attributes | Dollar sales by active ingredient, crop type, and application categories, regional adoption trends across Asia Pacific, Europe, and North America, competitive landscape with biologicals manufacturers and agricultural input integrators, field trial validation requirements and specifications, integration with precision agriculture and organic farming initiatives, innovations in extraction technology and formulation systems, and development of specialized products with enhanced efficacy and regulatory compliance capabilities. |
The global biostimulants market is estimated to be valued at USD 4.1 billion in 2025.
The market size for the biostimulants market is projected to reach USD 11.1 billion by 2035.
The biostimulants market is expected to grow at a 10.5% CAGR between 2025 and 2035.
The key product types in biostimulants market are extract-based, acid-based and others.
In terms of crop type, row crops segment to command 41.0% share in the biostimulants market in 2025.


Our Research Products

The "Full Research Suite" delivers actionable market intel, deep dives on markets or technologies, so clients act faster, cut risk, and unlock growth.

The Leaderboard benchmarks and ranks top vendors, classifying them as Established Leaders, Leading Challengers, or Disruptors & Challengers.

Locates where complements amplify value and substitutes erode it, forecasting net impact by horizon

We deliver granular, decision-grade intel: market sizing, 5-year forecasts, pricing, adoption, usage, revenue, and operational KPIs—plus competitor tracking, regulation, and value chains—across 60 countries broadly.

Spot the shifts before they hit your P&L. We track inflection points, adoption curves, pricing moves, and ecosystem plays to show where demand is heading, why it is changing, and what to do next across high-growth markets and disruptive tech

Real-time reads of user behavior. We track shifting priorities, perceptions of today’s and next-gen services, and provider experience, then pace how fast tech moves from trial to adoption, blending buyer, consumer, and channel inputs with social signals (#WhySwitch, #UX).

Partner with our analyst team to build a custom report designed around your business priorities. From analysing market trends to assessing competitors or crafting bespoke datasets, we tailor insights to your needs.
Supplier Intelligence
Discovery & Profiling
Capacity & Footprint
Performance & Risk
Compliance & Governance
Commercial Readiness
Who Supplies Whom
Scorecards & Shortlists
Playbooks & Docs
Category Intelligence
Definition & Scope
Demand & Use Cases
Cost Drivers
Market Structure
Supply Chain Map
Trade & Policy
Operating Norms
Deliverables
Buyer Intelligence
Account Basics
Spend & Scope
Procurement Model
Vendor Requirements
Terms & Policies
Entry Strategy
Pain Points & Triggers
Outputs
Pricing Analysis
Benchmarks
Trends
Should-Cost
Indexation
Landed Cost
Commercial Terms
Deliverables
Brand Analysis
Positioning & Value Prop
Share & Presence
Customer Evidence
Go-to-Market
Digital & Reputation
Compliance & Trust
KPIs & Gaps
Outputs
Full Research Suite comprises of:
Market outlook & trends analysis
Interviews & case studies
Strategic recommendations
Vendor profiles & capabilities analysis
5-year forecasts
8 regions and 60+ country-level data splits
Market segment data splits
12 months of continuous data updates
DELIVERED AS:
PDF EXCEL ONLINE
Seed Biostimulants Market Size and Share Forecast Outlook 2025 to 2035
Demand for Biostimulants in EU Size and Share Forecast Outlook 2025 to 2035
Humic and Fulvic Acid Based Biostimulants Market Size and Share Forecast Outlook 2025 to 2035

Thank you!
You will receive an email from our Business Development Manager. Please be sure to check your SPAM/JUNK folder too.
Chat With
MaRIA