
- Market Size (2026)
- USD 35.9 Bn
- Forecast (2036)
- USD 109.6 Bn
- CAGR (2026 to 2036)
- 11.8%
How big is the Supply Chain Management Market in 2026?
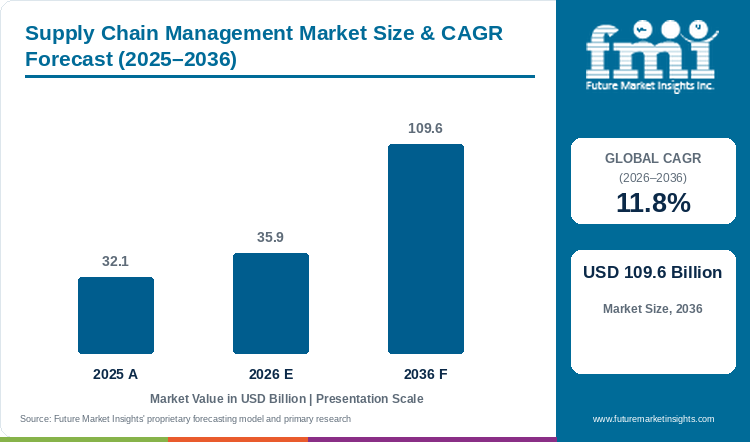
Subscription spending on planning, procurement and execution software should expand the Supply Chain Management Market to USD 109.6 billion by 2036. FMI estimates 2026 revenue at USD 35.9 billion, which implies an 11.8% CAGR across 2026 to 2036. The market was valued at USD 32.1 billion in 2025. Cloud-Based solutions hold 63.7% by deployment in 2026. Integrated SCM Platform/Suite leads solution at 38.6%, and Large Enterprises account for 55.5% by enterprise size.
Cloud migration and tighter inventory control drive the outlook. Eurostat found that 52.7% of EU enterprises paid for cloud computing services in 2025. US businesses are also running leaner. The US Census Bureau reported a total inventories-to-sales ratio of 1.33 in August 2026, down from 1.40 a year earlier. Less buffer stock raises the cost of each forecast error, so firms spend more on planning tools.
Implementation effort is the main restraint. A new platform must exchange clean data with ERP, carrier and supplier systems before it pays back. Manhattan Associates earned USD 134.4 million from services in the third quarter of 2026, close to its cloud revenue. SAP offers a qualified example of cloud demand. Its current cloud backlog rose 28.0% to EUR 24.1 billion at 30 September 2026. That figure spans all SAP cloud products, so it shows direction and not the size of this market.
Key Market Trends & Insights
- Planning vendors are embedding AI agents into daily workflows. About 10.0% of the Kinaxis installed customer base held a paid or trial subscription to Maestro Agents at 30 June 2026. Kingdee launched its Lingee agent platform on 20 May 2026 and has deployed more than 40 agents. Early uptake leaves most installed customers still to convert, which supports add-on revenue for several years.
- Acquisitions are widening logistics software suites. Descartes bought OrderMine in March 2026, Idelic in April, Drivin in July and TAI in August. The e2open business added USD 541.2 million of revenue in its first 11 months under WiseTech Global. Buyers gain broader single-vendor contracts but must follow integration roadmaps they do not control.
- Vendors are raising guidance on stronger bookings. Kinaxis lifted its 2026 revenue guidance to USD 625.0 million to USD 640.0 million in August 2026. Manhattan Associates reported another record bookings quarter for the three months to September. Firmer guidance from planning and execution specialists points to sustained software budgets through the rest of 2026.
Regional Highlights
- In Europe, use of business software still varies widely by country. Eurostat found that 73.0% of enterprises in Denmark and Finland used ERP, CRM or BI software in 2025, against 31.0% in Bulgaria and 32.0% in Romania. Vendors with packaged cloud modules can reach the lower-adoption markets where firms have not yet bought full suites.
- In East Asia, factory digitalisation is building a base for planning and execution software. The China Academy of Information and Communications Technology reported that 89.6% of major industrial firms had undertaken digital retrofitting by December 2025. Korea ran around 30,000 smart factories in 2024, according to the US International Trade Administration. Connected plants produce the operating data that supply chain planning tools need.
Supply Chain Management Market Size and Forecast
Table 1: Supply Chain Management Market Size and Forecast
| Market size and forecast | Value |
|---|---|
| Market size in 2025 | USD 32.1 billion |
| Estimated market size in 2026 | USD 35.9 billion |
| Projected market size by 2036 | USD 109.6 billion |
| CAGR from 2026 to 2036 | 11.8% |
Source: Future Market Insights analysis of the supply chain management market, 2026.
Analyst Perspective
“Buyers now judge supply chain software on how quickly a planning change becomes an executed order, and they ask for proof from live customers before they sign. Vendors separate themselves through one data model across planning, warehouse and transport tasks, and through AI agents that act inside those workflows. Integration is the adoption barrier, because a platform that cannot read clean data from ERP systems, carriers and suppliers delays go-live and weakens the business case.”
- Sudip Saha, Principal Consultant, FMI
How is the Supply Chain Management Market segmented?
- By solution: Software (Integrated SCM Platform/Suite, Supply Chain Planning, Warehouse Management Software, Transportation Management Software, Sourcing and Procurement, Order Management, and Others Standalone Solutions) and Services (Outsource Supply Chain Management Services, Integration and Implementation Services, Support and Maintenance Services, and Consulting Services).
- By deployment: Cloud-Based and On-Premises.
- By enterprise size: Large Enterprises and Small and Medium Enterprises (SMEs).
- By industry: Retail and Consumer Goods, Manufacturing, Automotive, Healthcare and Pharma, Food and Beverages, Transportation and Logistics, and Others.
- By region: North America, Latin America, Western Europe, Eastern Europe, East Asia, South Asia and Pacific, and Middle East and Africa.
Why does Cloud-Based lead by Deployment in the Supply Chain Management Market in 2026?
Cloud-Based solutions hold 63.7% of the Supply Chain Management Market by deployment in 2026.
Vendors now sell new capacity mainly as subscriptions. Customers accept that model because updates and AI features arrive without separate upgrade projects. Manhattan Associates grew cloud subscription revenue to USD 134.4 million in the July to September 2026 quarter, from USD 104.9 million a year earlier. Its maintenance revenue on older licences fell to USD 29.2 million from USD 30.5 million. Each renewal cycle moves more of the installed base onto cloud contracts.
Specialist planning vendors show the same pattern. Kinaxis grew SaaS revenue 20.0% to USD 106.5 million in the second quarter of 2026. In the EU, 30.1% of enterprises that bought cloud services in 2025 used them for ERP software. A hosted ERP record gives cloud planning tools a cleaner data source and shortens integration work.
On-Premises deployment holds the remaining 36.3% by deployment. Plants with strict uptime needs often keep scheduling close to the shop floor, where it connects with systems in the manufacturing execution systems market. Manhattan still booked USD 3.6 million of software licence revenue in the third quarter, up from USD 1.4 million. Local licences therefore remain a live purchasing option for some buyers.
Table 2: Deployment, 2026 Share
| Leading Share | 2026 market share |
|---|---|
| Cloud-Based | 63.7% |
| All Other Segments Combined Share | 36.3% |
Source: Future Market Insights analysis of the supply chain management market, 2026.
Why does Integrated SCM Platform/Suite lead by Solution in the Supply Chain Management Market in 2026?
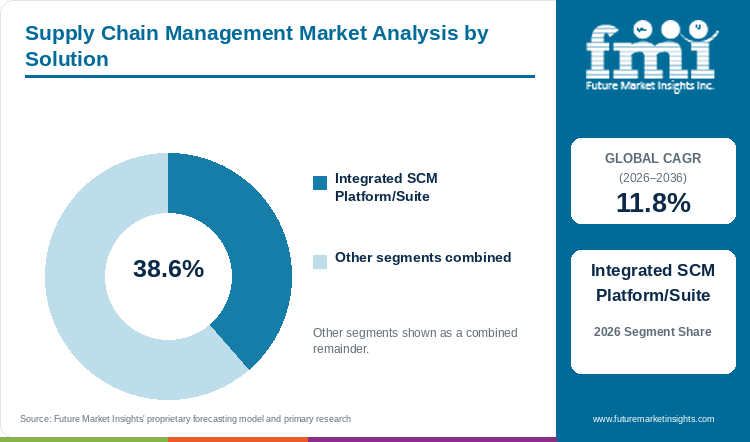
In 2026, Integrated SCM Platform/Suite accounts for 38.6% of Supply Chain Management Market revenue by solution.
Buyers prefer one data model across planning, warehouse, transport and procurement. Every separate tool adds another interface to build and maintain. SAP's Cloud ERP Suite revenue rose 29.0% to EUR 5.9 billion in the quarter to 30 September 2026. Suites that share finance and order records reduce the handoffs a planner must reconcile by hand. ERP-led suites of this type also feature in the Microsoft Dynamics market.
Logistics software vendors are assembling suites through acquisition. WiseTech Global's FY26 revenue rose 79.0% to USD 1.4 billion after its purchase of e2open. Its core CargoWise platform grew 11.0% to USD 756.9 million over the same year. Most of the increase therefore came from adding e2open's applications to one commercial offer.
Supply Chain Planning, Warehouse Management Software, Transportation Management Software, Sourcing and Procurement, Order Management, Others Standalone Solutions and the four service categories together hold the remaining 61.4%. Specialist tools still win where planning depth matters most. Kinaxis reached annual recurring revenue of USD 465.6 million at 30 June 2026, up 19.0%.
Table 3: Solution, 2026 Share
| Leading Share | 2026 market share |
|---|---|
| Integrated SCM Platform/Suite | 38.6% |
| All Other Segments Combined Share | 61.4% |
Source: Future Market Insights analysis of the supply chain management market, 2026.
Why do Large Enterprises lead by Enterprise Size in the Supply Chain Management Market in 2026?
Large Enterprises account for 55.5% by enterprise size in FMI's 2026 assessment of the Supply Chain Management Market.
Big firms run more sites, suppliers and product lines. They buy more modules and pay for longer implementations as a result. They also already own the ERP backbone that supply chain software draws on. Eurostat found that 89.0% of large EU enterprises used ERP software in 2025, against 41.0% of small firms. Business intelligence use stood at 69.0% in large firms and 11.0% in small ones.
Large firms are also quicker to add AI. The US Census Bureau found that 37.0% of firms with at least 250 employees used AI in their operations. Kingdee counts 70 Fortune Global 500 companies and 381 China Top 500 companies among its customers. Accounts of this size carry multi-year contracts and wide module coverage.
Small and Medium Enterprises hold the remaining 44.5% by enterprise size. Cloud delivery is narrowing the difference in access. Eurostat reported paid cloud use at 49.3% of small enterprises and 66.8% of medium firms in 2025, against 84.7% of large ones. Packaged cloud modules let a smaller firm start with one function and add others later.
Table 4: Enterprise Size, 2026 Share
| Leading Share | 2026 market share |
|---|---|
| Large Enterprises | 55.5% |
| All Other Segments Combined Share | 44.5% |
Source: Future Market Insights analysis of the supply chain management market, 2026.
What are the key drivers restraints and opportunities?
Supply chain software revenue rises when subscription contracts compound and customers add modules. The same contracts deliver revenue later than planned when implementation and data work overrun.
Driver
Cloud subscriptions are compounding across the largest vendors. SAP expects 2026 cloud revenue toward the upper end of EUR 25.8 billion to EUR 26.2 billion at constant currencies. That range implies growth of 23.0% to 25.0% on the prior year. Kingdee's cloud subscription revenue rose 20.4% in the first half of 2026. Recurring contracts add revenue each year without a new sale, which supports a double-digit outlook.
Restraint
Implementation and continuing support absorb a large share of each contract. Kinaxis earned USD 42.1 million from professional services in the second quarter of 2026, out of USD 158.8 million in total revenue. Professional services revenue grew 12.0% on a year earlier. FMI attributes most of this work to integration with ERP, carrier and supplier systems. Long projects delay subscription revenue and raise the total cost a buyer must approve.
Opportunity
Supplier coordination is the clearest opportunity. Buyers want purchase orders, invoices and shipping documents to move between firms without manual entry. Coupa runs a network of more than 10 million buyers and suppliers. Its customer NFI Industries manages USD 1.8 billion in spend and is automating nearly 70.0% of its transactions. Supplier contracts run alongside these workflows, which links the opportunity to the contract lifecycle management market.
How do logistics rules and supply chain policies affect software purchasing?
Governments are asking firms to measure and report supply chain performance. Japan's revised Logistics Efficiency Act began applying to large shippers on 1 April 2026. China's action plan targets total logistics costs of about 13.5% of GDP by 2027. Those costs reached CNY 14.2 trillion in the first three quarters of 2025. Targets of this kind reward firms that can track loads, routes and inventory by site.
The United Kingdom is building shared risk intelligence. The Department for Business and Trade published the action plan for its new Supply Chain Centre on 17 June 2026. Its Global Supply Chains Intelligence Programme combines government and industry data to flag risks by product, supplier and geography. The analysis covers 36 broad categories of growth-driving inputs. Firms that hold their own supplier maps can act faster when an alert arrives.
What limits reliable supply chain software delivery and service quality?
Delivery capacity depends on skilled staff. In 2023, 57.5% of EU enterprises that recruited or tried to recruit ICT specialists found those posts hard to fill. Supply chain projects need people who understand both data models and warehouse or transport operations. A shortage of such staff pushes back go-live dates and raises consulting rates.
Vendor restructuring can also strain service. WiseTech Global booked USD 67.1 million of restructuring costs in FY26, mostly for its AI Transformation programme. That programme removed about 1,200 roles across the group. The company also reported USD 64.0 million of run-rate cost savings at e2open. Buyers of acquired products should confirm support teams and roadmaps before they renew.
Where can supply chain software suppliers win additional business?
Suppliers can sell AI agents, procurement modules and cloud migrations to customers they already serve. Kingdee signed AI-native contracts worth RMB 605.0 million in the six months to June 2026, up 159.2%. Manhattan's quarterly maintenance revenue of USD 29.2 million marks a base of licence customers that could move to cloud. Procurement modules extend a supply chain contract into purchasing, which overlaps with the procurement software market. Each extension raises revenue per account without the cost of winning a new customer.
Supply Chain Management Market by Country (2026 to 2036)
Table 5: Supply Chain Management Market Country Growth Forecast
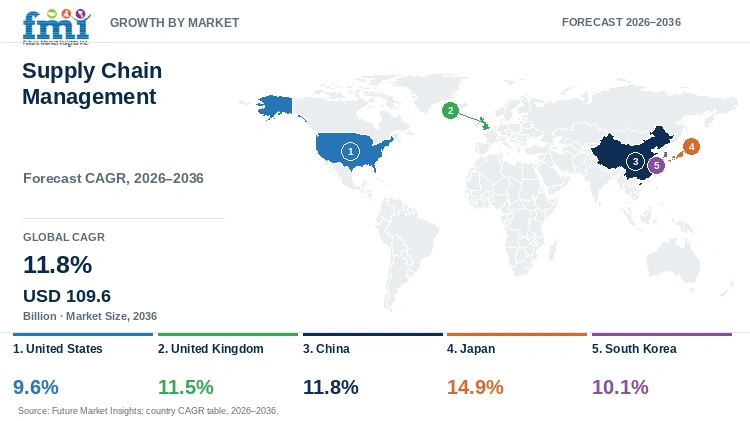
| Country | CAGR, 2026 to 2036 |
|---|---|
| Japan | 14.9% |
| China | 11.8% |
| United Kingdom | 11.5% |
| South Korea | 10.1% |
| United States | 9.6% |
Source: Future Market Insights analysis of the supply chain management market, 2026.
Japan
Japan has turned logistics efficiency into a legal duty for its largest shippers. The revised Logistics Efficiency Act began applying to specified shippers on 1 April 2026, according to METI. Firms handling at least 90,000 tonnes of cargo a year fall under the rule, about 3,200 companies in all. Each must appoint a chief logistics officer from senior management. Each must also file a medium to long-term plan by the end of October 2026.
The law sets national KPIs that only system records can prove. Against 2019 levels, it targets a cut in waiting and loading time of 125 hours per person each year. It also targets a 16.0% rise in transport capacity through better loading. METI's own programme aims for truck load efficiency of 50.0%. Its consumer goods study counts about 300,000 person-months a year spent on product information work. A shared product information platform is targeted to start operating in 2026.
Spending driven by these obligations makes Japan the quickest-growing country in this report, with revenue rising at a 14.9% CAGR from 2026 to 2036. Shippers need planning, yard and transport tools that log dwell times and load factors by site. The first periodic reports fall due at the end of July 2027. Japanese ownership also gives one global vendor a direct route into these accounts. Panasonic Holdings expects higher Blue Yonder sales to lift its Connect segment in the year to March 2027. Connect reported higher first-quarter sales with Blue Yonder named among the sources. Vendors without Japanese-language support and local integration partners will struggle to win these contracts.
China
Cost reduction is the central commercial argument in China. The NDRC reported that total social logistics costs fell to 13.9% of GDP in 2025. That was the first reading below 14.0%. It was also 0.8 percentage points below the level at the end of the 2016 to 2020 plan period. The national action plan targets about 13.5% by 2027. Each further cut must come from better routing, inventory placement and load planning. An 11.8% CAGR from 2026 to 2036 keeps China level with the global market on this cost-led demand.
Domestic cloud vendors are capturing much of this spending. Kingdee International grew first-half 2026 revenue by 13.6% to RMB 3.6 billion. Its cloud subscription revenue reached RMB 2.0 billion, and subscription ARR stood at RMB 4.4 billion. AI-native product revenue nearly tripled to RMB 296.0 million. These figures show Chinese buyers moving core business software onto subscriptions at scale.
Policy pressure on logistics cost supports steady buying across manufacturing and distribution. In FMI's view, growth will come more from customer counts than from deal size. Manufacturers that have already digitised plants now need planning layers that link factory data with warehouses and carriers. That sequence favours suppliers that can sell subscription modules into existing ERP estates. Foreign suites will compete mainly for multinational accounts with global planning teams.
United Kingdom
British firms are buying supply chain software as a response to risk. The ONS found that 48.0% of businesses with 10 or more employees were concerned about at least one supply chain factor in September 2026. That share was 17 percentage points higher than a year earlier. International conflict worried 32.0% of these firms, and shipping disruption worried 21.0%.
Concern of this kind turns into demand for visibility and scenario tools. The Department for Business and Trade plans to develop clearer standards for businesses on mapping supply chains and exploring alternative sourcing. Mid-sized importers that follow those standards will need software to hold supplier tiers, lead times and alternative routes. Fuel costs add pressure in transport-heavy sectors. In late September 2026, 73.0% of businesses expressed some concern about fuel prices.
AI use adds a second source of demand. The same survey found that 30.0% of UK businesses used at least one AI technology in September 2026. Use reached 51.0% in the largest size band. Risk mapping and AI adoption together support an 11.5% CAGR for the United Kingdom for 2026 to 2036, just below the global rate. Tight budgets in energy-intensive sectors may delay some projects. The DBT plan also commits the centre to pursue business matchmaking between UK producers and users of critical goods. Software that records qualified alternative suppliers makes that matchmaking usable at short notice. Vendors that price modular visibility tools for mid-sized firms should capture the next group of buyers.
South Korea
South Korean demand is anchored in factory automation. The US International Trade Administration reports that Korea plans more than 100 AI-based manufacturing zones by 2030. The plan also includes training 40,000 skilled workers for automated sites. A financing initiative of up to USD 7.5 billion, announced in September 2024, backs the AI Autonomous Manufacturing Project. Korean conglomerates are accelerating automation across the supply chain, the same guide notes.
Automated plants need planning and execution systems that react within the shift. Samsung SDS reported second-quarter 2026 cloud revenue of KRW 779.4 billion, up 17.0%. It credited ERP projects in shipbuilding for part of its managed-service growth. Its logistics revenue rose 6.6% to KRW 2.0 trillion, helped by external business around the Cello Square platform. IT services revenue grew more slowly, rising 5.0% to KRW 1.8 trillion. Automation-led demand supports a 10.1% CAGR for South Korea over 2026 to 2036, below the global rate.
Much of this work runs through group IT affiliates such as Samsung SDS, which limits the share open to outside vendors. Trade policy adds another factor. The UK has agreed supply chain cooperation provisions in its free trade agreement with the Republic of Korea, to be implemented subject to Parliamentary procedure. Exporters selling into several markets need traceability across their suppliers. Vendors that partner with Korean system integrators should reach mid-tier suppliers faster than those selling direct.
United States
Growth in the United States depends on replacement and expansion within a large installed base. Business inventories reached USD 2,818.8 billion at the end of August 2026, up 4.6% on a year earlier. Sales rose 10.2% over the same period. Firms are moving more goods with proportionally less stock, which raises the cost of planning errors.
Vendors serving US shippers report steady demand. Manhattan Associates lifted remaining performance obligations to USD 2.6 billion at 30 September 2026, up 25.0%. It guided full-year 2026 revenue to about USD 1.2 billion. Descartes paid about USD 25.3 million for Idelic in April 2026 and about USD 99.3 million for TAI in August. Each deal adds a module that existing logistics customers can buy.
AI use is spreading unevenly across firm sizes. The Census Bureau reported business AI use at 19.8% in early May 2026. Among firms with 100 to 249 employees the rate was 32.0%. Fewer than 20.0% of firms with four or fewer employees used AI. Very small firms remain a large base for packaged cloud tools. A deep installed base and slower take-up among smaller firms leave the US with a 9.6% CAGR during 2026 to 2036, the lowest of the five countries. Most large shippers already own core planning and warehouse systems. Growth will therefore come from cloud migration, AI add-ons and logistics modules sold to existing accounts.
Who are the notable companies in the Supply Chain Management Market?
SAP, Manhattan Associates, Kinaxis and WiseTech Global show four distinct routes into supply chain software. SAP competes as an ERP-led suite vendor, with third-quarter 2026 cloud revenue of EUR 6.7 billion, up 26.0%. Manhattan Associates unifies front-end sales with back-end supply chain execution. Its cloud revenue passed services revenue in that same quarter. Kinaxis presents itself as a planning and orchestration specialist built on its Maestro platform. WiseTech Global combines its CargoWise logistics platform with e2open, which it bought in August 2025.
Descartes grows through a steady run of acquisitions. Its Global Logistics Network serves shipping, carrier and trade operations. Quarterly revenue rose 12.0% to USD 201.1 million in the period to July 2026. Coupa approaches the market from spend management. It agreed in May 2026 to buy Rossum, which automates transactional documents in global supply chains.
Blue Yonder operates within Panasonic Holdings, which expects it to lift sales in the Connect segment. Kingdee sells cloud ERP subscriptions in China with subscription ARR of RMB 4.4 billion. Samsung SDS combines cloud services with a logistics business in Korea. Buyers should compare data models, integration partners and post-acquisition roadmaps before they commit to a suite.
Key Developments in the Supply Chain Management Market
- In February 2026, Blue Yonder Holding, Inc. released its Q4 2025 company highlights, announcing enhancements to its Demand and Supply Planning and Warehouse Management solutions. The updates included integration of a Sustainable Supply Chain Manager to quantify emissions and waste impacts, and improved interoperability with logistics and warehouse execution systems. Blue Yonder reported FY25 revenue of USD 1.42 billion, including 10.4% SaaS revenue growth year-over-year [6].
- In March 2026, Oracle Corporation launched Oracle Fusion Cloud Advanced Inventory Management, a new solution within Oracle Fusion Cloud Supply Chain and Manufacturing designed to help healthcare, manufacturing, and distribution organizations automate and streamline warehouse operations. The solution uses embedded AI to optimize stock levels, trigger replenishment actions, and automate routine inventory tasks without requiring a full-scale warehouse management system [7].
- In October 2025, SAP SE announced SAP Supply Chain Orchestration, an AI-native solution combining the Joule platform with a live knowledge graph to detect real-time supply chain risks several suppliers deep and coordinate a response. The solution was introduced at the inaugural SAP Connect event as part of the SAP Business Suite, targeting customers seeking to reduce costs and prevent supply disruption through automated, multi-tier risk management [8].
Key Players in the Supply Chain Management Market
- SAP SE
- Oracle Corporation
- International Business Machines Corporation (IBM)
- Manhattan Associates, Inc.
- Blue Yonder (Panasonic Holdings Corporation)
- Kinaxis Inc.
- The Descartes Systems Group Inc.
- WiseTech Global Limited (e2open)
- Coupa Software
- Kingdee International Software Group Company Limited
- Samsung SDS Co., Ltd.
Supply Chain Management Market Report Scope
Table 6: Supply Chain Management Market Report Scope
| Coverage field | Report scope |
|---|---|
| Market definition | Revenue from supply chain management software and related services for planning, procurement, execution, inventory and logistics. Physical logistics services such as freight transport and warehouse operation are excluded. |
| Solution | Software: Integrated SCM Platform/Suite; Supply Chain Planning; Warehouse Management Software; Transportation Management Software; Sourcing and Procurement; Order Management; Others Standalone Solutions. Services: Outsource Supply Chain Management Services; Integration and Implementation Services; Support and Maintenance Services; Consulting Services |
| Deployment | Cloud-Based; On-Premises |
| Enterprise Size | Large Enterprises; Small and Medium Enterprises (SMEs) |
| Industry | Retail and Consumer Goods; Manufacturing; Automotive; Healthcare and Pharma; Food and Beverages; Transportation and Logistics; Others |
| Regions covered | North America, Latin America, Western Europe, Eastern Europe, East Asia, South Asia and Pacific, Middle East and Africa |
| Profiled markets | Japan, China, United Kingdom, South Korea, United States |
| Companies covered | SAP SE; Oracle Corporation; IBM; Manhattan Associates, Inc.; Blue Yonder; Kinaxis Inc.; The Descartes Systems Group Inc.; WiseTech Global Limited (e2open); Coupa Software; Kingdee International Software Group; Samsung SDS Co., Ltd. |
| Quantitative Units | USD billion |
Source: Future Market Insights analysis of the supply chain management market, 2026.
Supply Chain Management Market Research Methodology
The supply chain management assessment draws on official business technology surveys, national statistics, government policy documents and vendor disclosures. FMI measures annual revenue from supply chain software subscriptions, licences and related services. Segment values are classified by solution, deployment and enterprise size, with industry and region as further views. Country forecasts reflect local adoption, policy obligations and vendor activity over the same 2026 to 2036 period. Software revenue, services revenue and adoption rates are reviewed as separate measures.
Supply Chain Management Market by Segments
Supply Chain Management Market segmented by Solution:
- Software
- Integrated SCM Platform/Suite
- Supply Chain Planning
- Warehouse Management Software
- Transportation Management Software
- Sourcing and Procurement
- Order Management
- Others Standalone Solutions
- Services
- Outsource Supply Chain Management Services
- Integration and Implementation Services
- Support and Maintenance Services
- Consulting Services
Supply Chain Management Market segmented by Deployment:
- Cloud-Based
- On-Premises
Supply Chain Management Market segmented by Enterprise Size:
- Large Enterprises
- Small and Medium Enterprises (SMEs)
Supply Chain Management Market segmented by Industry:
- Retail and Consumer Goods
- Manufacturing
- Automotive
- Healthcare and Pharma
- Food and Beverages
- Transportation and Logistics
- Others
Supply Chain Management Market by Region
- North America
- United States
- Canada
- Mexico
- Latin America
- Brazil
- Chile
- Rest of Latin America
- Western Europe
- Germany
- United Kingdom
- Italy
- Spain
- France
- Nordics
- Benelux
- Rest of Western Europe
- Eastern Europe
- Russia
- Poland
- Hungary
- Balkan and Baltic Countries
- Rest of Eastern Europe
- East Asia
- China
- Japan
- South Korea
- South Asia and Pacific
- India
- ASEAN
- Australia and New Zealand
- Rest of South Asia and Pacific
- Middle East and Africa
- Saudi Arabia
- Other GCC Countries
- Türkiye
- South Africa
- Other African Union
- Rest of Middle East and Africa
Research Sources and Bibliography
- [1] Eurostat. (2026, January). Cloud computing: statistics on the use by enterprises. Statistics Explained, data extracted January 2026.
- [2] U.S. Census Bureau. (2026, October 15). Manufacturing and Trade Inventories and Sales, August 2026.
- [3] Eurostat. (2026, May 20). Larger enterprises used more e-business apps in 2025.
- [4] SAP SE. (2026, October 21). Quarterly Statement Q3 2026. Form 6-K, Exhibit 99.1. U.S. Securities and Exchange Commission. https://www.sec.gov/Archives/edgar/data/0001000184/000110465926118617/tm2628113d1_ex99-1.htm
- [5] Manhattan Associates, Inc. (2026, October 27). Form 8-K, Exhibit 99.1: Manhattan Associates reports third quarter 2026 results. U.S. Securities and Exchange Commission. https://www.sec.gov/Archives/edgar/data/0001056696/000119312526434178/manh-ex99_1.htm
- [6] Blue Yonder Holding, Inc. (2026). Blue Yonder Releases Q4 2025 Company Highlights and Showcases New Solution Enhancements. https://www.businesswire.com/news/home/20260209683028/en
- [7] Oracle Corporation. (2026). Oracle Helps Customers Boost Supply Chain Efficiency with New Advanced Inventory Management Solution. https://www.prnewswire.com/news-releases/oracle-helps-customers-boost-supply-chain-efficiency-with-new-advanced-inventory-management-solution-302512538.html
- [8] SAP SE. (2025). SAP Business Suite Unites AI, Data and Applications to Power the Next Generation of Enterprise Transformation. https://www.acnnewswire.com/press-release/english/90193/sap-business-suite-unites-ai-data-and-applications-to-power-the-next-generation-of-enterprise-transformation
- https://www.sec.gov/Archives/edgar/data/0001050140/000110465926106807/dsgx-20260731xex99d1.htm
- [9] WiseTech Global Limited. (2026, August 26). WTC record revenue, up 79%, exceeds guidance EBITDA, up 54%. ASX Announcement 2026/51. https://announcements.asx.com.au/asxpdf/20260826/pdf/07379lj9h8npgj.pdf
- [10] Coupa Software. (2026, March 30). Coupa Inspire 2026 showcases real AI results for business network impact with global brands. https://www.coupa.com/newsroom/coupa-inspire-2026-showcases-real-ai-results-for-business-network-impact-with-global-brands/
- [11] Coupa Software. (2026, May 12). Coupa adquiere Rossum para acelerar la gestión autónoma del gasto de principio a fin (Coupa to acquire Rossum). https://www.coupa.com/es/newsroom/coupa-adquiere-rossum-para-acelerar-la-gestion-autonoma-del-gasto-de-principio-a-fin/
- [12] Kingdee International Software Group Company Limited. (2026, August 11). Kingdee International Announces 2026 Interim Results. https://investor.kingdee.com/static/temp/KingdeeInternationalAnnounces2026_1786444287826.pdf
- [13] U.S. Census Bureau. (2026, May). Large Firms With at Least 20 Employees Biggest AI Users. America Counts. https://census.gov/library/stories/2026/05/ai-use-businesses.html
- [14] Panasonic Holdings Corporation. (2026, May 29). Panasonic Group FY2026 Financial Results, FY2027 Forecast, and Group Growth Strategy: Key Points. https://news.panasonic.com/global/stories/18722
- [15] Panasonic Holdings Corporation. (2026, August 26). Panasonic Group FY2027 1Q Key Points. https://news.panasonic.com/global/stories/18938
- [16] Ministry of Economy, Trade and Industry, Japan. (2026, April 27). Explanatory materials on the revised Logistics Efficiency Act (Butsuryu Koritsuka Ho). https://www.meti.go.jp/policy/economy/distribution/260427_bukkouho-explanation-all.pdf
- [17] Ministry of Economy, Trade and Industry, Japan. (2026, June). METI initiatives overview, Physical Internet study group materials. https://www.meti.go.jp/shingikai/mono_info_service/physical_internet/pdf/2026_001_03_02.pdf
- [18] People's Government of Hunan Province. (2026, February 9). China's logistics costs-to-GDP ratio hits record low in 2025 (Xinhua, citing the National Development and Reform Commission). https://enghunan.gov.cn/hneng/News/Text_News/202602/t20260209_33913155.html
- [19] State Council of the People's Republic of China. (2025, October 27). China's logistics costs to GDP ratio remained at record low in Jan-Sept. https://english.www.gov.cn/archive/statistics/202510/27/content_WS68ff78b6c6d00ca5f9a0718f.html
- [20] People's Government of Henan Province. (2026, February 23). China's manufacturing digital drive reaches mass adoption stage: report (Xinhua, citing the China Academy of Information and Communications Technology). https://english.henan.gov.cn/2026/02-23/3327474.html
- [21] International Trade Administration, U.S. Department of Commerce. (2026, June 29). South Korea Country Commercial Guide: Manufacturing Technology (Smart Factory). https://trade.gov/country-commercial-guides/south-korea-manufacturing-technology-smart-factory
- [22] Samsung SDS Co., Ltd. (2026, July 30). Samsung SDS Announces Second-Quarter 2026 Financial Results. https://www.samsungsds.com/en/news/1295231_5252.html
- [23] Office for National Statistics. (2026, October 8). Business insights and impact on the UK economy: 8 October 2026.
- [24] Department for Business and Trade, UK Government. (2026, June 17). Supply Chain Centre mission statement and action plan. https://www.gov.uk/government/publications/supply-chain-centre-mission-statement-and-action-plan/supply-chain-centre-mission-statement-and-action-plan-web-version
- [25] Eurostat. (2025, June). ICT specialists: statistics on hard-to-fill vacancies in enterprises. Statistics Explained, data extracted June 2025. https://ec.europa.eu/eurostat/statistics-explained/index.php?title=ICT_specialists_-_statistics_on_hard-to-fill_vacancies_in_enterprises
Table of Content
- Key Takeaways
- Market Size and CAGR
- Top Growth Driver
- Fastest Growing Segment
- Leading Region
- Key Companies
- Emerging Opportunities
- Executive Summary
- Global Market Outlook
- Demand-side Trends
- Supply-side Trends
- Technology Roadmap Analysis
- Analysis and Recommendations
- Analyst Perspective (What is happening? Why now? What should investors know?)
- Key Questions Answered
- How large is the market?
- What is the CAGR?
- What are key trends?
- Which region dominates?
- Who are the leaders?
Read More...
- Market Overview
- Market Coverage / Taxonomy
- Market Definition / Scope / Limitations
- Research Methodology
- Chapter Orientation
- Analytical Lens and Working Hypotheses
- Market Structure, Signals, and Trend Drivers
- Benchmarking and Cross-market Comparability
- Market Sizing, Forecasting, and Opportunity Mapping
- Research Design and Evidence Framework
- Desk Research Programme (Secondary Evidence)
- Expert Input and Fieldwork (Primary Evidence)
- Tooling, Models, and Reference Databases
- Data Engineering and Model Build
- Quality Assurance and Audit Trail
- Market Background
- Market Dynamics (Drivers, Restraints, Opportunity, Trends)
- Scenario Forecast (Optimistic, Likely, Conservative)
- Impact Analysis
- AI Impact
- Sustainability Impact
- Regulatory Impact
- Technology Impact
- Consumer / Buyer Analysis
- Purchase Drivers
- Adoption Barriers
- Buyer Journey
- Opportunity Map Analysis
- Product Life Cycle Analysis
- Supply Chain Analysis
- Investment Feasibility Matrix
- Value Chain Analysis
- PESTLE and Porter's Analysis
- Regulatory Landscape
- Regional Parent Market Outlook
- Production and Consumption Statistics
- Import and Export Statistics
- Global Market Analysis and Forecast, 2021 to 2036
- Historical Market Size Value (USD Billion) Analysis, 2021 to 2025
- Current and Future Market Size Value (USD Billion) Projections, 2026 to 2036
- Y-o-Y Growth Trend Analysis
- Absolute $ Opportunity Analysis
- Global Market Pricing Analysis, 2021 to 2036
- Global Market Analysis and Forecast, By Solution, 2021 to 2036
- Introduction / Key Findings
- Historical Market Size Value (USD Billion) Analysis By Solution, 2021 to 2025
- Current and Future Market Size Value (USD Billion) Analysis and Forecast By Solution, 2026 to 2036
- Software
- Integrated SCM Platform/Suite
- Supply Chain Planning
- Warehouse Management Software
- Transportation Management Software
- Sourcing and Procurement
- Order Management
- Others Standalone Solutions
- Services
- Outsource Supply Chain Management Services
- Integration and Implementation Services
- Support and Maintenance Services
- Consulting Services
- Y-o-Y Growth Trend Analysis By Solution, 2021 to 2025
- Absolute $ Opportunity Analysis By Solution, 2026 to 2036
- Global Market Analysis and Forecast, By Deployment, 2021 to 2036
- Introduction / Key Findings
- Historical Market Size Value (USD Billion) Analysis By Deployment, 2021 to 2025
- Current and Future Market Size Value (USD Billion) Analysis and Forecast By Deployment, 2026 to 2036
- Cloud-Based
- On-Premises
- Y-o-Y Growth Trend Analysis By Deployment, 2021 to 2025
- Absolute $ Opportunity Analysis By Deployment, 2026 to 2036
- Global Market Analysis and Forecast, By Enterprise Size, 2021 to 2036
- Introduction / Key Findings
- Historical Market Size Value (USD Billion) Analysis By Enterprise Size, 2021 to 2025
- Current and Future Market Size Value (USD Billion) Analysis and Forecast By Enterprise Size, 2026 to 2036
- Large Enterprises
- Small and Medium Enterprises (SMEs)
- Y-o-Y Growth Trend Analysis By Enterprise Size, 2021 to 2025
- Absolute $ Opportunity Analysis By Enterprise Size, 2026 to 2036
- Global Market Analysis and Forecast, By Industry, 2021 to 2036
- Introduction / Key Findings
- Historical Market Size Value (USD Billion) Analysis By Industry, 2021 to 2025
- Current and Future Market Size Value (USD Billion) Analysis and Forecast By Industry, 2026 to 2036
- Retail and Consumer Goods
- Manufacturing
- Automotive
- Healthcare and Pharma
- Food and Beverages
- Transportation and Logistics
- Others
- Y-o-Y Growth Trend Analysis By Industry, 2021 to 2025
- Absolute $ Opportunity Analysis By Industry, 2026 to 2036
- Global Market Analysis and Forecast, By Region, 2021 to 2036
- Introduction
- Historical Market Size Value (USD Billion) Analysis By Region, 2021 to 2025
- Current Market Size Value (USD Billion) Analysis and Forecast By Region, 2026 to 2036
- North America
- Latin America
- Western Europe
- Eastern Europe
- East Asia
- South Asia and Pacific
- Middle East and Africa
- Market Attractiveness Analysis By Region
- North America Market Analysis and Forecast, By Country, 2021 to 2036
- Historical Market Size Value (USD Billion) Trend Analysis By Market Taxonomy, 2021 to 2025
- Market Size Value (USD Billion) Forecast By Market Taxonomy, 2026 to 2036
- By Country
- United States
- Canada
- Mexico
- By Solution
- By Deployment
- By Enterprise Size
- By Industry
- By Country
- Market Attractiveness Analysis
- By Country
- By Solution
- By Deployment
- By Enterprise Size
- By Industry
- Key Takeaways
- Latin America Market Analysis and Forecast, By Country
- Historical Market Size Value (USD Billion) Trend Analysis By Market Taxonomy, 2021 to 2025
- Market Size Value (USD Billion) Forecast By Market Taxonomy, 2026 to 2036
- By Country
- Brazil
- Chile
- Rest of Latin America
- By Solution
- By Deployment
- By Enterprise Size
- By Industry
- By Country
- Market Attractiveness Analysis
- By Country
- By Solution
- By Deployment
- By Enterprise Size
- By Industry
- Key Takeaways
- Western Europe Market Analysis and Forecast, By Country
- Historical Market Size Value (USD Billion) Trend Analysis By Market Taxonomy, 2021 to 2025
- Market Size Value (USD Billion) Forecast By Market Taxonomy, 2026 to 2036
- By Country
- Germany
- United Kingdom
- Italy
- Spain
- France
- Nordics
- Benelux
- Rest of Western Europe
- By Solution
- By Deployment
- By Enterprise Size
- By Industry
- By Country
- Market Attractiveness Analysis
- By Country
- By Solution
- By Deployment
- By Enterprise Size
- By Industry
- Key Takeaways
- Eastern Europe Market Analysis and Forecast, By Country
- Historical Market Size Value (USD Billion) Trend Analysis By Market Taxonomy, 2021 to 2025
- Market Size Value (USD Billion) Forecast By Market Taxonomy, 2026 to 2036
- By Country
- Russia
- Poland
- Hungary
- Balkan and Baltic Countries
- Rest of Eastern Europe
- By Solution
- By Deployment
- By Enterprise Size
- By Industry
- By Country
- Market Attractiveness Analysis
- By Country
- By Solution
- By Deployment
- By Enterprise Size
- By Industry
- Key Takeaways
- East Asia Market Analysis and Forecast, By Country
- Historical Market Size Value (USD Billion) Trend Analysis By Market Taxonomy, 2021 to 2025
- Market Size Value (USD Billion) Forecast By Market Taxonomy, 2026 to 2036
- By Country
- China
- Japan
- South Korea
- By Solution
- By Deployment
- By Enterprise Size
- By Industry
- By Country
- Market Attractiveness Analysis
- By Country
- By Solution
- By Deployment
- By Enterprise Size
- By Industry
- Key Takeaways
- South Asia and Pacific Market Analysis and Forecast, By Country
- Historical Market Size Value (USD Billion) Trend Analysis By Market Taxonomy, 2021 to 2025
- Market Size Value (USD Billion) Forecast By Market Taxonomy, 2026 to 2036
- By Country
- India
- ASEAN
- Australia and New Zealand
- Rest of South Asia and Pacific
- By Solution
- By Deployment
- By Enterprise Size
- By Industry
- By Country
- Market Attractiveness Analysis
- By Country
- By Solution
- By Deployment
- By Enterprise Size
- By Industry
- Key Takeaways
- Middle East and Africa Market Analysis and Forecast, By Country
- Historical Market Size Value (USD Billion) Trend Analysis By Market Taxonomy, 2021 to 2025
- Market Size Value (USD Billion) Forecast By Market Taxonomy, 2026 to 2036
- By Country
- Saudi Arabia
- Other GCC Countries
- Türkiye
- South Africa
- Other African Union
- Rest of Middle East and Africa
- By Solution
- By Deployment
- By Enterprise Size
- By Industry
- By Country
- Market Attractiveness Analysis
- By Country
- By Solution
- By Deployment
- By Enterprise Size
- By Industry
- Key Takeaways
- Key Countries Market Analysis
- United States
- Pricing Analysis
- Market Share Analysis, 2025
- By Solution
- By Deployment
- By Enterprise Size
- By Industry
- Canada
- Pricing Analysis
- Market Share Analysis, 2025
- By Solution
- By Deployment
- By Enterprise Size
- By Industry
- Mexico
- Pricing Analysis
- Market Share Analysis, 2025
- By Solution
- By Deployment
- By Enterprise Size
- By Industry
- Brazil
- Pricing Analysis
- Market Share Analysis, 2025
- By Solution
- By Deployment
- By Enterprise Size
- By Industry
- Chile
- Pricing Analysis
- Market Share Analysis, 2025
- By Solution
- By Deployment
- By Enterprise Size
- By Industry
- Germany
- Pricing Analysis
- Market Share Analysis, 2025
- By Solution
- By Deployment
- By Enterprise Size
- By Industry
- United Kingdom
- Pricing Analysis
- Market Share Analysis, 2025
- By Solution
- By Deployment
- By Enterprise Size
- By Industry
- Italy
- Pricing Analysis
- Market Share Analysis, 2025
- By Solution
- By Deployment
- By Enterprise Size
- By Industry
- Spain
- Pricing Analysis
- Market Share Analysis, 2025
- By Solution
- By Deployment
- By Enterprise Size
- By Industry
- France
- Pricing Analysis
- Market Share Analysis, 2025
- By Solution
- By Deployment
- By Enterprise Size
- By Industry
- India
- Pricing Analysis
- Market Share Analysis, 2025
- By Solution
- By Deployment
- By Enterprise Size
- By Industry
- ASEAN
- Pricing Analysis
- Market Share Analysis, 2025
- By Solution
- By Deployment
- By Enterprise Size
- By Industry
- Australia and New Zealand
- Pricing Analysis
- Market Share Analysis, 2025
- By Solution
- By Deployment
- By Enterprise Size
- By Industry
- China
- Pricing Analysis
- Market Share Analysis, 2025
- By Solution
- By Deployment
- By Enterprise Size
- By Industry
- Japan
- Pricing Analysis
- Market Share Analysis, 2025
- By Solution
- By Deployment
- By Enterprise Size
- By Industry
- South Korea
- Pricing Analysis
- Market Share Analysis, 2025
- By Solution
- By Deployment
- By Enterprise Size
- By Industry
- Russia
- Pricing Analysis
- Market Share Analysis, 2025
- By Solution
- By Deployment
- By Enterprise Size
- By Industry
- Poland
- Pricing Analysis
- Market Share Analysis, 2025
- By Solution
- By Deployment
- By Enterprise Size
- By Industry
- Hungary
- Pricing Analysis
- Market Share Analysis, 2025
- By Solution
- By Deployment
- By Enterprise Size
- By Industry
- Türkiye
- Pricing Analysis
- Market Share Analysis, 2025
- By Solution
- By Deployment
- By Enterprise Size
- By Industry
- South Africa
- Pricing Analysis
- Market Share Analysis, 2025
- By Solution
- By Deployment
- By Enterprise Size
- By Industry
- United States
- Market Structure Analysis
- Competition Dashboard
- Competition Benchmarking
- Market Share Analysis of Top Players
- By Regional
- By Solution
- By Deployment
- By Enterprise Size
- By Industry
- Emerging Startups
- Innovation Benchmarking
- Competition Analysis
- Competition Deep Dive
- SAP SE
- Overview
- Product Portfolio
- Profitability by Market Segments
- Sales Footprint
- Strategy Overview
- Marketing Strategy
- Product Strategy
- Channel Strategy
- Manhattan Associates, Inc.
- Kinaxis Inc.
- The Descartes Systems Group Inc.
- WiseTech Global Limited
- Oracle Corporation
- International Business Machines Corporation (IBM)
- Blue Yonder (Panasonic Holdings Corporation)
- WiseTech Global Limited (e2open)
- Coupa Software
- Kingdee International Software Group Company Limited
- Samsung SDS Co., Ltd.
- SAP SE
- Case Studies
- Success Stories
- Recent Developments
- Competition Deep Dive
- Assumptions & Acronyms Used
List of Tables
- Table 1: Global Market Value (USD Billion) Forecast by Region, 2021 to 2036
- Table 2: Global Market Value (USD Billion) Forecast by Solution, 2021 to 2036
- Table 3: Global Market Value (USD Billion) Forecast by Deployment, 2021 to 2036
- Table 4: Global Market Value (USD Billion) Forecast by Enterprise Size, 2021 to 2036
- Table 5: Global Market Value (USD Billion) Forecast by Industry, 2021 to 2036
- Table 6: North America Market Value (USD Billion) Forecast by Country, 2021 to 2036
- Table 7: North America Market Value (USD Billion) Forecast by Solution, 2021 to 2036
- Table 8: North America Market Value (USD Billion) Forecast by Deployment, 2021 to 2036
- Table 9: North America Market Value (USD Billion) Forecast by Enterprise Size, 2021 to 2036
- Table 10: North America Market Value (USD Billion) Forecast by Industry, 2021 to 2036
- Table 11: Latin America Market Value (USD Billion) Forecast by Country, 2021 to 2036
- Table 12: Latin America Market Value (USD Billion) Forecast by Solution, 2021 to 2036
- Table 13: Latin America Market Value (USD Billion) Forecast by Deployment, 2021 to 2036
- Table 14: Latin America Market Value (USD Billion) Forecast by Enterprise Size, 2021 to 2036
- Table 15: Latin America Market Value (USD Billion) Forecast by Industry, 2021 to 2036
- Table 16: Western Europe Market Value (USD Billion) Forecast by Country, 2021 to 2036
- Table 17: Western Europe Market Value (USD Billion) Forecast by Solution, 2021 to 2036
- Table 18: Western Europe Market Value (USD Billion) Forecast by Deployment, 2021 to 2036
- Table 19: Western Europe Market Value (USD Billion) Forecast by Enterprise Size, 2021 to 2036
- Table 20: Western Europe Market Value (USD Billion) Forecast by Industry, 2021 to 2036
- Table 21: Eastern Europe Market Value (USD Billion) Forecast by Country, 2021 to 2036
- Table 22: Eastern Europe Market Value (USD Billion) Forecast by Solution, 2021 to 2036
- Table 23: Eastern Europe Market Value (USD Billion) Forecast by Deployment, 2021 to 2036
- Table 24: Eastern Europe Market Value (USD Billion) Forecast by Enterprise Size, 2021 to 2036
- Table 25: Eastern Europe Market Value (USD Billion) Forecast by Industry, 2021 to 2036
- Table 26: East Asia Market Value (USD Billion) Forecast by Country, 2021 to 2036
- Table 27: East Asia Market Value (USD Billion) Forecast by Solution, 2021 to 2036
- Table 28: East Asia Market Value (USD Billion) Forecast by Deployment, 2021 to 2036
- Table 29: East Asia Market Value (USD Billion) Forecast by Enterprise Size, 2021 to 2036
- Table 30: East Asia Market Value (USD Billion) Forecast by Industry, 2021 to 2036
- Table 31: South Asia and Pacific Market Value (USD Billion) Forecast by Country, 2021 to 2036
- Table 32: South Asia and Pacific Market Value (USD Billion) Forecast by Solution, 2021 to 2036
- Table 33: South Asia and Pacific Market Value (USD Billion) Forecast by Deployment, 2021 to 2036
- Table 34: South Asia and Pacific Market Value (USD Billion) Forecast by Enterprise Size, 2021 to 2036
- Table 35: South Asia and Pacific Market Value (USD Billion) Forecast by Industry, 2021 to 2036
- Table 36: Middle East and Africa Market Value (USD Billion) Forecast by Country, 2021 to 2036
- Table 37: Middle East and Africa Market Value (USD Billion) Forecast by Solution, 2021 to 2036
- Table 38: Middle East and Africa Market Value (USD Billion) Forecast by Deployment, 2021 to 2036
- Table 39: Middle East and Africa Market Value (USD Billion) Forecast by Enterprise Size, 2021 to 2036
- Table 40: Middle East and Africa Market Value (USD Billion) Forecast by Industry, 2021 to 2036
List of Figures
- Figure 1: Global Market Pricing Analysis
- Figure 2: Global Market Value (USD Billion) Forecast 2021-2036
- Figure 3: Global Market Value Share and BPS Analysis by Solution, 2026 and 2036
- Figure 4: Global Market Y-o-Y Growth Comparison by Solution, 2026-2036
- Figure 5: Global Market Attractiveness Analysis by Solution
- Figure 6: Global Market Value Share and BPS Analysis by Deployment, 2026 and 2036
- Figure 7: Global Market Y-o-Y Growth Comparison by Deployment, 2026-2036
- Figure 8: Global Market Attractiveness Analysis by Deployment
- Figure 9: Global Market Value Share and BPS Analysis by Enterprise Size, 2026 and 2036
- Figure 10: Global Market Y-o-Y Growth Comparison by Enterprise Size, 2026-2036
- Figure 11: Global Market Attractiveness Analysis by Enterprise Size
- Figure 12: Global Market Value Share and BPS Analysis by Industry, 2026 and 2036
- Figure 13: Global Market Y-o-Y Growth Comparison by Industry, 2026-2036
- Figure 14: Global Market Attractiveness Analysis by Industry
- Figure 15: Global Market Value (USD Billion) Share and BPS Analysis by Region, 2026 and 2036
- Figure 16: Global Market Y-o-Y Growth Comparison by Region, 2026-2036
- Figure 17: Global Market Attractiveness Analysis by Region
- Figure 18: North America Market Incremental Dollar Opportunity, 2026-2036
- Figure 19: Latin America Market Incremental Dollar Opportunity, 2026-2036
- Figure 20: Western Europe Market Incremental Dollar Opportunity, 2026-2036
- Figure 21: Eastern Europe Market Incremental Dollar Opportunity, 2026-2036
- Figure 22: East Asia Market Incremental Dollar Opportunity, 2026-2036
- Figure 23: South Asia and Pacific Market Incremental Dollar Opportunity, 2026-2036
- Figure 24: Middle East and Africa Market Incremental Dollar Opportunity, 2026-2036
- Figure 25: North America Market Value Share and BPS Analysis by Country, 2026 and 2036
- Figure 26: North America Market Value Share and BPS Analysis by Solution, 2026 and 2036
- Figure 27: North America Market Y-o-Y Growth Comparison by Solution, 2026-2036
- Figure 28: North America Market Attractiveness Analysis by Solution
- Figure 29: North America Market Value Share and BPS Analysis by Deployment, 2026 and 2036
- Figure 30: North America Market Y-o-Y Growth Comparison by Deployment, 2026-2036
- Figure 31: North America Market Attractiveness Analysis by Deployment
- Figure 32: North America Market Value Share and BPS Analysis by Enterprise Size, 2026 and 2036
- Figure 33: North America Market Y-o-Y Growth Comparison by Enterprise Size, 2026-2036
- Figure 34: North America Market Attractiveness Analysis by Enterprise Size
- Figure 35: North America Market Value Share and BPS Analysis by Industry, 2026 and 2036
- Figure 36: North America Market Y-o-Y Growth Comparison by Industry, 2026-2036
- Figure 37: North America Market Attractiveness Analysis by Industry
- Figure 38: Latin America Market Value Share and BPS Analysis by Country, 2026 and 2036
- Figure 39: Latin America Market Value Share and BPS Analysis by Solution, 2026 and 2036
- Figure 40: Latin America Market Y-o-Y Growth Comparison by Solution, 2026-2036
- Figure 41: Latin America Market Attractiveness Analysis by Solution
- Figure 42: Latin America Market Value Share and BPS Analysis by Deployment, 2026 and 2036
- Figure 43: Latin America Market Y-o-Y Growth Comparison by Deployment, 2026-2036
- Figure 44: Latin America Market Attractiveness Analysis by Deployment
- Figure 45: Latin America Market Value Share and BPS Analysis by Enterprise Size, 2026 and 2036
- Figure 46: Latin America Market Y-o-Y Growth Comparison by Enterprise Size, 2026-2036
- Figure 47: Latin America Market Attractiveness Analysis by Enterprise Size
- Figure 48: Latin America Market Value Share and BPS Analysis by Industry, 2026 and 2036
- Figure 49: Latin America Market Y-o-Y Growth Comparison by Industry, 2026-2036
- Figure 50: Latin America Market Attractiveness Analysis by Industry
- Figure 51: Western Europe Market Value Share and BPS Analysis by Country, 2026 and 2036
- Figure 52: Western Europe Market Value Share and BPS Analysis by Solution, 2026 and 2036
- Figure 53: Western Europe Market Y-o-Y Growth Comparison by Solution, 2026-2036
- Figure 54: Western Europe Market Attractiveness Analysis by Solution
- Figure 55: Western Europe Market Value Share and BPS Analysis by Deployment, 2026 and 2036
- Figure 56: Western Europe Market Y-o-Y Growth Comparison by Deployment, 2026-2036
- Figure 57: Western Europe Market Attractiveness Analysis by Deployment
- Figure 58: Western Europe Market Value Share and BPS Analysis by Enterprise Size, 2026 and 2036
- Figure 59: Western Europe Market Y-o-Y Growth Comparison by Enterprise Size, 2026-2036
- Figure 60: Western Europe Market Attractiveness Analysis by Enterprise Size
- Figure 61: Western Europe Market Value Share and BPS Analysis by Industry, 2026 and 2036
- Figure 62: Western Europe Market Y-o-Y Growth Comparison by Industry, 2026-2036
- Figure 63: Western Europe Market Attractiveness Analysis by Industry
- Figure 64: Eastern Europe Market Value Share and BPS Analysis by Country, 2026 and 2036
- Figure 65: Eastern Europe Market Value Share and BPS Analysis by Solution, 2026 and 2036
- Figure 66: Eastern Europe Market Y-o-Y Growth Comparison by Solution, 2026-2036
- Figure 67: Eastern Europe Market Attractiveness Analysis by Solution
- Figure 68: Eastern Europe Market Value Share and BPS Analysis by Deployment, 2026 and 2036
- Figure 69: Eastern Europe Market Y-o-Y Growth Comparison by Deployment, 2026-2036
- Figure 70: Eastern Europe Market Attractiveness Analysis by Deployment
- Figure 71: Eastern Europe Market Value Share and BPS Analysis by Enterprise Size, 2026 and 2036
- Figure 72: Eastern Europe Market Y-o-Y Growth Comparison by Enterprise Size, 2026-2036
- Figure 73: Eastern Europe Market Attractiveness Analysis by Enterprise Size
- Figure 74: Eastern Europe Market Value Share and BPS Analysis by Industry, 2026 and 2036
- Figure 75: Eastern Europe Market Y-o-Y Growth Comparison by Industry, 2026-2036
- Figure 76: Eastern Europe Market Attractiveness Analysis by Industry
- Figure 77: East Asia Market Value Share and BPS Analysis by Country, 2026 and 2036
- Figure 78: East Asia Market Value Share and BPS Analysis by Solution, 2026 and 2036
- Figure 79: East Asia Market Y-o-Y Growth Comparison by Solution, 2026-2036
- Figure 80: East Asia Market Attractiveness Analysis by Solution
- Figure 81: East Asia Market Value Share and BPS Analysis by Deployment, 2026 and 2036
- Figure 82: East Asia Market Y-o-Y Growth Comparison by Deployment, 2026-2036
- Figure 83: East Asia Market Attractiveness Analysis by Deployment
- Figure 84: East Asia Market Value Share and BPS Analysis by Enterprise Size, 2026 and 2036
- Figure 85: East Asia Market Y-o-Y Growth Comparison by Enterprise Size, 2026-2036
- Figure 86: East Asia Market Attractiveness Analysis by Enterprise Size
- Figure 87: East Asia Market Value Share and BPS Analysis by Industry, 2026 and 2036
- Figure 88: East Asia Market Y-o-Y Growth Comparison by Industry, 2026-2036
- Figure 89: East Asia Market Attractiveness Analysis by Industry
- Figure 90: South Asia and Pacific Market Value Share and BPS Analysis by Country, 2026 and 2036
- Figure 91: South Asia and Pacific Market Value Share and BPS Analysis by Solution, 2026 and 2036
- Figure 92: South Asia and Pacific Market Y-o-Y Growth Comparison by Solution, 2026-2036
- Figure 93: South Asia and Pacific Market Attractiveness Analysis by Solution
- Figure 94: South Asia and Pacific Market Value Share and BPS Analysis by Deployment, 2026 and 2036
- Figure 95: South Asia and Pacific Market Y-o-Y Growth Comparison by Deployment, 2026-2036
- Figure 96: South Asia and Pacific Market Attractiveness Analysis by Deployment
- Figure 97: South Asia and Pacific Market Value Share and BPS Analysis by Enterprise Size, 2026 and 2036
- Figure 98: South Asia and Pacific Market Y-o-Y Growth Comparison by Enterprise Size, 2026-2036
- Figure 99: South Asia and Pacific Market Attractiveness Analysis by Enterprise Size
- Figure 100: South Asia and Pacific Market Value Share and BPS Analysis by Industry, 2026 and 2036
- Figure 101: South Asia and Pacific Market Y-o-Y Growth Comparison by Industry, 2026-2036
- Figure 102: South Asia and Pacific Market Attractiveness Analysis by Industry
- Figure 103: Middle East and Africa Market Value Share and BPS Analysis by Country, 2026 and 2036
- Figure 104: Middle East and Africa Market Value Share and BPS Analysis by Solution, 2026 and 2036
- Figure 105: Middle East and Africa Market Y-o-Y Growth Comparison by Solution, 2026-2036
- Figure 106: Middle East and Africa Market Attractiveness Analysis by Solution
- Figure 107: Middle East and Africa Market Value Share and BPS Analysis by Deployment, 2026 and 2036
- Figure 108: Middle East and Africa Market Y-o-Y Growth Comparison by Deployment, 2026-2036
- Figure 109: Middle East and Africa Market Attractiveness Analysis by Deployment
- Figure 110: Middle East and Africa Market Value Share and BPS Analysis by Enterprise Size, 2026 and 2036
- Figure 111: Middle East and Africa Market Y-o-Y Growth Comparison by Enterprise Size, 2026-2036
- Figure 112: Middle East and Africa Market Attractiveness Analysis by Enterprise Size
- Figure 113: Middle East and Africa Market Value Share and BPS Analysis by Industry, 2026 and 2036
- Figure 114: Middle East and Africa Market Y-o-Y Growth Comparison by Industry, 2026-2036
- Figure 115: Middle East and Africa Market Attractiveness Analysis by Industry
- Figure 116: Global Market - Tier Structure Analysis
- Figure 117: Global Market - Company Share Analysis
Frequently Asked Questions
How big is the Supply Chain Management Market in 2026?
FMI estimates the market at USD 35.9 billion in 2026, up from USD 32.1 billion in 2025. It is forecast to reach USD 109.6 billion by 2036 at an 11.8% CAGR.
Which deployment model leads the Supply Chain Management Market in 2026?
Cloud-Based solutions lead by deployment with 63.7% in 2026. On-Premises deployment holds the remaining 36.3%.
Which solution and enterprise size lead in 2026?
Integrated SCM Platform/Suite holds 38.6% by solution. Large Enterprises hold 55.5% by enterprise size in FMI's 2026 assessment.
Which country is forecast to grow fastest through 2036?
Japan has the highest forecast CAGR at 14.9% during 2026 to 2036, followed by China at 11.8%. These are FMI forecasts and are not rates reported by the cited public bodies.
How do implementation requirements affect supply chain software adoption?
Implementation work delays go-live and adds cost to each contract. Kinaxis earned USD 42.1 million from professional services in the second quarter of 2026, out of USD 158.8 million in total revenue [6].
Preview the report firsthand - request a free sample
Get SampleGet the brochure for pricing and purchase details.
Get PDF
