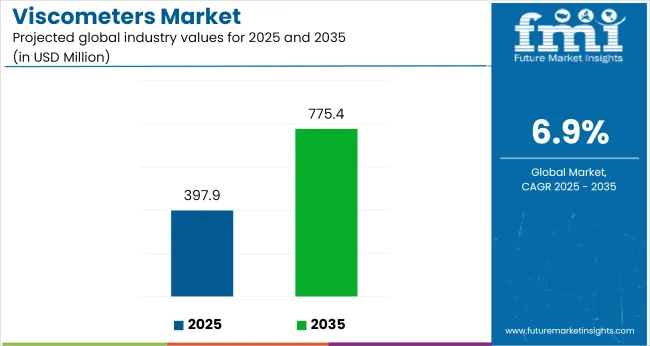
The Viscometers Market is estimated to be valued at USD 397.9 million in 2025 and is projected to reach USD 775.4 million by 2035, registering a compound annual growth rate (CAGR) of 6.9% over the forecast period.
The viscometers market is showing steady growth, supported by increasing industrial demand for fluid property measurement and strict quality control standards across manufacturing processes. Industry announcements and technological showcases have emphasized advancements in precision, digital integration, and real-time monitoring capabilities within viscometer systems.
Rotational and capillary viscometers have been widely adopted across sectors such as chemicals, oil & gas, food processing, and pharmaceuticals, driven by the need for accurate viscosity measurement in process optimization and product consistency.
Corporate investments in laboratory automation and process analytical technologies have further stimulated market adoption. Additionally, growing awareness of equipment calibration and regulatory compliance has encouraged industries to upgrade to more sophisticated viscometers.
Future market growth is expected to benefit from innovations in portable and inline viscometers, supporting real-time monitoring in industrial operations. Segmental growth is led by Rotational Viscometers, Offline sales channels, and Industrial end users, reflecting the equipment's versatility, the preference for physical product demonstrations, and strong demand from manufacturing environments.
The market is segmented by Equipment Type, Sales Channel, and End User and region. By Equipment Type, the market is divided into Rotational Viscometer, Orifice Viscometer, Capillary Viscometer, Falling Piston Viscometer, Falling Ball Viscometer, and Vibrational Viscometer. In terms of Sales Channel, the market is classified into Offline and Online.
Based on End User, the market is segmented into Industrial, Pharmaceutical, Industrial Oils and Lubricants, Paints & Coating, Food & Beverages, Petrochemicals, Cosmetics, Polymers & Rubber, Others (Research & Academician and Building & Construction Materials), and Testing & certification Agencies.
Regionally, the market is classified into North America, Latin America, Western Europe, Eastern Europe, Balkan & Baltic Countries, Russia & Belarus, Central Asia, East Asia, South Asia & Pacific, and the Middle East & Africa.
The Rotational Viscometer segment is projected to hold 37.5% of the viscometers market revenue in 2025, establishing itself as the leading equipment type. This growth has been driven by the wide applicability of rotational viscometers across various industries where accurate, continuous viscosity measurements are critical. Rotational viscometers have been favored due to their versatility in testing liquids of varying viscosities, from low-viscosity solutions to highly viscous pastes.
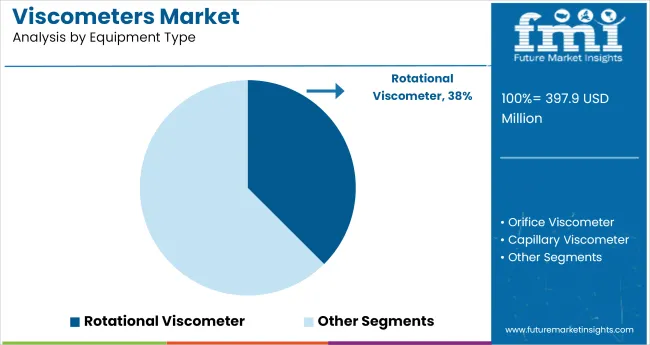
Manufacturers have focused on improving rotational viscometer designs with digital displays, automated data logging, and user-friendly interfaces, enhancing their adoption in both laboratory and production environments. Additionally, industry users have preferred these devices for their reliability and ease of calibration, supporting routine quality assurance processes.
As industrial applications continue to diversify, the Rotational Viscometer segment is expected to retain its growth momentum through advancements in material compatibility and enhanced measurement precision.
The Offline segment is projected to contribute 68.5% of the viscometers market revenue in 2025, maintaining its dominant role as the primary sales channel. This segment’s growth has been driven by the industrial buyer's preference for hands-on equipment demonstrations, personalized consultations, and post-sale service support, which are typically facilitated through offline channels.
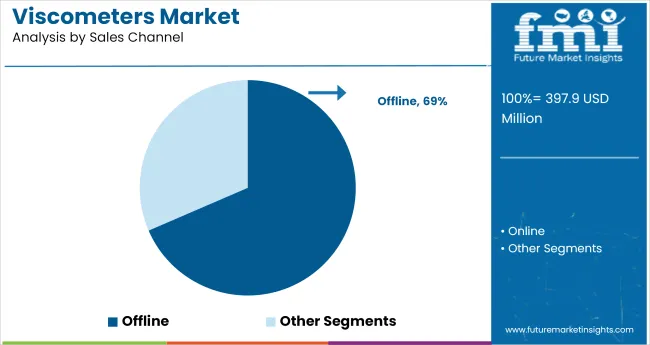
Distributors and specialized equipment suppliers have built strong relationships with industrial buyers, providing technical expertise and ensuring compliance with industry standards during procurement. Additionally, offline sales have benefited from equipment exhibitions and trade shows, where new technologies are showcased directly to decision-makers.
Industrial clients have often relied on offline channels to fulfill custom product configurations and ensure service readiness. Despite the growth of digital marketplaces, the Offline segment is expected to sustain its leadership, supported by the complex sales cycle and personalized service requirements of viscometer buyers.
The Industrial segment is projected to account for 78.0% of the viscometers market revenue in 2025, positioning it as the dominant end-user segment. Growth of this segment has been fueled by the increasing use of viscometers in industrial processes where viscosity control directly affects product performance and manufacturing efficiency.
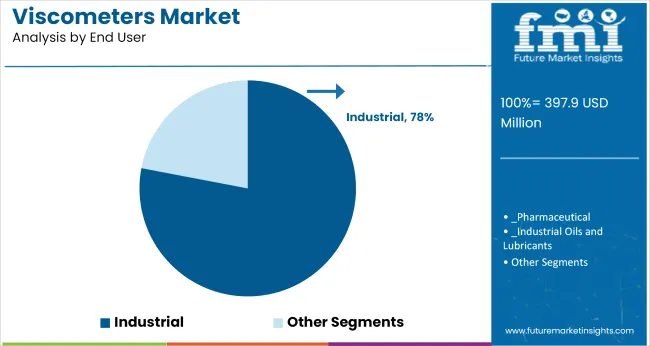
Industries such as chemicals, oil & gas, paints & coatings, and food processing have integrated viscometers into their quality control protocols to ensure consistent product formulations and process reliability. Industrial users have demanded robust and durable viscometers capable of operating in harsh environments and measuring a wide range of fluid viscosities.
Furthermore, production facilities have implemented viscosity measurement as part of inline monitoring systems to reduce downtime and optimize throughput. As industrial operations continue to adopt advanced process control technologies, the Industrial segment is expected to maintain its dominant market position, supported by continuous demand for precision fluid property analysis.
Controlling the process parameters of materials, prior to production and post-production, has become necessary in various industries. Soaring concern regarding the maintenance of precise process parameters of desired materials has compelled industries to adopt novel measuring equipment such as modern viscometer.
As per the analysis by Future Market Insights, the global viscometer market is projected to register growth at a CAGR of 6.9% during 2025 and 2035.
Rapid expansion of industrial output over the last few years has encouraged adoption of advanced solutions to measure viscosity of various materials. To maintain their position in the industry, end-users are keen to improve their batch consistency.
Increasing application of viscometer in the pharmaceutical and food sectors have create attractive opportunities for the growth of the market in the last few years. Viscometers are gaining popularity due to their adaptability, ease-of-use, and convenience that it offers for various end-to-end applications.
On the back of these factors, the global viscometer is expected to surpass USD 372.2 Million, registering year-over-year growth at 6.4% in 2024.
Easy availability of alternative and low quality products is one of the major factors creating a challenge for viscometer market players. Improving access to cost-effective viscometer substitutes, particularly in local markets, are likely to impede the sales during the forecast period.
As these products are readily available at low costs, they are strongly adopted by smaller end-users, who do not need standardized accuracy for application measurement. New entrants or small companies, especially in emerging economies, develop similar products but do not meet the product design standards. Due to this, sales of well-known brands are adversely affected.
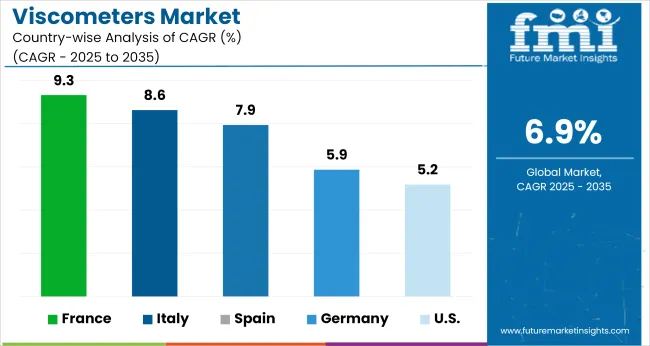
According to FMI, the USA will account for more than 70% of the North America market through 2035. Companies in the USA market will gain from the USMCA, a new deal between the USA, Mexico, and Canada that replaces North American Free Trade Agreement (NAFTA).
Presence of key players such as Thermo Fischer Inc., Ametek Inc., and TA Instruments is expected to fuel the expansion of the viscometer market during the forecast period. Additionally, expansion of various domains, such as construction, petrochemicals, and industrial oil and lubricants, are likely to boost demand growth during the projection period.
The viscometer market in Germany is expected to rise at nearly 10% CAGR over the forecast period. Germany is the world's fourth largest economy and one of the world's top machinery producers, thanks to its industrial growth and technological advancements.
Germany also has the highest level of productivity and access to other European markets due to its central location. With the expansion of numerous end-use industries across the country, application of viscometer is expected to increase, fueling sales.
Furthermore, increased research activities, presence of numerous key companies, and the country's growing industrial sectors are few factors spurring the growth of the market.
China's status as a worldwide industrial powerhouse is one of the factors fueling the expansion of industrial sectors in this country, resulting in lucrative potential for viscometer market growth.
China also is one of the world's largest producers and consumers of industrial equipment, and it is estimated to account for over 50% of viscometer sales in East Asia. As it is one of the largest global providers of high-tech solutions, rapid industrialization will result in higher application of viscometers.
In 2024, India will account for nearly 40% of sales in South Asia & Pacific. With the expansion of manufacturing sector and increasing production of electronic equipment in India, demand for viscometer is expected to surge.
Government initiatives such as Make in India and Invest in India are expected to boost manufacturing in India, creating scope for expansion of viscometers market.
Equipment based rotational viscometer will account for nearly 30% of the global market by 2035. The usage of this type is feasible in workshop area, production area, delivery area and it helps to optimize the flexibility and the control time.
With added features such as memorization, programming and data tracing, these viscometers are becoming even more user-friendly in challenging environments.
Online sales channel is estimated to account for the dominant share of nearly 60% through 2035. With rising penetration of e-commerce platforms, manufacturers are focusing on the improvement of their digital presence and work more closely with customers. In countries such as China and India, a major portion of sales revenue is earned through online sales.
In the industrial segment, the polymer & rubber segment is expected to contribute a significant revenue share and create an absolute dollar opportunity of USD 19 Million in the global viscometer market.
Increasing application in industrial equipment, including manufacturing and research, demand for viscometer is high. As the determination of solution viscosity is a prime concern for polymers as it is highly used to estimate polymers’ molar mass and other physical properties, adoption of viscometer is expected to improve.
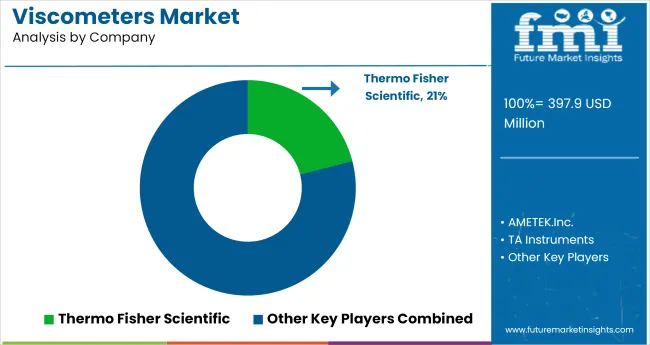
As per Future Market Insights, Thermo fisher Scientific, Ametek Inc., TA Instruments, Anton Paar Gmbh, A&D Co., Ltd. are identified as top players in viscometer market. Leading companies are expanding their product portfolios through research and development to develop customer-specific products to expand their customer base.
Key companies are also aiming for strategic collaborations with other manufacturers in order to improve their manufacturing process capabilities and meet the increasing demand for viscometer.
| Attribute | Details |
|---|---|
| Forecast Period | 2025 to 2035 |
| Historical Data Available for | 2020 to 2024 |
| Market Analysis | USD Million for Value and Units for Volume |
| Key Regions Covered | North America; Latin America; Europe; East Asia; South Asia & Pacific and the Middle East & Africa |
| Key Countries Covered | USA, Canada, Brazil, Mexico, Argentina, Colombia, Chile, Peru, Germany, UK, France, Italy, Spain, Russia, NORDICS, BENELUX, Hungary, Poland, Czech Republic, Switzerland, CIS States, China, Taiwan, Japan, South Korea, India, Bangladesh, ASEAN, ANZ, GCC Countries, Turkey, Israel, Iran, Nigeria, Kenya, Ghana, Northern Africa, and South Africa |
| Key Segments Covered | Equipment type, Sales Channel, End User and Region |
| Key Companies Profiled | Thermo Fisher Scientific; AMETEK.Inc.; TA Instruments; Anton Paar GmbH; A&D Company; Goettfert GmbH; Fann Instrument; Freeman Technology; Brabender GmbH; Cannon Instrument Company; Lamy Rheology Instruments; Shanghai Nirun Intelligent Technology Co., Ltd. |
| Report Coverage | Market Forecast, Company Share Analysis, Competition Intelligence, DROT Analysis, Market Dynamics and Challenges, and Strategic Growth Initiatives |
| Customization & Pricing | Available upon Request |
The global viscometers market is estimated to be valued at USD 397.9 million in 2025.
The market size for the viscometers market is projected to reach USD 775.4 million by 2035.
The viscometers market is expected to grow at a 6.9% CAGR between 2025 and 2035.
The key product types in viscometers market are rotational viscometer, orifice viscometer, capillary viscometer, falling piston viscometer, falling ball viscometer and vibrational viscometer.
In terms of sales channel, offline segment to command 68.5% share in the viscometers market in 2025.

Thank you!
You will receive an email from our Business Development Manager. Please be sure to check your SPAM/JUNK folder too.