2-ethylhexanol (2-EH) Market Size and Share Forecast Outlook 2025 to 2035

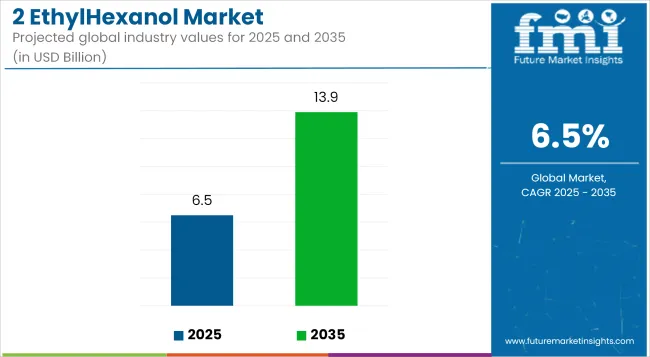
The global 2-ethylhexanol (2-EH) market is projected to grow from USD 6.5 billion in 2025 to USD 13.9 billion by 2035, registering a compound annual growth rate (CAGR) of 6.5%. Growth is supported by continued demand for 2-EH as a key intermediate in the production of plasticizers, coatings, adhesives, and synthetic lubricants.
Quick Stats for the 2-Ethylhexanol (2-EH) Market

  • Industry Value (2025): USD 6.5 billion
  • Forecast Value (2035): USD 13.9 billion
  • Forecast CAGR: 6.5%
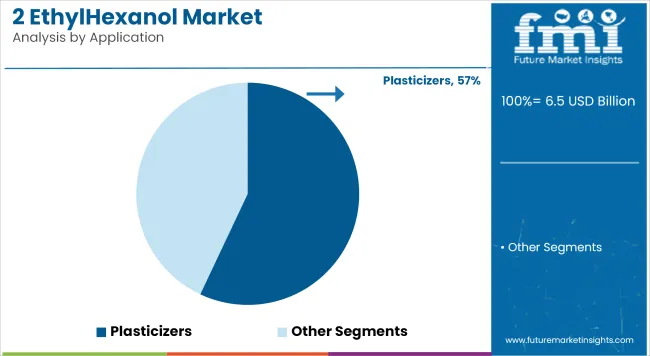
  • Leading Segment in 2025: Plasticizers (57%)
  • Key Growth Region: Asia-Pacific
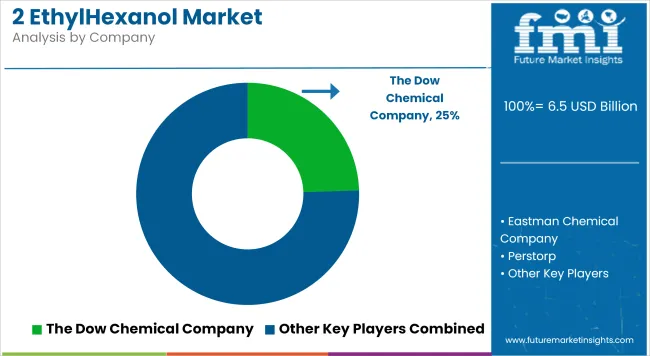
  • Top Key Players: The Dow Chemical Company, BASF SE, Perstorp, OXEA GmbH, Eastman Chemical Company

2 Ethylhexanol Market Industry Value Analysis

Metric Value
Market Size (2025) USD 6.5 Billion
Market Size (2035) USD 13.9 Billion
Compound Annual Growth Rate (CAGR) 6.5%

2-EH serves as an essential raw material in the production of di(2-ethylhexyl) phthalate (DEHP) and other plasticizers used in polyvinyl chloride (PVC) applications. These plasticizers are widely applied in construction materials, automotive components, and wire and cable insulation. Expanding infrastructure development and rapid urbanization across Asia-Pacific and the Middle East are increasing consumption of flexible PVC and associated 2-EH derivatives.

The automotive industry is contributing to steady demand, with 2-EH-based plasticizers being used in interiors, seals, and underbody protection materials. Lightweight, durable, and weather-resistant components produced with 2-EH additives are being adopted to meet evolving design and performance standards. In the building sector, 2-EH is used in flooring systems, wall coverings, and construction sealants, where flexibility and thermal stability are critical.

In the coatings and adhesives segments, 2-EH is incorporated into acrylates and other monomers for high-performance architectural and industrial coatings. These applications benefit from 2-EH's role in enhancing gloss, durability, and flow characteristics. Demand for environmentally compliant coatings has led to a shift toward water-based and low-VOC formulations, where 2-EH remains relevant due to its compatibility with green chemistry frameworks.

Technological advancements are improving downstream formulation efficiency, and research efforts are being directed toward producing 2-EH using bio-based feedstocks. Early-stage initiatives focused on biomass conversion and microbial fermentation are being explored to reduce dependency on fossil-derived n-butyraldehyde.

Analyzing 2-ethylhexanol (2-EH) Market by Top Investment Segments

Plasticizer production is expected to remain the primary application, supported by sustained demand for flexible PVC materials

The plasticizers segment is projected to account for approximately 57% of the global 2-ethylhexanol (2-EH) market share in 2025 and is expected to grow at a CAGR of 6.4% through 2035. 2-EH is a key precursor in the synthesis of phthalate and non-phthalate plasticizers such as dioctyl phthalate (DOP) and dioctyl terephthalate (DOTP), which are used to impart flexibility and durability to polyvinyl chloride (PVC) products.

These plasticizers are widely applied in cables, flooring, wall coverings, and synthetic leather. As construction and automotive sectors expand across emerging markets, and manufacturers transition to safer, high-performance formulations, the demand for 2-EH in plasticizer production continues to rise steadily.
2 Ethylhexanol Market Analysis By Application

Plastics and polymers are projected to represent a major end-use sector due to high-volume consumption in flexible and structural applications

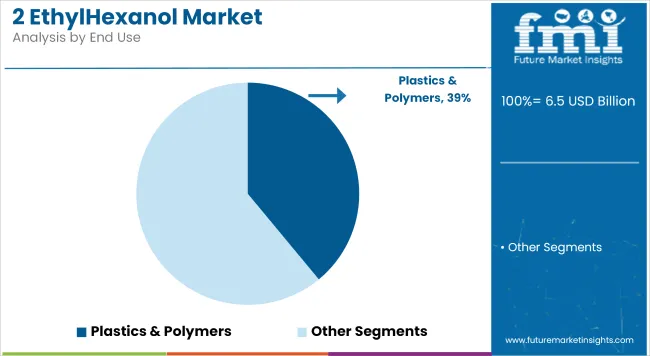
The plastics and polymers segment is estimated to hold approximately 39% of the global 2-ethylhexanol market share in 2025 and is forecast to grow at a CAGR of 6.6% through 2035. 2-EH is used as an intermediate in producing plasticizer-enhanced compounds and acrylic esters that improve flexibility, impact resistance, and processing characteristics of thermoplastics.

It supports the production of film-grade resins, synthetic rubbers, and specialty coatings. The growing use of modified polymer blends in construction materials, consumer goods, and automotive components reinforces steady consumption. With sustainability and material performance becoming central to product development, 2-EH’s role in advanced polymer systems continues to be critical across global value chains.
2 Ethylhexanol Market Analysis By End Use

Challenges and Opportunities

Challenges

Raw Material Price Volatility: Fluctuations in the cost of propylene and synthesis gas can really mess with your bottom line; making it difficult to sustain relatively stable prices or margins

Stringent Regulations: Current environmental regulations and the demand for safety mean that costs will rise as technology must capitulate; parts of production could be replaced with transporting still others halfway around town instead.

Opportunities

Emerging Market Potential: Rapid industrialisation along the East China Sea as well as in Latin America offer fresh market opportunities of all kinds for construction and automotive use.

Technological Advancements: More efficient manufacturing processes coupled with bio-derived feed stocks types now promise easier and cheaper production of 2-EH, as well as sustainability.

Country-wise outlook

United States

USA 2-EH market is rising moderately behind the expanding end-use demand for 2-EH plasticizers, improved application possibilities in fuel additives, and the robust expansion in motor vehicle and construction uses.

Building activities such as infrastructure construction and the building of residences are significant drivers of demand for multi-purpose PVC products such as cabling, flooring, and pipes based on 2-EH plasticizers. ExxonMobil, Eastman Chemical, and OQ Chemicals are increasing production to produce 2-EH as they attempt to meet the growing demand in the region.

In addition to the motor vehicle industry, which includes General Motors, Ford, and Tesla, 2-EH-based coatings, adhesives, and lubricants are being used more and more to increase car performance and lifespan. Lightness and electric vehicle (EV) boom stimulate production of high-performance 2-EH-based products.

The market for fuel additives is also growing with ongoing applications of 2-EH-based 2-ethylhexyl nitrate (2-EHN) as a cetane diesel fuel additive to attain optimal engine performance and fuel economy.

With growing use in plasticizers & coatings, growing use as fuel additives, and other automobile & construction applications, USA market for 2-EH will grow incrementally.

Country CAGR (2025 to 2035)
USA 6.1%

United Kingdom

UK 2-EH market is rising moderately due to the move towards non-phthalate plasticizers, rising demand for environmental coatings and growing use in specialty chemicals.

Britain's tough environmental regulations, especially under REACH (Registration, Evaluation, Authorisation, and Restriction of Chemicals), are forcing industries to switch towards green plasticizers from 2-EH alternatives. Building and packaging industries are leading the demand for low-VOC plasticizers and flexible PVC products, which is driving 2-EH consumption.

The automobile industry, some of whose representatives include Jaguar, Land Rover and Aston Martin, is embracing technology-intensive coatings and lubricants with the use of 2-EH formulation that promote the efficiency and the durability of the car.

Apart from this, the increasing development of specialty chemicals, such as industrial cleaning chemicals, coatings, and performance solvents, is driving the market demand correspondingly.

Since non-phthalate plasticizers are attracting more investment, growing in the coatings industry, and growing in specialty chemical uses, the UK 2-EH market will grow steadily.

Country CAGR (2025 to 2035)
UK 6.0%

European Union

The market of the European Union 2-Ethylhexanol (2-EH) is growing modestly due to increased plasticizer demand, increased application in the area of coatings and adhesives, and increasing application in the construction and automotive sectors.

2-EH is one of the raw materials with greatest application in the production of dioctyl phthalate (DOP) plasticizers, 2-EH acrylate, and 2-EH nitrate, all which find widespread applications in the polyvinyl chloride (PVC) processing industry, paints, and fuel additives.

EU emphasis upon greenery and strict environment regulation within the scenario of greenification problems through virtue of REACH is also becoming prevalent within the market under the veil of greener reduction of emissions trend fuel and plasticizer trend. 2-EH manufacturing from natural raw material is also taking shape in the form of a line of the future considering regulator pressure for carbon footprint avoidance and fossil fuel burn avoidance.

Moreover, Germany, France, and Italy's construction and automotive industries are boosting 2-EH-based adhesives, coatings, and lubricants demand. The EU green energy transition also supports the adoption of 2-EH nitrates for diesel fuel additives to increase efficiency and decrease emissions.

Country CAGR (2025 to 2035)
European Union (EU) 6.3%

Japan

The Japanese 2-EH market is expanding steadily due to increasing high-performance coatings, increased automobile industry demand, and increasing use of green plasticizers.

The Japanese automobile industry, led by Toyota, Honda, and Nissan, is finding 2-EH-based coatings and resins to a larger extent in response to contributing lightweight, corrosion protection, and durability applications. Fuel-efficient car demand growth and also EVs similarly drive demand for performance-enhancing coatings and adhesives.

The coatings and paint industry, dominated by companies like Kansai Paint and Nippon Paint, is significantly utilizing 2-EH-based resins to industrial and protection coatings. Soaring demand from sustainable formulation markets, smart-coatings markets, and scratch resistant coating markets is driving the acceptability of the market.

Apart from that, Japan's emphasis on sustainability is encouraging investment in bio-based plasticizers and non-phthalate plasticizers as alternatives to 2-EH to decrease the reliance on traditional plasticizers.

Since demand for motor vehicle coatings, application of biodegradable plasticizers, and heavy investment in specialty chemicals is increasing, the Japanese market for 2-EH will grow steadily.

Country CAGR (2025 to 2035)
Japan 6.1%

South Korea

The South Korean 2-EH market is growing well on the back of increasing application in high-performance lubricants & coatings, growing EV battery manufacturing, and growing applications in adhesives & resins.

South Korean electronics and automotive sector, led by Samsung, LG, and Hyundai, are driving the application of 2-EH-based products in protective coatings, lubricants, and adhesives. The use of resins from 2-EH is also being increasingly utilized to create foldable mobile phones, OLED display panels, and motor parts that are lighter.

SK Innovation and LG Energy Solution are leading the EV battery market to implement 2-EH-based performance chemicals and coatings for improving battery insulation and lifespan.

In addition, the construction and packaging industries in South Korea are increasingly consuming 2-EH-based sealants and plasticizers, fuelling applications in the marketplace.

South Korean 2-EH will also exhibit a healthy growth rate, spurred by increasing EV battery coatings demand, increasing investment in lubricants & adhesives, and increasing application of specialty chemicals.

Country CAGR (2025 to 2035)
South Korea 6.2%

Competitive Outlook

The 2-EH market remains competitive, with regional production concentrated in countries housing integrated petrochemical complexes, including China, Germany, South Korea, and the United States. Supply chain security and fluctuations in raw material pricing are shaping procurement strategies, prompting producers to increasingly focus on backward integration and strategic partnerships.

These efforts aim to ensure a steady supply of key feedstock chemicals like propylene and butyraldehyde. The market outlook for 2-EH remains positive, driven by its versatility and essential role in high-growth downstream industries, positioning it as a critical component in various sectors.
  • On September 14, 2023, Perstorp launched a fully renewable-based 2-ethylhexanol (2-EH Pro 100), marking a significant advancement in sustainable oxo alcohol production. Derived entirely from renewable raw materials via mass balance, the product is ISCC PLUS certified and aimed at applications in plasticizers, lubricants, and surfactants. The launch aligns with Perstorp’s strategy to reduce carbon emissions across the chemical value chain.
  • On August 7, 2024, BASF Taiwan announced an increase in regional 2-ethylhexanol supply reliability through enhanced logistics and service capability in the Asia-Pacific region. The move aims to support customers in the plasticizer and coatings industries by improving lead times and security of supply. The update reflects BASF’s commitment to strengthening its presence in downstream oxo alcohol markets.

2 Ethylhexanol Market Analysis By Company

Companies

  • The Dow Chemical Company
  • Eastman Chemical Company
  • Perstorp
  • OXEA GmbH
  • BASF SE
  • SABIC
  • INEOS Oxide
  • Mitsubishi Chemical Corporation

2-EH Market Segmentation

By Application:

  • Plasticizers
  • Acrylates & Methacrylates
  • Lubricants & Fuel additives
  • Solvents
  • 2-EH Nitrate
  • Others

By End Use:

  • Chemicals
  • Coatings
  • Plastics & Polymers
  • Others(adhesives)

By Region:

  • North America
  • Latin America
  • Eastern Europe
  • Western Europe
  • East Asia
  • South Asia & Pacific
  • Middle East & Africa

Table of Content

  1. Executive Summary
  2. Industry Introduction, including Taxonomy and Market Definition
  3. Market Trends and Success Factors, including Macro-economic Factors, Market Dynamics, and Recent Industry Developments
  4. Global Market Demand Analysis 2020 to 2024 and Forecast 2025 to 2035, including Historical Analysis and Future Projections
  5. Global Market Analysis 2020 to 2024 and Forecast 2025 to 2035
    • Type
    • Application
  6. Global Market Analysis 2020 to 2024 and Forecast 2025 to 2035, By Type
    • Sapphire
    • Ruby
    • Emery
  7. Global Market Analysis 2020 to 2024 and Forecast 2025 to 2035, By Application
    • Plasticizers
    • Non-phthalate
    • Phthalate
    • nitrate
    • acrylate
    • Others
  8. Global Market Analysis 2020 to 2024 and Forecast 2025 to 2035, By Region
    • North America
    • Latin America
    • Western Europe
    • Eastern Europe
    • East Asia
    • South Asia Pacific
    • Middle East and Africa
  9. North America Sales Analysis 2020 to 2024 and Forecast 2025 to 2035, by Key Segments and Countries
  10. Latin America Sales Analysis 2020 to 2024 and Forecast 2025 to 2035, by Key Segments and Countries
  11. Western Europe Sales Analysis 2020 to 2024 and Forecast 2025 to 2035, by Key Segments and Countries
  12. Eastern Europe Sales Analysis 2020 to 2024 and Forecast 2025 to 2035, by Key Segments and Countries
  13. East Asia Sales Analysis 2020 to 2024 and Forecast 2025 to 2035, by Key Segments and Countries
  14. South Asia Pacific Sales Analysis 2020 to 2024 and Forecast 2025 to 2035, by Key Segments and Countries
  15. Middle East and Africa Sales Analysis 2020 to 2024 and Forecast 2025 to 2035, by Key Segments and Countries
  16. Sales Forecast 2025 to 2035 by Type and Application for 30 Countries
  17. Competition Outlook, including Market Structure Analysis, Company Share Analysis by Key Players, and Competition Dashboard
  18. Company Profile
    • The Dow Chemical Company
    • Eastman Chemical Company
    • Azotowe KATMdzierzyn
    • INEOS Holdings Limited
    • SABIC
    • Formosa Plastic Group
    • Tianjin Zhongxin Chemtec Co., Ltd.
    • Elekeriroz S.A.
    • Mitsubishi Chemical
    • Zak S.A.

List of Tables

  • Table 1: Global Market Value (USD Million) Forecast by Region, 2020 to 2035
  • Table 2: Global Market Volume (Tons) Forecast by Region, 2020 to 2035
  • Table 3: Global Market Value (USD Million) Forecast by Type, 2020 to 2035
  • Table 4: Global Market Volume (Tons) Forecast by Type, 2020 to 2035
  • Table 5: Global Market Value (USD Million) Forecast by Application, 2020 to 2035
  • Table 6: Global Market Volume (Tons) Forecast by Application, 2020 to 2035
  • Table 7: North America Market Value (USD Million) Forecast by Country, 2020 to 2035
  • Table 8: North America Market Volume (Tons) Forecast by Country, 2020 to 2035
  • Table 9: North America Market Value (USD Million) Forecast by Type, 2020 to 2035
  • Table 10: North America Market Volume (Tons) Forecast by Type, 2020 to 2035
  • Table 11: North America Market Value (USD Million) Forecast by Application, 2020 to 2035
  • Table 12: North America Market Volume (Tons) Forecast by Application, 2020 to 2035
  • Table 13: Latin America Market Value (USD Million) Forecast by Country, 2020 to 2035
  • Table 14: Latin America Market Volume (Tons) Forecast by Country, 2020 to 2035
  • Table 15: Latin America Market Value (USD Million) Forecast by Type, 2020 to 2035
  • Table 16: Latin America Market Volume (Tons) Forecast by Type, 2020 to 2035
  • Table 17: Latin America Market Value (USD Million) Forecast by Application, 2020 to 2035
  • Table 18: Latin America Market Volume (Tons) Forecast by Application, 2020 to 2035
  • Table 19: Western Europe Market Value (USD Million) Forecast by Country, 2020 to 2035
  • Table 20: Western Europe Market Volume (Tons) Forecast by Country, 2020 to 2035
  • Table 21: Western Europe Market Value (USD Million) Forecast by Type, 2020 to 2035
  • Table 22: Western Europe Market Volume (Tons) Forecast by Type, 2020 to 2035
  • Table 23: Western Europe Market Value (USD Million) Forecast by Application, 2020 to 2035
  • Table 24: Western Europe Market Volume (Tons) Forecast by Application, 2020 to 2035
  • Table 25: Eastern Europe Market Value (USD Million) Forecast by Country, 2020 to 2035
  • Table 26: Eastern Europe Market Volume (Tons) Forecast by Country, 2020 to 2035
  • Table 27: Eastern Europe Market Value (USD Million) Forecast by Type, 2020 to 2035
  • Table 28: Eastern Europe Market Volume (Tons) Forecast by Type, 2020 to 2035
  • Table 29: Eastern Europe Market Value (USD Million) Forecast by Application, 2020 to 2035
  • Table 30: Eastern Europe Market Volume (Tons) Forecast by Application, 2020 to 2035
  • Table 31: South Asia and Pacific Market Value (USD Million) Forecast by Country, 2020 to 2035
  • Table 32: South Asia and Pacific Market Volume (Tons) Forecast by Country, 2020 to 2035
  • Table 33: South Asia and Pacific Market Value (USD Million) Forecast by Type, 2020 to 2035
  • Table 34: South Asia and Pacific Market Volume (Tons) Forecast by Type, 2020 to 2035
  • Table 35: South Asia and Pacific Market Value (USD Million) Forecast by Application, 2020 to 2035
  • Table 36: South Asia and Pacific Market Volume (Tons) Forecast by Application, 2020 to 2035
  • Table 37: East Asia Market Value (USD Million) Forecast by Country, 2020 to 2035
  • Table 38: East Asia Market Volume (Tons) Forecast by Country, 2020 to 2035
  • Table 39: East Asia Market Value (USD Million) Forecast by Type, 2020 to 2035
  • Table 40: East Asia Market Volume (Tons) Forecast by Type, 2020 to 2035
  • Table 41: East Asia Market Value (USD Million) Forecast by Application, 2020 to 2035
  • Table 42: East Asia Market Volume (Tons) Forecast by Application, 2020 to 2035
  • Table 43: Middle East and Africa Market Value (USD Million) Forecast by Country, 2020 to 2035
  • Table 44: Middle East and Africa Market Volume (Tons) Forecast by Country, 2020 to 2035
  • Table 45: Middle East and Africa Market Value (USD Million) Forecast by Type, 2020 to 2035
  • Table 46: Middle East and Africa Market Volume (Tons) Forecast by Type, 2020 to 2035
  • Table 47: Middle East and Africa Market Value (USD Million) Forecast by Application, 2020 to 2035
  • Table 48: Middle East and Africa Market Volume (Tons) Forecast by Application, 2020 to 2035

List of Figures

  • Figure 1: Global Market Value (USD Million) by Type, 2025 to 2035
  • Figure 2: Global Market Value (USD Million) by Application, 2025 to 2035
  • Figure 3: Global Market Value (USD Million) by Region, 2025 to 2035
  • Figure 4: Global Market Value (USD Million) Analysis by Region, 2020 to 2035
  • Figure 5: Global Market Volume (Tons) Analysis by Region, 2020 to 2035
  • Figure 6: Global Market Value Share (%) and BPS Analysis by Region, 2025 to 2035
  • Figure 7: Global Market Y-o-Y Growth (%) Projections by Region, 2025 to 2035
  • Figure 8: Global Market Value (USD Million) Analysis by Type, 2020 to 2035
  • Figure 9: Global Market Volume (Tons) Analysis by Type, 2020 to 2035
  • Figure 10: Global Market Value Share (%) and BPS Analysis by Type, 2025 to 2035
  • Figure 11: Global Market Y-o-Y Growth (%) Projections by Type, 2025 to 2035
  • Figure 12: Global Market Value (USD Million) Analysis by Application, 2020 to 2035
  • Figure 13: Global Market Volume (Tons) Analysis by Application, 2020 to 2035
  • Figure 14: Global Market Value Share (%) and BPS Analysis by Application, 2025 to 2035
  • Figure 15: Global Market Y-o-Y Growth (%) Projections by Application, 2025 to 2035
  • Figure 16: Global Market Attractiveness by Type, 2025 to 2035
  • Figure 17: Global Market Attractiveness by Application, 2025 to 2035
  • Figure 18: Global Market Attractiveness by Region, 2025 to 2035
  • Figure 19: North America Market Value (USD Million) by Type, 2025 to 2035
  • Figure 20: North America Market Value (USD Million) by Application, 2025 to 2035
  • Figure 21: North America Market Value (USD Million) by Country, 2025 to 2035
  • Figure 22: North America Market Value (USD Million) Analysis by Country, 2020 to 2035
  • Figure 23: North America Market Volume (Tons) Analysis by Country, 2020 to 2035
  • Figure 24: North America Market Value Share (%) and BPS Analysis by Country, 2025 to 2035
  • Figure 25: North America Market Y-o-Y Growth (%) Projections by Country, 2025 to 2035
  • Figure 26: North America Market Value (USD Million) Analysis by Type, 2020 to 2035
  • Figure 27: North America Market Volume (Tons) Analysis by Type, 2020 to 2035
  • Figure 28: North America Market Value Share (%) and BPS Analysis by Type, 2025 to 2035
  • Figure 29: North America Market Y-o-Y Growth (%) Projections by Type, 2025 to 2035
  • Figure 30: North America Market Value (USD Million) Analysis by Application, 2020 to 2035
  • Figure 31: North America Market Volume (Tons) Analysis by Application, 2020 to 2035
  • Figure 32: North America Market Value Share (%) and BPS Analysis by Application, 2025 to 2035
  • Figure 33: North America Market Y-o-Y Growth (%) Projections by Application, 2025 to 2035
  • Figure 34: North America Market Attractiveness by Type, 2025 to 2035
  • Figure 35: North America Market Attractiveness by Application, 2025 to 2035
  • Figure 36: North America Market Attractiveness by Country, 2025 to 2035
  • Figure 37: Latin America Market Value (USD Million) by Type, 2025 to 2035
  • Figure 38: Latin America Market Value (USD Million) by Application, 2025 to 2035
  • Figure 39: Latin America Market Value (USD Million) by Country, 2025 to 2035
  • Figure 40: Latin America Market Value (USD Million) Analysis by Country, 2020 to 2035
  • Figure 41: Latin America Market Volume (Tons) Analysis by Country, 2020 to 2035
  • Figure 42: Latin America Market Value Share (%) and BPS Analysis by Country, 2025 to 2035
  • Figure 43: Latin America Market Y-o-Y Growth (%) Projections by Country, 2025 to 2035
  • Figure 44: Latin America Market Value (USD Million) Analysis by Type, 2020 to 2035
  • Figure 45: Latin America Market Volume (Tons) Analysis by Type, 2020 to 2035
  • Figure 46: Latin America Market Value Share (%) and BPS Analysis by Type, 2025 to 2035
  • Figure 47: Latin America Market Y-o-Y Growth (%) Projections by Type, 2025 to 2035
  • Figure 48: Latin America Market Value (USD Million) Analysis by Application, 2020 to 2035
  • Figure 49: Latin America Market Volume (Tons) Analysis by Application, 2020 to 2035
  • Figure 50: Latin America Market Value Share (%) and BPS Analysis by Application, 2025 to 2035
  • Figure 51: Latin America Market Y-o-Y Growth (%) Projections by Application, 2025 to 2035
  • Figure 52: Latin America Market Attractiveness by Type, 2025 to 2035
  • Figure 53: Latin America Market Attractiveness by Application, 2025 to 2035
  • Figure 54: Latin America Market Attractiveness by Country, 2025 to 2035
  • Figure 55: Western Europe Market Value (USD Million) by Type, 2025 to 2035
  • Figure 56: Western Europe Market Value (USD Million) by Application, 2025 to 2035
  • Figure 57: Western Europe Market Value (USD Million) by Country, 2025 to 2035
  • Figure 58: Western Europe Market Value (USD Million) Analysis by Country, 2020 to 2035
  • Figure 59: Western Europe Market Volume (Tons) Analysis by Country, 2020 to 2035
  • Figure 60: Western Europe Market Value Share (%) and BPS Analysis by Country, 2025 to 2035
  • Figure 61: Western Europe Market Y-o-Y Growth (%) Projections by Country, 2025 to 2035
  • Figure 62: Western Europe Market Value (USD Million) Analysis by Type, 2020 to 2035
  • Figure 63: Western Europe Market Volume (Tons) Analysis by Type, 2020 to 2035
  • Figure 64: Western Europe Market Value Share (%) and BPS Analysis by Type, 2025 to 2035
  • Figure 65: Western Europe Market Y-o-Y Growth (%) Projections by Type, 2025 to 2035
  • Figure 66: Western Europe Market Value (USD Million) Analysis by Application, 2020 to 2035
  • Figure 67: Western Europe Market Volume (Tons) Analysis by Application, 2020 to 2035
  • Figure 68: Western Europe Market Value Share (%) and BPS Analysis by Application, 2025 to 2035
  • Figure 69: Western Europe Market Y-o-Y Growth (%) Projections by Application, 2025 to 2035
  • Figure 70: Western Europe Market Attractiveness by Type, 2025 to 2035
  • Figure 71: Western Europe Market Attractiveness by Application, 2025 to 2035
  • Figure 72: Western Europe Market Attractiveness by Country, 2025 to 2035
  • Figure 73: Eastern Europe Market Value (USD Million) by Type, 2025 to 2035
  • Figure 74: Eastern Europe Market Value (USD Million) by Application, 2025 to 2035
  • Figure 75: Eastern Europe Market Value (USD Million) by Country, 2025 to 2035
  • Figure 76: Eastern Europe Market Value (USD Million) Analysis by Country, 2020 to 2035
  • Figure 77: Eastern Europe Market Volume (Tons) Analysis by Country, 2020 to 2035
  • Figure 78: Eastern Europe Market Value Share (%) and BPS Analysis by Country, 2025 to 2035
  • Figure 79: Eastern Europe Market Y-o-Y Growth (%) Projections by Country, 2025 to 2035
  • Figure 80: Eastern Europe Market Value (USD Million) Analysis by Type, 2020 to 2035
  • Figure 81: Eastern Europe Market Volume (Tons) Analysis by Type, 2020 to 2035
  • Figure 82: Eastern Europe Market Value Share (%) and BPS Analysis by Type, 2025 to 2035
  • Figure 83: Eastern Europe Market Y-o-Y Growth (%) Projections by Type, 2025 to 2035
  • Figure 84: Eastern Europe Market Value (USD Million) Analysis by Application, 2020 to 2035
  • Figure 85: Eastern Europe Market Volume (Tons) Analysis by Application, 2020 to 2035
  • Figure 86: Eastern Europe Market Value Share (%) and BPS Analysis by Application, 2025 to 2035
  • Figure 87: Eastern Europe Market Y-o-Y Growth (%) Projections by Application, 2025 to 2035
  • Figure 88: Eastern Europe Market Attractiveness by Type, 2025 to 2035
  • Figure 89: Eastern Europe Market Attractiveness by Application, 2025 to 2035
  • Figure 90: Eastern Europe Market Attractiveness by Country, 2025 to 2035
  • Figure 91: South Asia and Pacific Market Value (USD Million) by Type, 2025 to 2035
  • Figure 92: South Asia and Pacific Market Value (USD Million) by Application, 2025 to 2035
  • Figure 93: South Asia and Pacific Market Value (USD Million) by Country, 2025 to 2035
  • Figure 94: South Asia and Pacific Market Value (USD Million) Analysis by Country, 2020 to 2035
  • Figure 95: South Asia and Pacific Market Volume (Tons) Analysis by Country, 2020 to 2035
  • Figure 96: South Asia and Pacific Market Value Share (%) and BPS Analysis by Country, 2025 to 2035
  • Figure 97: South Asia and Pacific Market Y-o-Y Growth (%) Projections by Country, 2025 to 2035
  • Figure 98: South Asia and Pacific Market Value (USD Million) Analysis by Type, 2020 to 2035
  • Figure 99: South Asia and Pacific Market Volume (Tons) Analysis by Type, 2020 to 2035
  • Figure 100: South Asia and Pacific Market Value Share (%) and BPS Analysis by Type, 2025 to 2035
  • Figure 101: South Asia and Pacific Market Y-o-Y Growth (%) Projections by Type, 2025 to 2035
  • Figure 102: South Asia and Pacific Market Value (USD Million) Analysis by Application, 2020 to 2035
  • Figure 103: South Asia and Pacific Market Volume (Tons) Analysis by Application, 2020 to 2035
  • Figure 104: South Asia and Pacific Market Value Share (%) and BPS Analysis by Application, 2025 to 2035
  • Figure 105: South Asia and Pacific Market Y-o-Y Growth (%) Projections by Application, 2025 to 2035
  • Figure 106: South Asia and Pacific Market Attractiveness by Type, 2025 to 2035
  • Figure 107: South Asia and Pacific Market Attractiveness by Application, 2025 to 2035
  • Figure 108: South Asia and Pacific Market Attractiveness by Country, 2025 to 2035
  • Figure 109: East Asia Market Value (USD Million) by Type, 2025 to 2035
  • Figure 110: East Asia Market Value (USD Million) by Application, 2025 to 2035
  • Figure 111: East Asia Market Value (USD Million) by Country, 2025 to 2035
  • Figure 112: East Asia Market Value (USD Million) Analysis by Country, 2020 to 2035
  • Figure 113: East Asia Market Volume (Tons) Analysis by Country, 2020 to 2035
  • Figure 114: East Asia Market Value Share (%) and BPS Analysis by Country, 2025 to 2035
  • Figure 115: East Asia Market Y-o-Y Growth (%) Projections by Country, 2025 to 2035
  • Figure 116: East Asia Market Value (USD Million) Analysis by Type, 2020 to 2035
  • Figure 117: East Asia Market Volume (Tons) Analysis by Type, 2020 to 2035
  • Figure 118: East Asia Market Value Share (%) and BPS Analysis by Type, 2025 to 2035
  • Figure 119: East Asia Market Y-o-Y Growth (%) Projections by Type, 2025 to 2035
  • Figure 120: East Asia Market Value (USD Million) Analysis by Application, 2020 to 2035
  • Figure 121: East Asia Market Volume (Tons) Analysis by Application, 2020 to 2035
  • Figure 122: East Asia Market Value Share (%) and BPS Analysis by Application, 2025 to 2035
  • Figure 123: East Asia Market Y-o-Y Growth (%) Projections by Application, 2025 to 2035
  • Figure 124: East Asia Market Attractiveness by Type, 2025 to 2035
  • Figure 125: East Asia Market Attractiveness by Application, 2025 to 2035
  • Figure 126: East Asia Market Attractiveness by Country, 2025 to 2035
  • Figure 127: Middle East and Africa Market Value (USD Million) by Type, 2025 to 2035
  • Figure 128: Middle East and Africa Market Value (USD Million) by Application, 2025 to 2035
  • Figure 129: Middle East and Africa Market Value (USD Million) by Country, 2025 to 2035
  • Figure 130: Middle East and Africa Market Value (USD Million) Analysis by Country, 2020 to 2035
  • Figure 131: Middle East and Africa Market Volume (Tons) Analysis by Country, 2020 to 2035
  • Figure 132: Middle East and Africa Market Value Share (%) and BPS Analysis by Country, 2025 to 2035
  • Figure 133: Middle East and Africa Market Y-o-Y Growth (%) Projections by Country, 2025 to 2035
  • Figure 134: Middle East and Africa Market Value (USD Million) Analysis by Type, 2020 to 2035
  • Figure 135: Middle East and Africa Market Volume (Tons) Analysis by Type, 2020 to 2035
  • Figure 136: Middle East and Africa Market Value Share (%) and BPS Analysis by Type, 2025 to 2035
  • Figure 137: Middle East and Africa Market Y-o-Y Growth (%) Projections by Type, 2025 to 2035
  • Figure 138: Middle East and Africa Market Value (USD Million) Analysis by Application, 2020 to 2035
  • Figure 139: Middle East and Africa Market Volume (Tons) Analysis by Application, 2020 to 2035
  • Figure 140: Middle East and Africa Market Value Share (%) and BPS Analysis by Application, 2025 to 2035
  • Figure 141: Middle East and Africa Market Y-o-Y Growth (%) Projections by Application, 2025 to 2035
  • Figure 142: Middle East and Africa Market Attractiveness by Type, 2025 to 2035
  • Figure 143: Middle East and Africa Market Attractiveness by Application, 2025 to 2035
  • Figure 144: Middle East and Africa Market Attractiveness by Country, 2025 to 2035

Frequently Asked Questions

What was the overall size of the 2-EH Market in 2025?

The overall market size for 2-EH Market was USD 6.5 Billion in 2025.

How big the Bio is based 2-EH Market expected in 2035?

The 2-EH Market is expected to reach USD 13.9 Billion in 2035.

What will drive the demand for 2-EH Market during the forecast period?

The demand for the 2-Ethylhexanol (2-EH) market will be driven by its increasing use in plasticizers, coatings, and lubricants, especially in the construction and automotive industries. Growing demand for flexible PVC, industrial solvents, and rising infrastructure projects will further propel market growth.

List the top 5 countries contributing in 2-EH Market?

The top 5 countries which drives the development of 2-EH Market are USA, UK, Europe Union, Japan and South Korea.

Which segment in type is expected to lead in 2-EH Market?

Phthalate and 2-EH Acrylate Drive Market to command significant share over the assessment period.

Future Market Insights

2-ethylhexanol (2-EH) Market