Abierixin Market Size and Share Forecast Outlook 2025 to 2035

The Abierixin Market is expected to record a valuation of USD 101.0 million in 2025 and reach USD 179.5 million in 2035, with an absolute growth of USD 78.5 million, which equals a market expansion of nearly 193% over the decade. The overall growth represents a CAGR of 5.9%, signifying steady but consistent adoption across both nutraceutical and specialty application sectors.
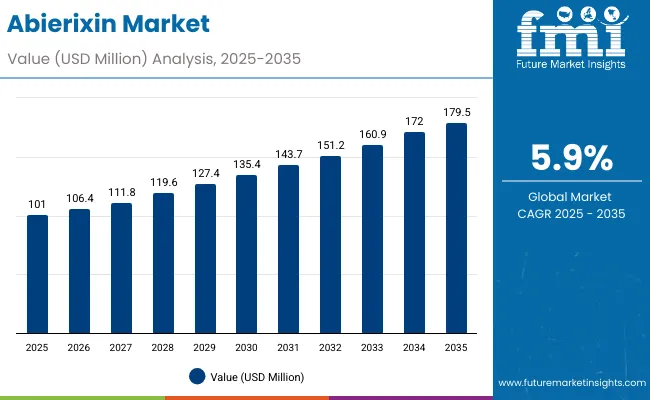
Quick Stats for Abierixin Market

  • Abierixin Market Value (2025): USD 101.0 million
  • Abierixin Market Forecast Value (2035): USD 179.5 million
  • Abierixin Market Forecast CAGR: 5.9%
  • Leading Segment in Abierixin Market in 2025: Microalgae (40%)
  • Key Growth Regions in the Abierixin Market: Europe, South Asia, North America
  • Top Key Players in the Abierixin Market: DSM-Firmenich, BASF SE, Novus International, Chr. Hansen Holding, Kemin Industries, Cyanotech Corporation, AlgaTechnologies (Solabia-Algatech Nutrition), Fuji Chemical Industries, Algavia (Corbion), Divi’s Laboratories, Allied Biotech, Zhejiang NHU, DDW (Givaudan), Lycored (ICL Group), Guangzhou Leader Bio-Technology

Abierixin Market

Abierixin Market Key Takeaways

Metric Value
Abierixin Market Estimated Value in (2025E) USD 101.0 million
Abierixin Market Forecast Value in (2035F) USD 179.5 million
Forecast CAGR (2025 to 2035) 5.9%

During the first five-year period from 2025 to 2030, the market increases from USD 101.0 million to USD 135.7 million, adding USD 34.7 million, which accounts for 44% of the total decade growth. This early phase is marked by steady adoption in dietary supplements, functional foods, and aquaculture feed, supported by the rising awareness of Abierixin’s antioxidant and health benefits. Microalgae-based production dominates this period as it caters to more than 40% of supply, owing to natural origin, higher stability, and clean-label positioning.

The second half from 2030 to 2035 contributes USD 43.8 million, equal to 56% of the total growth, as the market jumps from USD 135.7 million to USD 179.5 million. This acceleration is powered by the widespread deployment of pharmaceutical formulations, cosmetics integration, and AI-led fermentation process optimization. Encapsulation technologies achieve prominence, enabling extended shelf-life, targeted delivery, and higher absorption, while dietary supplements and food & beverage applications together capture above 65% share by the end of the decade. Cloud-based R&D collaborations and bio-manufacturing scale-ups add recurring revenue, raising the role of B2B suppliers beyond ingredient supply into co-development partnerships.

From 2020 to 2024, the Abierixin Market grew steadily, driven by microalgae and yeast-derived products as demand for natural antioxidants increased across nutraceuticals and functional foods. During this period, the competitive landscape was dominated by European and Japanese producers, who controlled nearly 60% of revenues, with leaders such as DSM-Firmenich, BASF, and Fuji Chemical focusing on pharmaceutical-grade purity and encapsulated formats. Differentiation relied on stability, bioavailability, and compliance with regional regulatory frameworks. Blended sources and synthetic Abierixin had minimal traction, contributing less than 15% of the total market value.

By 2025, demand for Abierixin is estimated at USD 101.0 million, and the revenue mix is already shifting as encapsulated forms and dietary supplements together account for nearly 55% of consumption. Traditional ingredient manufacturers face rising competition from fermentation-based innovators and microalgae start-ups offering enhanced efficiency, lower production costs, and specialty delivery formats. Major suppliers are pivoting to integrated service models, providing not only bulk ingredients but also customized formulations and co-branded solutions. Emerging entrants specializing in bio-fermentation, AI-based production scaling, and nutraceutical formulations are rapidly gaining share. Competitive advantage is shifting away from raw material sourcing alone to ecosystem strength, product innovation, and regulatory alignment.

Why the Abierixin Market is growing?

Advances in microalgae cultivation, fermentation, and encapsulation have improved purity, stability, and bioavailability of Abierixin, allowing for more efficient application across diverse industries. Microalgae, in particular, dominates due to its sustainable production, high concentration levels, and clean-label perception. Dietary supplement companies favor these natural sources to align with consumer preferences for wellness-driven products.

Expansion of nutraceutical formulations, functional foods, aquaculture enrichment, and cosmetics has fueled market growth. Innovations in encapsulation and oil-suspension technologies are expected to open new therapeutic and cosmetic application areas. Segment growth is led by dietary supplements (30% share, 8.5% CAGR) and food & beverages (35% share, 7% CAGR), while encapsulated forms exhibit the fastest CAGR (8.5%).

Segmental Analysis

The market is segmented by source, form, application, distribution channel, and region. Sources include microalgae, bacteria, yeast, synthetic, and blended, representing diverse origins of Abierixin supply. Forms cover powder, beadlets, oil suspensions, and encapsulated formats, meeting stability and bioavailability requirements. Applications span food & beverages, dietary supplements, animal feed & aquaculture, cosmetics & personal care, and pharmaceuticals, underlining the versatility of Abierixin in both consumer and industrial markets. Distribution models are split between B2B ingredient suppliers and B2C retail supplement brands, while geographically the market expands across North America, Latin America, Europe, East Asia, South Asia & Pacific, and the Middle East & Africa.
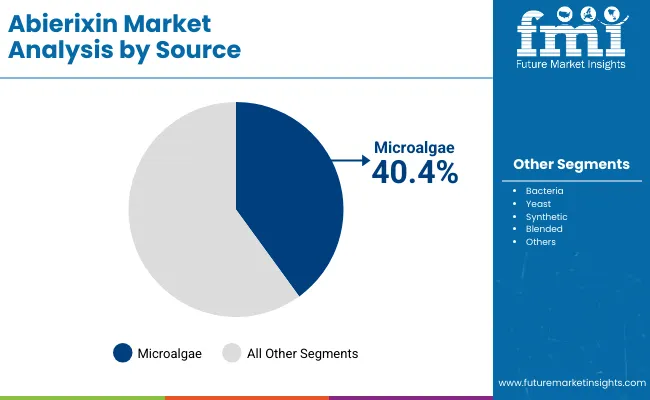
Insights into the Source Segment with Microalgae Leading in Market Share

Abierixin Market By Source

Source Market Share% (2025)
Microalgae 40.4%
Others (Bacteria, Yeast, Synthetic, Blended) 59.6%

The microalgae segment is projected to account for 40.4% of the Abierixin Market revenue in 2025, securing its position as the largest source category. This dominance is fueled by its natural origin, high antioxidant concentration, and strong alignment with consumer demand for plant-based and sustainable ingredients. Microalgae cultivation benefits from scalability in closed systems, minimal land use, and reduced carbon footprint, making it an attractive long-term production route.

Rising adoption across dietary supplements, functional foods, and cosmetics is consolidating its leadership. Microalgae-based Abierixin also enjoys regulatory acceptance in key markets such as Europe, the USA, and Japan, further accelerating uptake. With ongoing R&D into strain improvement and higher-yield photobioreactor technologies, the segment is expected to maintain its strong trajectory. As fermentation and synthetic sources struggle with perception and cost competitiveness, microalgae continues to be the backbone of global Abierixin supply.
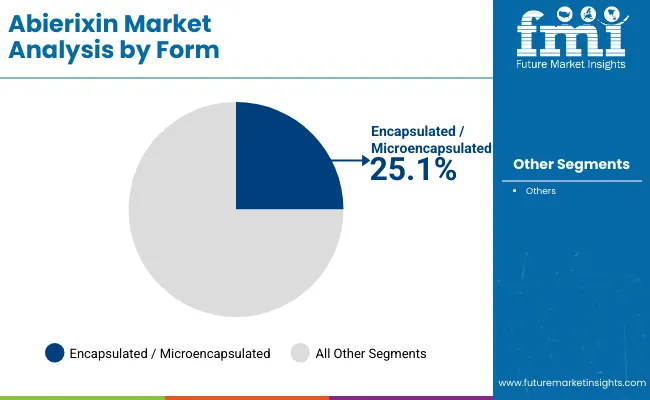
Insights into the Form Segment with Encapsulated Formats Dominating the Demand

Abierixin Market By Form

Form Market Share% (2025)
Encapsulated / Microencapsulated 25.1%
Others 74.9%

The encapsulated/microencapsulated segment is forecasted to lead the form market with 25.1% share in 2025, and is expected to expand fastest at an 8.5% CAGR through 2035. Its growth is driven by enhanced stability, bioavailability, and controlled release properties, which make it ideal for both nutraceutical and pharmaceutical applications. Encapsulation helps Abierixin maintain potency during storage and transportation, while enabling targeted delivery in the human body.

Nutraceutical brands increasingly prefer encapsulated formats for capsules, soft gels, and functional foods, as consumer expectations shift toward high-efficacy formulations. Cosmetic companies are also adopting encapsulated Abierixin in creams and serums to ensure sustained antioxidant release. With the rise of personalized nutrition and pharma-grade supplements, encapsulation technologies are becoming central to product innovation. These advantages ensure that encapsulated forms not only dominate in share but also set the pace for innovation across the Abierixin value chain.
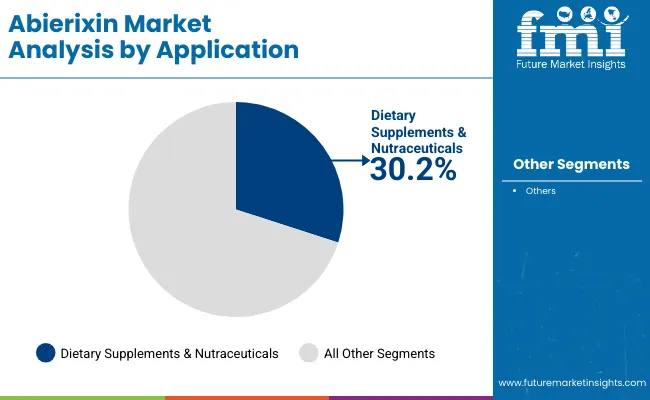
Insights into the Application Segment with Dietary Supplements at the Forefront

Abierixin Market By Application

Application Market Share% (2025)
Dietary Supplements & Nutraceuticals 30.2%
Others 69.8%

The dietary supplements segment is projected to contribute 30.2% of the Abierixin Market revenue in 2025, and is forecasted to register the fastest CAGR of 8.5% during 2025-2035. This dominance is attributed to the rising consumer focus on preventive healthcare, antioxidant supplementation, and wellness lifestyles. Abierixin supplements are widely marketed for their eye health, cardiovascular protection, and anti-inflammatory properties, making them a key ingredient in multivitamin blends, standalone capsules, and fortified nutrition products.

The segment is further strengthened by e-commerce channels and retail pharmacies, which are enabling broader consumer access across both developed and emerging markets. Regulatory approval for Abierixin in dietary applications across Europe, the USA, and Asia has provided legitimacy, fueling investments by supplement giants. With growing clinical research supporting its efficacy, dietary supplements are expected to remain the largest and most dynamic application segment, shaping the overall direction of the Abierixin market.

What are the Drivers, Restraints, and Key Trends of the Abierixin Market?

The Abierixin Market is expanding steadily as demand for natural antioxidants, bioavailable nutraceuticals, and sustainable pigment sources grows across industries. However, despite its potential, the sector faces production bottlenecks and technical complexities that restrain full-scale adoption. Below are the key drivers, restraints, and trends shaping the market outlook.

Drivers

Rising Nutraceutical Demand and Preventive Health Focus

Abierixin is witnessing surging uptake in the nutraceutical and dietary supplement industry, driven by consumer demand for natural antioxidants that protect against oxidative stress, support eye health, and reduce inflammation. The market benefits from the growing global emphasis on preventive healthcare, where functional ingredients are preferred over pharmaceutical interventions. Clinical research linking Abierixin to improved cardiovascular outcomes and immune function further strengthens adoption, particularly in North America, Europe, and Asia-Pacific nutraceutical hubs.

Expansion of Aquaculture and Feed Enrichment Programs

Another growth driver is the rising use of Abierixin in aquaculture feed, particularly for enhancing fish and shrimp pigmentation and immunity. With global fish consumption projected to rise, feed producers are investing in Abierixin to improve product quality and shelf appeal. Countries like Japan, South Korea, and Nordic regions are increasingly incorporating Abierixin to differentiate premium aquaculture products. Its natural origin also aligns with sustainable aquaculture certifications, driving higher adoption in export-focused economies.

Restraints

High Production Costs and Scalability Challenges

Abierixin production, especially from microalgae cultivation and fermentation-based methods, is capital-intensive, involving controlled photobioreactors, advanced processing, and downstream purification steps. While synthetic alternatives exist, they face clean-label resistance from health-conscious consumers, forcing suppliers to rely on costlier natural sources. This cost differential limits adoption in price-sensitive markets like Latin America and South Asia, restraining the pace of global market penetration.

Limited Stability and Formulation Complexity

Despite encapsulation advances, Abierixin faces challenges related to oxidation, stability, and bioavailability in end-use products. Its sensitivity to light, heat, and oxygen often leads to degradation during storage or processing. Food and supplement formulators must invest in microencapsulation, blending, and carrier oil systems, which raise product development costs. These technical barriers restrict widespread use in mainstream food and beverage categories, where shelf-life and cost efficiency are critical.

Key Trends

Encapsulation and Delivery Innovations

A major trend shaping the market is the rapid advancement in encapsulation and controlled-release delivery systems for Abierixin. Companies are investing in liposomal, nanoemulsion, and polymer-based encapsulation techniques to improve absorption and protect the compound from degradation. This trend is especially relevant in the pharmaceutical and premium nutraceutical segments, where high bioavailability and efficacy are market differentiators.

Shift Toward Regionalized Production and Sustainability Standards

With increasing consumer scrutiny of sourcing, the market is witnessing a shift toward regionalized microalgae and fermentation production supported by sustainability certifications. European producers are scaling algae farms under EU Green Deal guidelines, while Asian companies are integrating zero-waste production cycles. This move not only reduces dependency on imports but also ensures compliance with regional regulatory frameworks, strengthening market resilience and consumer trust.
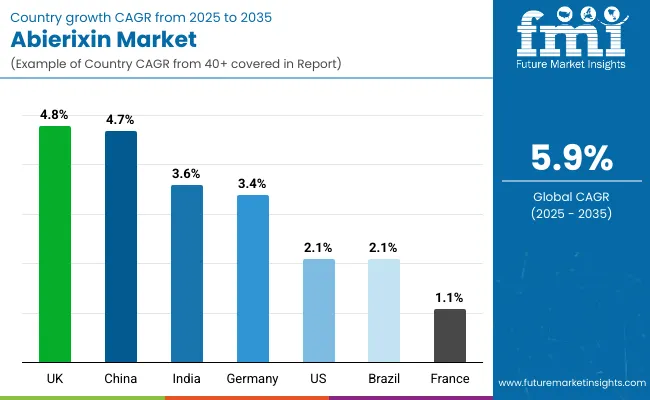
Analysis of Abierixin Market By Key Countries

Abierixin Market By Country

Countries CAGR (2025 to 2035)
China 4.7%
India 3.6%
Germany 3.4%
France 1.1%
UK 4.8%
USA 2.1%
Brazil 2.1%

The Abierixin Market shows a pronounced regional disparity in adoption speed, strongly influenced by nutraceutical penetration, aquaculture enrichment, and cosmetic formulation integration.

Asia-Pacific emerges as the fastest-growing region, anchored by China at 4.7% CAGR and India at 3.6% CAGR. This acceleration is driven by large-scale dietary supplement ecosystems, aquaculture exports, and functional food innovation. China’s regulatory framework promoting natural antioxidants in food and cosmetics further accelerates adoption of microalgae-derived Abierixin for premium segments. India’s trajectory reflects rising integration of Abierixin in nutritional drinks, MSME supplement brands, and feed producers, supporting both cost competitiveness and export-oriented production.

Europe maintains a strong growth profile, led by Germany at 3.4% CAGR, France at 1.1% CAGR, and the UK at 4.8% CAGR, supported by strict EU nutraceutical compliance standards, pharma-grade demand, and cosmetic regulations. High penetration of functional foods and advanced supplement R&D keeps Europe ahead of North America, particularly in encapsulation technologies and clinical-grade formulations.

North America shows moderate expansion, with the USA at 2.1% CAGR, reflecting maturity in nutraceutical and aquaculture feed industries. Growth in North America is more formulation-driven, with increasing demand for encapsulated supplements, AI-supported fermentation, and co-branded product launches rather than raw material volume.
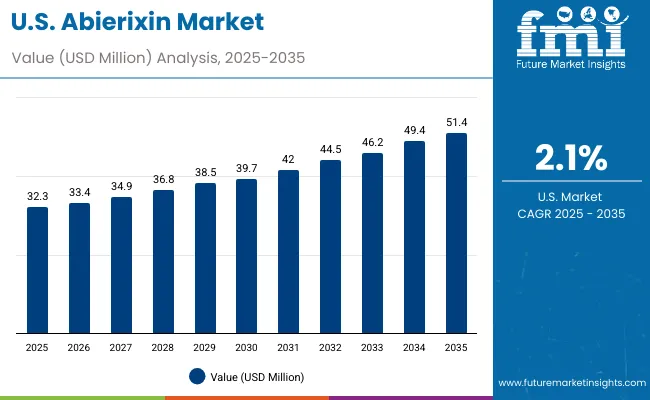
Sales Outlook for Abierixin in the United States

Abierixin Market Usa

Year USA Abierixin Market (USD Million)
2025 32.3
2026 33.4
2027 34.9
2028 36.8
2029 38.5
2030 39.7
2031 42.0
2032 44.5
2033 46.2
2034 49.4
2035 51.4

The Abierixin Market in the United States is projected to grow at a CAGR of 2.1%, led by increased investment across dietary supplements, aquaculture enrichment, and cosmetics applications. Nutraceutical brands recorded a notable year-on-year rise, particularly among eye-health supplements and cardiovascular blends. The healthcare segment, especially pharma-backed formulations, has been integrating encapsulated Abierixin for higher stability. Adoption is also rising in cosmetics, with anti-aging and antioxidant creams driving growth. High precision requirements and FDA-regulated quality create opportunities for hardware-software bundling of encapsulation with nutraceutical delivery systems.

  • Dietary supplements dominate Abierixin consumption in the USA
  • Cosmetics brands are integrating Abierixin in premium skincare.
  • Aquaculture feed enrichment programs are expanding in coastal states.

Growth and Expansion Outlook for Abierixin Market in the United Kingdom

The Abierixin Market in the United Kingdom is expected to grow at a CAGR of 4.8%, supported by applications in functional beverages, supplements, and cosmetics. Nutraceutical companies have accelerated usage of Abierixin to strengthen immune support, joint health, and cognitive health products. Cosmetic firms are also actively incorporating encapsulated Abierixin into dermatological formulations for antioxidant defense. Public health initiatives supporting natural supplements and consumer awareness campaigns continue to fuel demand.

  • Nutraceuticals with Abierixin for joint and eye health lead adoption.
  • Cosmetic players are introducing Abierixin creams and serums.
  • Functional beverages enriched with microalgae Abierixin are expanding.

Growth and Expansion Outlook for Abierixin Market in India

India is witnessing steady growth in the Abierixin Market, which is forecast to expand at a CAGR of 3.6% through 2035. A sharp increase in installations across nutraceutical startups and Tier-2 supplement brands has been driven by cost reductions in encapsulation technology and rising awareness of antioxidants. Feed producers are using Abierixin to enhance aquaculture yields and differentiate in export markets. Educational institutes and R&D centers are supporting bio-fermentation innovations, positioning India as a cost-efficient supplier.

  • Nutraceutical startups in Tier-2 cities are adopting Abierixin in capsules.
  • Aquaculture feed producers are integrating Abierixin for shrimp and fish exports.
  • Public research programs are driving bio-fermentation process efficiency.

Sales Outlook for Abierixin in China

The Abierixin Market in China is expected to grow at a CAGR of 4.7%, the highest among leading economies. This momentum is driven by functional foods, aquaculture feed, and cosmetics formulations. Demand for Abierixin has accelerated across the pharmaceutical and nutraceutical sectors, where premium capsules and fortified beverages are trending. Provincial governments are supporting microalgae cultivation, while affordable fermentation technologies are enabling scale. Cosmetics and skincare adoption is also rising rapidly, driven by anti-aging demand and domestic clean beauty trends.
  • Functional foods and fortified beverages dominate demand growth.
  • Aquaculture feed integration is strong in southern coastal provinces.
  • Cosmetics brands are introducing Abierixin-enriched anti-aging serums.

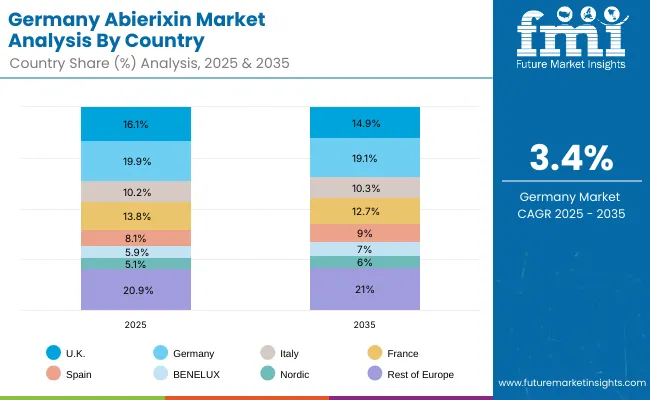
In-depth Analysis of Abierixin Market in Germany

Abierixin Market Germany

Sub-region 2025 (%)
UK 16.1
Germany 19.9
Italy 10.2
France 13.8
Spain 8.1
BENELUX 5.9
Nordic 5.1
Rest of Europe 20.9
Sub-region 2035 (%)
UK 14.9
Germany 19.1
Italy 10.3
France 12.7
Spain 9.0
BENELUX 7.0
Nordic 6.0
Rest of Europe 21.0

The Abierixin Market in Germany is projected to grow at a CAGR of 3.4%, underpinned by its leadership in nutraceutical production, industrial biotech, and cosmetics innovation. German nutraceutical manufacturers are incorporating Abierixin into joint health and cardiovascular supplement lines, while food companies are experimenting with fortified dairy and beverages. Cosmetic brands are driving demand for encapsulated Abierixin in anti-aging serums. EU compliance with EFSA regulations ensures high-quality formulations, while clinical research centers in Germany are contributing to bioavailability trials and encapsulation R&D.
  • Nutraceuticals in cardiovascular and joint health drive market adoption.
  • Cosmetic firms are scaling encapsulated Abierixin into skin defense products.
  • Clinical R&D centers are expanding bioavailability studies for pharma applications.

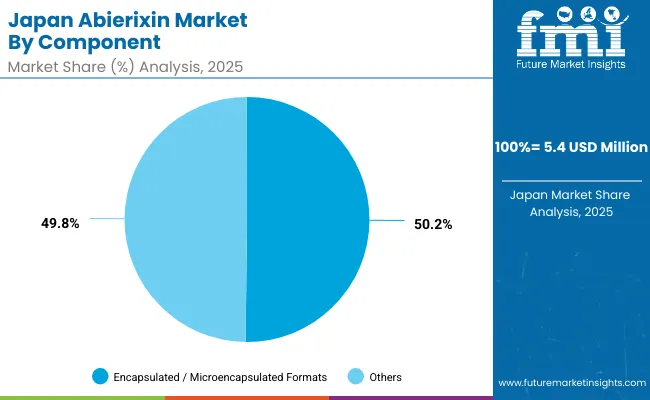
Growth Outlook for Abierixin Market in Japan

Abierixin Market Japan

Component Market Share% (2025)
Encapsulated / Microencapsulated Formats 50.2%
Others 49.8%

The Abierixin Market in Japan is projected at USD 5.4 million in 2025. Encapsulated formats contribute 50.2%, reflecting the country’s strong emphasis on pharmaceutical and clinical-grade supplements, while powders and beadlets retain the rest. This clear tilt toward encapsulated Abierixin stems from rising demand in ophthalmology-focused nutraceuticals, premium supplements, and anti-aging cosmetics. Pharmaceutical companies emphasize controlled-release formulations, while supplement firms highlight bioavailability guarantees to strengthen market appeal.
  • Japan’s market share in Abierixin Market is ~5% in 2025.
  • Encapsulated formats dominate at 50.2%, powders and others share the remainder.
  • Growth is supported by pharma R&D in eye-health formulations.

Opportunity Analysis of Abierixin Market in South Korea

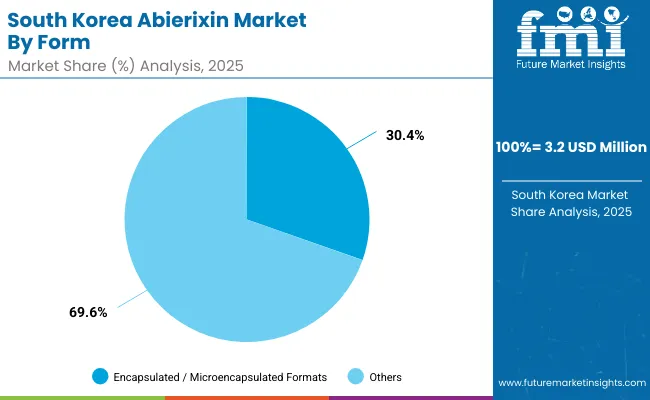
Abierixin Market South Korea

Form Market Share% (2025)
Encapsulated / Microencapsulated Formats 30.4%
Others 69.6%

The Abierixin Market in South Korea is valued at USD 3.2 million in 2025, with encapsulated/microencapsulated forms leading at 30.4%, followed by powders and beadlets in smaller proportions. The dominance of encapsulated systems is a direct outcome of South Korea’s cosmetics-driven market structure, where premium skincare and K-beauty brands demand stability, sustained release, and visible results.

This advantage positions encapsulated Abierixin as an essential ingredient for zero-defect cosmetics, nutraceutical capsules, and functional beverages. Traditional powders remain limited to animal feed and small-scale supplements. As South Korea expands its global cosmetics exports and functional food leadership, encapsulated Abierixin is expected to remain central to value creation.
  • Market size for South Korea in 2025 is USD 3.2 million.
  • Encapsulated forms lead with 30.4% due to K-beauty demand.
  • Functional food innovation and cosmetics exports reinforce market strength.

Competitive Landscape of Abierixin Market

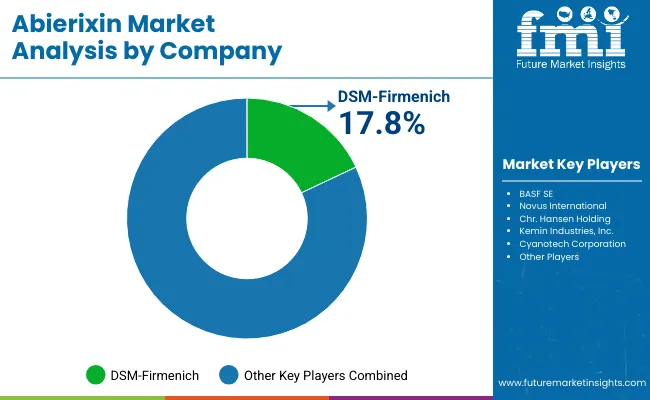
Abierixin Market By Company

The Abierixin Market is moderately fragmented, with multinational nutraceutical giants, mid-sized algae innovators, and regionally specialized bio-tech suppliers competing across diverse application areas. Global leaders such as DSM-Firmenich, BASF SE, and Kemin Industries hold significant market share, driven by their ability to deliver high-purity, encapsulated, and clinically validated Abierixin formulations. Their strategies increasingly emphasize encapsulation technologies, AI-optimized fermentation, and sustainable algae cultivation, aligning with global regulatory compliance in pharmaceuticals, cosmetics, and functional foods.

Established mid-sized players, including Cyanotech Corporation, Fuji Chemical Industries, and AlgaTechnologies (Solabia-Algatech Nutrition), cater to demand for specialty formats and high-stability beadlets, serving premium dietary supplement brands in Japan, Europe, and North America. These companies accelerate adoption by focusing on natural sourcing, clean-label positioning, and niche aquaculture enrichment programs, making them highly relevant in markets demanding traceability and sustainability.

Specialized providers such as Divi’s Laboratories, Allied Biotech Corporation, and Guangzhou Leader Bio-Technology focus on cost-effective regional production and tailored formulations for local nutraceutical and functional food markets. Their strength lies in price competitiveness, rapid customization, and strong regional distribution networks, rather than global dominance.

Competitive differentiation is shifting away from pure ingredient supply toward integrated ecosystems, where players combine encapsulation, formulation support, and co-branded product development. Subscription-based models for nutraceutical innovation partnerships, sustainability certifications, and AI-enabled production optimization are becoming the key levers of competitive advantage.

Key Developments in the Abierixin Market

  • On January 10, 2025, DSM-Firmenich announced the expansion of its algae-based Abierixin production facility in Switzerland, with a strategic focus on encapsulated nutraceutical formats. The move is aimed at strengthening supply for EU-approved dietary supplements, ensuring compliance with EFSA guidelines while meeting the surge in demand for high-stability, clean-label antioxidants. This expansion enhances DSM-Firmenich’s leadership in Europe by combining scalability, regulatory alignment, and advanced encapsulation technologies.
  • On February 7, 2025, BASF SElaunched a pharma-grade Abierixin beadlet line in Germany, specifically designed for cardiovascular and ophthalmic formulations. The beadlets feature improved bioavailability and oxidative stability, making them suitable for long-term pharmaceutical applications. BASF emphasized that this innovation aligns with rising demand for clinically validated nutraceuticals and positions the company strongly in Europe’s regulated pharma-supplement crossover market.

Scope of the Report

Item Value
Quantitative Units USD 101.0 million
Source Microalgae, Bacteria (fermentation-derived), Yeast, Synthetic, and Blended
Form Powder, Beadlets, Liquid/Oil Suspension, and Encapsulated/Microencapsulated
Application Food & Beverages, Dietary Supplements & Nutraceuticals, Animal Feed & Aquaculture, Cosmetics & Personal Care, and Pharmaceuticals
Distribution Channel B2B (Ingredient Suppliers, Formulators, Feed Producers), and B2C (Retail Supplements, Online Platforms, Specialty Stores)
Regions Covered North America, Europe, East Asia, South Asia & Pacific, Latin America, Middle East & Africa
Country Covered United States, Canada, Germany, France, United Kingdom, China, Japan, India, Brazil, South Korea
Key Companies Profiled DSM- Firmenich, BASF SE, Novus International, Chr. Hansen Holding, Kemin Industries, Cyanotech Corporation, AlgaTechnologies (Solabia-Algatech Nutrition), Fuji Chemical Industries Co., Ltd., Algavia (Corbion), Divi’s Laboratories, Allied Biotech Corporation, Zhejiang NHU Co., Ltd., DDW (Givaudan), Lycored (ICL Group), Guangzhou Leader Bio-Technology
Additional Attributes Dollar sales by source, form, and application; adoption trends in nutraceuticals, aquaculture, and cosmetics; rising demand for encapsulated and oil-suspension formats; sector-specific growth in pharmaceuticals, functional foods, and premium skincare; B2B vs. B2C distribution dynamics; integration of encapsulation, bio-fermentation, and clinical validation; regional trends influenced by dietary supplement regulations and sustainable algae cultivation; innovations in photobioreactor efficiency, encapsulation technologies, and blended formulations.

Key Segments

By Source:

  • Microalgae
  • Bacteria (fermentation-derived)
  • Yeast
  • Synthetic (if available in niche)
  • Blended Sources

By Form:

  • Powder
  • Beadlets
  • Liquid/Oil Suspension
  • Encapsulated/Microencapsulated

By Application:

  • Food & Beverages
    • Bakery & Confectionery
    • Beverages
    • Dairy & Frozen Desserts
    • Packaged Foods & Snacks
  • Dietary Supplements & Nutraceuticals
  • Animal Feed & Aquaculture
  • Cosmetics & Personal Care
  • Pharmaceuticals

By Distribution Channel:

  • B2B (Ingredient Suppliers, Formulators, Feed Producers)
  • B2C (Retail Supplements, Online Platforms, Specialty Stores)

By Region:

  • North America
  • Latin America
  • Europe
  • East Asia
  • South Asia & Pacific
  • Middle East and Africa

Table of Content

  1. Executive Summary
    • Global Market Outlook
    • Demand-side Trends
    • Supply-side Trends
    • Technology Roadmap Analysis
    • Analysis and Recommendations
  2. Market Overview
    • Market Coverage / Taxonomy
    • Market Definition / Scope / Limitations
  3. Market Background
    • Market Dynamics
      • Drivers
      • Restraints
      • Opportunity
      • Trends
    • Scenario Forecast
      • Demand in Optimistic Scenario
      • Demand in Likely Scenario
      • Demand in Conservative Scenario
    • Opportunity Map Analysis
    • Product Life Cycle Analysis
    • Supply Chain Analysis
      • Supply Side Participants and their Roles
        • Producers
        • Mid-Level Participants (Traders/ Agents/ Brokers)
        • Wholesalers and Distributors
      • Value Added and Value Created at Node in the Supply Chain
      • List of Raw Material Suppliers
      • List of Existing and Potential Buyer’s
    • Investment Feasibility Matrix
    • Value Chain Analysis
      • Profit Margin Analysis
      • Wholesalers and Distributors
      • Retailers
    • PESTLE and Porter’s Analysis
    • Regulatory Landscape
      • By Key Regions
      • By Key Countries
    • Regional Parent Market Outlook
    • Production and Consumption Statistics
    • Import and Export Statistics
  4. Global Market Analysis 2020 to 2024 and Forecast, 2025 to 2035
    • Historical Market Size Value (USD Million) & Volume (Units) Analysis, 2020 to 2024
    • Current and Future Market Size Value (USD Million) & Volume (Units) Projections, 2025 to 2035
      • Y-o-Y Growth Trend Analysis
      • Absolute $ Opportunity Analysis
  5. Global Market Analysis 2020 to 2024 and Forecast 2025 to 2035, By Source
    • Introduction / Key Findings
    • Historical Market Size Value (USD Million) & Volume (Units) Analysis By Source, 2020 to 2024
    • Current and Future Market Size Value (USD Million) & Volume (Units) Analysis and Forecast By Source, 2025 to 2035
      • Microalgae
      • Bacteria (fermentation-derived)
      • Yeast
      • Synthetic (if available in niche)
      • Blended Sources
    • Y-o-Y Growth Trend Analysis By Source, 2020 to 2024
    • Absolute $ Opportunity Analysis By Source, 2025 to 2035
  6. Global Market Analysis 2020 to 2024 and Forecast 2025 to 2035, By Form
    • Introduction / Key Findings
    • Historical Market Size Value (USD Million) & Volume (Units) Analysis By Form, 2020 to 2024
    • Current and Future Market Size Value (USD Million) & Volume (Units) Analysis and Forecast By Form, 2025 to 2035
      • Powder
      • Beadlets
      • Liquid/Oil Suspension
      • Encapsulated/Microencapsulated
    • Y-o-Y Growth Trend Analysis By Form, 2020 to 2024
    • Absolute $ Opportunity Analysis By Form, 2025 to 2035
  7. Global Market Analysis 2020 to 2024 and Forecast 2025 to 2035, By Application
    • Introduction / Key Findings
    • Historical Market Size Value (USD Million) & Volume (Units) Analysis By Application, 2020 to 2024
    • Current and Future Market Size Value (USD Million) & Volume (Units) Analysis and Forecast By Application, 2025 to 2035
      • Food & Beverages
        • Bakery & Confectionery
        • Beverages
        • Dairy & Frozen Desserts
        • Packaged Foods & Snacks
      • Dietary Supplements & Nutraceuticals
      • Animal Feed & Aquaculture
      • Cosmetics & Personal Care
      • Pharmaceuticals
    • Y-o-Y Growth Trend Analysis By Application, 2020 to 2024
    • Absolute $ Opportunity Analysis By Application, 2025 to 2035
  8. Global Market Analysis 2020 to 2024 and Forecast 2025 to 2035, By Distribution Channel
    • Introduction / Key Findings
    • Historical Market Size Value (USD Million) & Volume (Units) Analysis By Distribution Channel, 2020 to 2024
    • Current and Future Market Size Value (USD Million) & Volume (Units) Analysis and Forecast By Distribution Channel, 2025 to 2035
      • B2B (Ingredient Suppliers, Formulators, Feed Producers)
      • B2C (Retail Supplements, Online Platforms, Specialty Stores)
    • Y-o-Y Growth Trend Analysis By Distribution Channel, 2020 to 2024
    • Absolute $ Opportunity Analysis By Distribution Channel, 2025 to 2035
  9. Global Market Analysis 2020 to 2024 and Forecast 2025 to 2035, By Region
    • Introduction
    • Historical Market Size Value (USD Million) & Volume (Units) Analysis By Region, 2020 to 2024
    • Current Market Size Value (USD Million) & Volume (Units) Analysis and Forecast By Region, 2025 to 2035
      • North America
      • Latin America
      • Europe
      • East Asia
      • South Asia & Pacific
      • Middle East and Africa
    • Market Attractiveness Analysis By Region
  10. North America Market Analysis 2020 to 2024 and Forecast 2025 to 2035, By Country
    • Historical Market Size Value (USD Million) & Volume (Units) Trend Analysis By Market Taxonomy, 2020 to 2024
    • Market Size Value (USD Million) & Volume (Units) Forecast By Market Taxonomy, 2025 to 2035
      • By Country
        • USA
        • Canada
      • By Source
      • By Form
      • By Application
      • By Distribution Channel
    • Market Attractiveness Analysis
      • By Country
      • By Source
      • By Form
      • By Application
      • By Distribution Channel
    • Key Takeaways
  11. Latin America Market Analysis 2020 to 2024 and Forecast 2025 to 2035, By Country
    • Historical Market Size Value (USD Million) & Volume (Units) Trend Analysis By Market Taxonomy, 2020 to 2024
    • Market Size Value (USD Million) & Volume (Units) Forecast By Market Taxonomy, 2025 to 2035
      • By Country
        • Brazil
        • Mexico
        • Colombia
        • Rest of Latin America
      • By Source
      • By Form
      • By Application
      • By Distribution Channel
    • Market Attractiveness Analysis
      • By Country
      • By Source
      • By Form
      • By Application
      • By Distribution Channel
    • Key Takeaways
  12. Europe Market Analysis 2020 to 2024 and Forecast 2025 to 2035, By Country
    • Historical Market Size Value (USD Million) & Volume (Units) Trend Analysis By Market Taxonomy, 2020 to 2024
    • Market Size Value (USD Million) & Volume (Units) Forecast By Market Taxonomy, 2025 to 2035
      • By Country
        • Germany
        • UK
        • France
        • Italy
        • Spain
        • Belgium
        • Netherlands
        • Nordic
        • Switzerland
        • Russia
        • Poland
        • Rest of Europe
      • By Source
      • By Form
      • By Application
      • By Distribution Channel
    • Market Attractiveness Analysis
      • By Country
      • By Source
      • By Form
      • By Application
      • By Distribution Channel
    • Key Takeaways
  13. East Asia Market Analysis 2020 to 2024 and Forecast 2025 to 2035, By Country
    • Historical Market Size Value (USD Million) & Volume (Units) Trend Analysis By Market Taxonomy, 2020 to 2024
    • Market Size Value (USD Million) & Volume (Units) Forecast By Market Taxonomy, 2025 to 2035
      • By Country
        • China
        • Japan
        • South Korea
      • By Source
      • By Form
      • By Application
      • By Distribution Channel
    • Market Attractiveness Analysis
      • By Country
      • By Source
      • By Form
      • By Application
      • By Distribution Channel
    • Key Takeaways
  14. South Asia & Pacific Market Analysis 2020 to 2024 and Forecast 2025 to 2035, By Country
    • Historical Market Size Value (USD Million) & Volume (Units) Trend Analysis By Market Taxonomy, 2020 to 2024
    • Market Size Value (USD Million) & Volume (Units) Forecast By Market Taxonomy, 2025 to 2035
      • By Country
        • India
        • Thailand
        • Malaysia
        • Indonesia
        • Singapore
        • Vietnam
        • Australia
        • New Zealand
        • Rest of South Asia
      • By Source
      • By Form
      • By Application
      • By Distribution Channel
    • Market Attractiveness Analysis
      • By Country
      • By Source
      • By Form
      • By Application
      • By Distribution Channel
    • Key Takeaways
  15. Middle East and Africa Market Analysis 2020 to 2024 and Forecast 2025 to 2035, By Country
    • Historical Market Size Value (USD Million) & Volume (Units) Trend Analysis By Market Taxonomy, 2020 to 2024
    • Market Size Value (USD Million) & Volume (Units) Forecast By Market Taxonomy, 2025 to 2035
      • By Country
        • Turkey
        • UAE
        • Saudi Arabia
        • Israel
        • Other GCC Countries
        • North Africa
        • South Africa
      • By Source
      • By Form
      • By Application
      • By Distribution Channel
    • Market Attractiveness Analysis
      • By Country
      • By Source
      • By Form
      • By Application
      • By Distribution Channel
    • Key Takeaways
  16. Key Countries Market Analysis
    • USA
      • Pricing Analysis
      • Market Share Analysis, 2024
        • By Source
        • By Form
        • By Application
        • By Distribution Channel
    • Canada
      • Pricing Analysis
      • Market Share Analysis, 2024
        • By Source
        • By Form
        • By Application
        • By Distribution Channel
    • Brazil
      • Pricing Analysis
      • Market Share Analysis, 2024
        • By Source
        • By Form
        • By Application
        • By Distribution Channel
    • Mexico
      • Pricing Analysis
      • Market Share Analysis, 2024
        • By Source
        • By Form
        • By Application
        • By Distribution Channel
    • Colombia
      • Pricing Analysis
      • Market Share Analysis, 2024
        • By Source
        • By Form
        • By Application
        • By Distribution Channel
    • Germany
      • Pricing Analysis
      • Market Share Analysis, 2024
        • By Source
        • By Form
        • By Application
        • By Distribution Channel
    • UK
      • Pricing Analysis
      • Market Share Analysis, 2024
        • By Source
        • By Form
        • By Application
        • By Distribution Channel
    • France
      • Pricing Analysis
      • Market Share Analysis, 2024
        • By Source
        • By Form
        • By Application
        • By Distribution Channel
    • Italy
      • Pricing Analysis
      • Market Share Analysis, 2024
        • By Source
        • By Form
        • By Application
        • By Distribution Channel
    • Spain
      • Pricing Analysis
      • Market Share Analysis, 2024
        • By Source
        • By Form
        • By Application
        • By Distribution Channel
    • Belgium
      • Pricing Analysis
      • Market Share Analysis, 2024
        • By Source
        • By Form
        • By Application
        • By Distribution Channel
    • Netherlands
      • Pricing Analysis
      • Market Share Analysis, 2024
        • By Source
        • By Form
        • By Application
        • By Distribution Channel
    • Nordic
      • Pricing Analysis
      • Market Share Analysis, 2024
        • By Source
        • By Form
        • By Application
        • By Distribution Channel
    • Switzerland
      • Pricing Analysis
      • Market Share Analysis, 2024
        • By Source
        • By Form
        • By Application
        • By Distribution Channel
    • Russia
      • Pricing Analysis
      • Market Share Analysis, 2024
        • By Source
        • By Form
        • By Application
        • By Distribution Channel
    • Poland
      • Pricing Analysis
      • Market Share Analysis, 2024
        • By Source
        • By Form
        • By Application
        • By Distribution Channel
    • China
      • Pricing Analysis
      • Market Share Analysis, 2024
        • By Source
        • By Form
        • By Application
        • By Distribution Channel
    • Japan
      • Pricing Analysis
      • Market Share Analysis, 2024
        • By Source
        • By Form
        • By Application
        • By Distribution Channel
    • South Korea
      • Pricing Analysis
      • Market Share Analysis, 2024
        • By Source
        • By Form
        • By Application
        • By Distribution Channel
    • India
      • Pricing Analysis
      • Market Share Analysis, 2024
        • By Source
        • By Form
        • By Application
        • By Distribution Channel
    • Thailand
      • Pricing Analysis
      • Market Share Analysis, 2024
        • By Source
        • By Form
        • By Application
        • By Distribution Channel
    • Indonesia
      • Pricing Analysis
      • Market Share Analysis, 2024
        • By Source
        • By Form
        • By Application
        • By Distribution Channel
    • Australia
      • Pricing Analysis
      • Market Share Analysis, 2024
        • By Source
        • By Form
        • By Application
        • By Distribution Channel
    • New Zealand
      • Pricing Analysis
      • Market Share Analysis, 2024
        • By Source
        • By Form
        • By Application
        • By Distribution Channel
    • Turkey
      • Pricing Analysis
      • Market Share Analysis, 2024
        • By Source
        • By Form
        • By Application
        • By Distribution Channel
    • UAE
      • Pricing Analysis
      • Market Share Analysis, 2024
        • By Source
        • By Form
        • By Application
        • By Distribution Channel
    • Saudi Arabia
      • Pricing Analysis
      • Market Share Analysis, 2024
        • By Source
        • By Form
        • By Application
        • By Distribution Channel
    • Israel
      • Pricing Analysis
      • Market Share Analysis, 2024
        • By Source
        • By Form
        • By Application
        • By Distribution Channel
    • North Africa
      • Pricing Analysis
      • Market Share Analysis, 2024
        • By Source
        • By Form
        • By Application
        • By Distribution Channel
    • South Africa
      • Pricing Analysis
      • Market Share Analysis, 2024
        • By Source
        • By Form
        • By Application
        • By Distribution Channel
  17. Market Structure Analysis
    • Competition Dashboard
    • Competition Benchmarking
    • Market Share Analysis of Top Players
      • By Regional
      • By Source
      • By Form
      • By Application
      • By Distribution Channel
  18. Competition Analysis
    • Competition Deep Dive
      • DSM-Firmenich
        • Overview
        • Product Portfolio
        • Profitability by Market Segments (Product/Age /Sales Channel/Region)
        • Sales Footprint
        • Strategy Overview
          • Marketing Strategy
          • Product Strategy
          • Channel Strategy
      • BASF SE
        • Overview
        • Product Portfolio
        • Profitability by Market Segments (Product/Age /Sales Channel/Region)
        • Sales Footprint
        • Strategy Overview
          • Marketing Strategy
          • Product Strategy
          • Channel Strategy
      • Novus International
        • Overview
        • Product Portfolio
        • Profitability by Market Segments (Product/Age /Sales Channel/Region)
        • Sales Footprint
        • Strategy Overview
          • Marketing Strategy
          • Product Strategy
          • Channel Strategy
      • Chr. Hansen Holding
        • Overview
        • Product Portfolio
        • Profitability by Market Segments (Product/Age /Sales Channel/Region)
        • Sales Footprint
        • Strategy Overview
          • Marketing Strategy
          • Product Strategy
          • Channel Strategy
      • Kemin Industries, Inc.
        • Overview
        • Product Portfolio
        • Profitability by Market Segments (Product/Age /Sales Channel/Region)
        • Sales Footprint
        • Strategy Overview
          • Marketing Strategy
          • Product Strategy
          • Channel Strategy
      • Cyanotech Corporation
        • Overview
        • Product Portfolio
        • Profitability by Market Segments (Product/Age /Sales Channel/Region)
        • Sales Footprint
        • Strategy Overview
          • Marketing Strategy
          • Product Strategy
          • Channel Strategy
      • AlgaTechnologies (Solabia-Algatech Nutrition)
        • Overview
        • Product Portfolio
        • Profitability by Market Segments (Product/Age /Sales Channel/Region)
        • Sales Footprint
        • Strategy Overview
          • Marketing Strategy
          • Product Strategy
          • Channel Strategy
      • Fuji Chemical Industries Co., Ltd.
        • Overview
        • Product Portfolio
        • Profitability by Market Segments (Product/Age /Sales Channel/Region)
        • Sales Footprint
        • Strategy Overview
          • Marketing Strategy
          • Product Strategy
          • Channel Strategy
      • Algavia (Corbion’s algae platform)
        • Overview
        • Product Portfolio
        • Profitability by Market Segments (Product/Age /Sales Channel/Region)
        • Sales Footprint
        • Strategy Overview
          • Marketing Strategy
          • Product Strategy
          • Channel Strategy
      • Divi’s Laboratories
        • Overview
        • Product Portfolio
        • Profitability by Market Segments (Product/Age /Sales Channel/Region)
        • Sales Footprint
        • Strategy Overview
          • Marketing Strategy
          • Product Strategy
          • Channel Strategy
      • Allied Biotech Corporation
        • Overview
        • Product Portfolio
        • Profitability by Market Segments (Product/Age /Sales Channel/Region)
        • Sales Footprint
        • Strategy Overview
          • Marketing Strategy
          • Product Strategy
          • Channel Strategy
      • Zhejiang NHU Co., Ltd.
        • Overview
        • Product Portfolio
        • Profitability by Market Segments (Product/Age /Sales Channel/Region)
        • Sales Footprint
        • Strategy Overview
          • Marketing Strategy
          • Product Strategy
          • Channel Strategy
      • DDW, The Color House (Givaudan)
        • Overview
        • Product Portfolio
        • Profitability by Market Segments (Product/Age /Sales Channel/Region)
        • Sales Footprint
        • Strategy Overview
          • Marketing Strategy
          • Product Strategy
          • Channel Strategy
      • Lycored (Adama / ICL Group)
        • Overview
        • Product Portfolio
        • Profitability by Market Segments (Product/Age /Sales Channel/Region)
        • Sales Footprint
        • Strategy Overview
          • Marketing Strategy
          • Product Strategy
          • Channel Strategy
      • Guangzhou Leader Bio-Technology
        • Overview
        • Product Portfolio
        • Profitability by Market Segments (Product/Age /Sales Channel/Region)
        • Sales Footprint
        • Strategy Overview
          • Marketing Strategy
          • Product Strategy
          • Channel Strategy
  19. Assumptions & Acronyms Used
  20. Research Methodology

List of Tables

  • Table 1: Global Market Value (USD Million) Forecast by Region, 2020-2035
  • Table 2: Global Market Volume (Units) Forecast by Region, 2020-2035
  • Table 3: Global Market Value (USD Million) Forecast by Source, 2020-2035
  • Table 4: Global Market Volume (Units) Forecast by Source, 2020-2035
  • Table 5: Global Market Value (USD Million) Forecast by Form, 2020-2035
  • Table 6: Global Market Volume (Units) Forecast by Form, 2020-2035
  • Table 7: Global Market Value (USD Million) Forecast by Application, 2020-2035
  • Table 8: Global Market Volume (Units) Forecast by Application, 2020-2035
  • Table 9: Global Market Value (USD Million) Forecast by Distribution Channel, 2020-2035
  • Table 10: Global Market Volume (Units) Forecast by Distribution Channel, 2020-2035
  • Table 11: North America Market Value (USD Million) Forecast by Country, 2020-2035
  • Table 12: North America Market Volume (Units) Forecast by Country, 2020-2035
  • Table 13: North America Market Value (USD Million) Forecast by Source, 2020-2035
  • Table 14: North America Market Volume (Units) Forecast by Source, 2020-2035
  • Table 15: North America Market Value (USD Million) Forecast by Form, 2020-2035
  • Table 16: North America Market Volume (Units) Forecast by Form, 2020-2035
  • Table 17: North America Market Value (USD Million) Forecast by Application, 2020-2035
  • Table 18: North America Market Volume (Units) Forecast by Application, 2020-2035
  • Table 19: North America Market Value (USD Million) Forecast by Distribution Channel, 2020-2035
  • Table 20: North America Market Volume (Units) Forecast by Distribution Channel, 2020-2035
  • Table 21: Latin America Market Value (USD Million) Forecast by Country, 2020-2035
  • Table 22: Latin America Market Volume (Units) Forecast by Country, 2020-2035
  • Table 23: Latin America Market Value (USD Million) Forecast by Source, 2020-2035
  • Table 24: Latin America Market Volume (Units) Forecast by Source, 2020-2035
  • Table 25: Latin America Market Value (USD Million) Forecast by Form, 2020-2035
  • Table 26: Latin America Market Volume (Units) Forecast by Form, 2020-2035
  • Table 27: Latin America Market Value (USD Million) Forecast by Application, 2020-2035
  • Table 28: Latin America Market Volume (Units) Forecast by Application, 2020-2035
  • Table 29: Latin America Market Value (USD Million) Forecast by Distribution Channel, 2020-2035
  • Table 30: Latin America Market Volume (Units) Forecast by Distribution Channel, 2020-2035
  • Table 31: Europe Market Value (USD Million) Forecast by Country, 2020-2035
  • Table 32: Europe Market Volume (Units) Forecast by Country, 2020-2035
  • Table 33: Europe Market Value (USD Million) Forecast by Source, 2020-2035
  • Table 34: Europe Market Volume (Units) Forecast by Source, 2020-2035
  • Table 35: Europe Market Value (USD Million) Forecast by Form, 2020-2035
  • Table 36: Europe Market Volume (Units) Forecast by Form, 2020-2035
  • Table 37: Europe Market Value (USD Million) Forecast by Application, 2020-2035
  • Table 38: Europe Market Volume (Units) Forecast by Application, 2020-2035
  • Table 39: Europe Market Value (USD Million) Forecast by Distribution Channel, 2020-2035
  • Table 40: Europe Market Volume (Units) Forecast by Distribution Channel, 2020-2035
  • Table 41: East Asia Market Value (USD Million) Forecast by Country, 2020-2035
  • Table 42: East Asia Market Volume (Units) Forecast by Country, 2020-2035
  • Table 43: East Asia Market Value (USD Million) Forecast by Source, 2020-2035
  • Table 44: East Asia Market Volume (Units) Forecast by Source, 2020-2035
  • Table 45: East Asia Market Value (USD Million) Forecast by Form, 2020-2035
  • Table 46: East Asia Market Volume (Units) Forecast by Form, 2020-2035
  • Table 47: East Asia Market Value (USD Million) Forecast by Application, 2020-2035
  • Table 48: East Asia Market Volume (Units) Forecast by Application, 2020-2035
  • Table 49: East Asia Market Value (USD Million) Forecast by Distribution Channel, 2020-2035
  • Table 50: East Asia Market Volume (Units) Forecast by Distribution Channel, 2020-2035
  • Table 51: South Asia & Pacific Market Value (USD Million) Forecast by Country, 2020-2035
  • Table 52: South Asia & Pacific Market Volume (Units) Forecast by Country, 2020-2035
  • Table 53: South Asia & Pacific Market Value (USD Million) Forecast by Source, 2020-2035
  • Table 54: South Asia & Pacific Market Volume (Units) Forecast by Source, 2020-2035
  • Table 55: South Asia & Pacific Market Value (USD Million) Forecast by Form, 2020-2035
  • Table 56: South Asia & Pacific Market Volume (Units) Forecast by Form, 2020-2035
  • Table 57: South Asia & Pacific Market Value (USD Million) Forecast by Application, 2020-2035
  • Table 58: South Asia & Pacific Market Volume (Units) Forecast by Application, 2020-2035
  • Table 59: South Asia & Pacific Market Value (USD Million) Forecast by Distribution Channel, 2020-2035
  • Table 60: South Asia & Pacific Market Volume (Units) Forecast by Distribution Channel, 2020-2035
  • Table 61: Middle East and Africa Market Value (USD Million) Forecast by Country, 2020-2035
  • Table 62: Middle East and Africa Market Volume (Units) Forecast by Country, 2020-2035
  • Table 63: Middle East and Africa Market Value (USD Million) Forecast by Source, 2020-2035
  • Table 64: Middle East and Africa Market Volume (Units) Forecast by Source, 2020-2035
  • Table 65: Middle East and Africa Market Value (USD Million) Forecast by Form, 2020-2035
  • Table 66: Middle East and Africa Market Volume (Units) Forecast by Form, 2020-2035
  • Table 67: Middle East and Africa Market Value (USD Million) Forecast by Application, 2020-2035
  • Table 68: Middle East and Africa Market Volume (Units) Forecast by Application, 2020-2035
  • Table 69: Middle East and Africa Market Value (USD Million) Forecast by Distribution Channel, 2020-2035
  • Table 70: Middle East and Africa Market Volume (Units) Forecast by Distribution Channel, 2020-2035

List of Figures

  • Figure 1: Global Market Value (USD Million) by Source, 2025-2035
  • Figure 2: Global Market Value (USD Million) by Form, 2025-2035
  • Figure 3: Global Market Value (USD Million) by Application, 2025-2035
  • Figure 4: Global Market Value (USD Million) by Distribution Channel, 2025-2035
  • Figure 5: Global Market Value (USD Million) by Region, 2025-2035
  • Figure 6: Global Market Value (USD Million) Analysis by Region, 2020-2035
  • Figure 7: Global Market Volume (Units) Analysis by Region, 2020-2035
  • Figure 8: Global Market Value Share (%) and BPS Analysis by Region, 2025-2035
  • Figure 9: Global Market Y-o-Y Growth (%) Projections by Region, 2025-2035
  • Figure 10: Global Market Value (USD Million) Analysis by Source, 2020-2035
  • Figure 11: Global Market Volume (Units) Analysis by Source, 2020-2035
  • Figure 12: Global Market Value Share (%) and BPS Analysis by Source, 2025-2035
  • Figure 13: Global Market Y-o-Y Growth (%) Projections by Source, 2025-2035
  • Figure 14: Global Market Value (USD Million) Analysis by Form, 2020-2035
  • Figure 15: Global Market Volume (Units) Analysis by Form, 2020-2035
  • Figure 16: Global Market Value Share (%) and BPS Analysis by Form, 2025-2035
  • Figure 17: Global Market Y-o-Y Growth (%) Projections by Form, 2025-2035
  • Figure 18: Global Market Value (USD Million) Analysis by Application, 2020-2035
  • Figure 19: Global Market Volume (Units) Analysis by Application, 2020-2035
  • Figure 20: Global Market Value Share (%) and BPS Analysis by Application, 2025-2035
  • Figure 21: Global Market Y-o-Y Growth (%) Projections by Application, 2025-2035
  • Figure 22: Global Market Value (USD Million) Analysis by Distribution Channel, 2020-2035
  • Figure 23: Global Market Volume (Units) Analysis by Distribution Channel, 2020-2035
  • Figure 24: Global Market Value Share (%) and BPS Analysis by Distribution Channel, 2025-2035
  • Figure 25: Global Market Y-o-Y Growth (%) Projections by Distribution Channel, 2025-2035
  • Figure 26: Global Market Attractiveness by Source, 2025-2035
  • Figure 27: Global Market Attractiveness by Form, 2025-2035
  • Figure 28: Global Market Attractiveness by Application, 2025-2035
  • Figure 29: Global Market Attractiveness by Distribution Channel, 2025-2035
  • Figure 30: Global Market Attractiveness by Region, 2025-2035
  • Figure 31: North America Market Value (USD Million) by Source, 2025-2035
  • Figure 32: North America Market Value (USD Million) by Form, 2025-2035
  • Figure 33: North America Market Value (USD Million) by Application, 2025-2035
  • Figure 34: North America Market Value (USD Million) by Distribution Channel, 2025-2035
  • Figure 35: North America Market Value (USD Million) by Country, 2025-2035
  • Figure 36: North America Market Value (USD Million) Analysis by Country, 2020-2035
  • Figure 37: North America Market Volume (Units) Analysis by Country, 2020-2035
  • Figure 38: North America Market Value Share (%) and BPS Analysis by Country, 2025-2035
  • Figure 39: North America Market Y-o-Y Growth (%) Projections by Country, 2025-2035
  • Figure 40: North America Market Value (USD Million) Analysis by Source, 2020-2035
  • Figure 41: North America Market Volume (Units) Analysis by Source, 2020-2035
  • Figure 42: North America Market Value Share (%) and BPS Analysis by Source, 2025-2035
  • Figure 43: North America Market Y-o-Y Growth (%) Projections by Source, 2025-2035
  • Figure 44: North America Market Value (USD Million) Analysis by Form, 2020-2035
  • Figure 45: North America Market Volume (Units) Analysis by Form, 2020-2035
  • Figure 46: North America Market Value Share (%) and BPS Analysis by Form, 2025-2035
  • Figure 47: North America Market Y-o-Y Growth (%) Projections by Form, 2025-2035
  • Figure 48: North America Market Value (USD Million) Analysis by Application, 2020-2035
  • Figure 49: North America Market Volume (Units) Analysis by Application, 2020-2035
  • Figure 50: North America Market Value Share (%) and BPS Analysis by Application, 2025-2035
  • Figure 51: North America Market Y-o-Y Growth (%) Projections by Application, 2025-2035
  • Figure 52: North America Market Value (USD Million) Analysis by Distribution Channel, 2020-2035
  • Figure 53: North America Market Volume (Units) Analysis by Distribution Channel, 2020-2035
  • Figure 54: North America Market Value Share (%) and BPS Analysis by Distribution Channel, 2025-2035
  • Figure 55: North America Market Y-o-Y Growth (%) Projections by Distribution Channel, 2025-2035
  • Figure 56: North America Market Attractiveness by Source, 2025-2035
  • Figure 57: North America Market Attractiveness by Form, 2025-2035
  • Figure 58: North America Market Attractiveness by Application, 2025-2035
  • Figure 59: North America Market Attractiveness by Distribution Channel, 2025-2035
  • Figure 60: North America Market Attractiveness by Country, 2025-2035
  • Figure 61: Latin America Market Value (USD Million) by Source, 2025-2035
  • Figure 62: Latin America Market Value (USD Million) by Form, 2025-2035
  • Figure 63: Latin America Market Value (USD Million) by Application, 2025-2035
  • Figure 64: Latin America Market Value (USD Million) by Distribution Channel, 2025-2035
  • Figure 65: Latin America Market Value (USD Million) by Country, 2025-2035
  • Figure 66: Latin America Market Value (USD Million) Analysis by Country, 2020-2035
  • Figure 67: Latin America Market Volume (Units) Analysis by Country, 2020-2035
  • Figure 68: Latin America Market Value Share (%) and BPS Analysis by Country, 2025-2035
  • Figure 69: Latin America Market Y-o-Y Growth (%) Projections by Country, 2025-2035
  • Figure 70: Latin America Market Value (USD Million) Analysis by Source, 2020-2035
  • Figure 71: Latin America Market Volume (Units) Analysis by Source, 2020-2035
  • Figure 72: Latin America Market Value Share (%) and BPS Analysis by Source, 2025-2035
  • Figure 73: Latin America Market Y-o-Y Growth (%) Projections by Source, 2025-2035
  • Figure 74: Latin America Market Value (USD Million) Analysis by Form, 2020-2035
  • Figure 75: Latin America Market Volume (Units) Analysis by Form, 2020-2035
  • Figure 76: Latin America Market Value Share (%) and BPS Analysis by Form, 2025-2035
  • Figure 77: Latin America Market Y-o-Y Growth (%) Projections by Form, 2025-2035
  • Figure 78: Latin America Market Value (USD Million) Analysis by Application, 2020-2035
  • Figure 79: Latin America Market Volume (Units) Analysis by Application, 2020-2035
  • Figure 80: Latin America Market Value Share (%) and BPS Analysis by Application, 2025-2035
  • Figure 81: Latin America Market Y-o-Y Growth (%) Projections by Application, 2025-2035
  • Figure 82: Latin America Market Value (USD Million) Analysis by Distribution Channel, 2020-2035
  • Figure 83: Latin America Market Volume (Units) Analysis by Distribution Channel, 2020-2035
  • Figure 84: Latin America Market Value Share (%) and BPS Analysis by Distribution Channel, 2025-2035
  • Figure 85: Latin America Market Y-o-Y Growth (%) Projections by Distribution Channel, 2025-2035
  • Figure 86: Latin America Market Attractiveness by Source, 2025-2035
  • Figure 87: Latin America Market Attractiveness by Form, 2025-2035
  • Figure 88: Latin America Market Attractiveness by Application, 2025-2035
  • Figure 89: Latin America Market Attractiveness by Distribution Channel, 2025-2035
  • Figure 90: Latin America Market Attractiveness by Country, 2025-2035
  • Figure 91: Europe Market Value (USD Million) by Source, 2025-2035
  • Figure 92: Europe Market Value (USD Million) by Form, 2025-2035
  • Figure 93: Europe Market Value (USD Million) by Application, 2025-2035
  • Figure 94: Europe Market Value (USD Million) by Distribution Channel, 2025-2035
  • Figure 95: Europe Market Value (USD Million) by Country, 2025-2035
  • Figure 96: Europe Market Value (USD Million) Analysis by Country, 2020-2035
  • Figure 97: Europe Market Volume (Units) Analysis by Country, 2020-2035
  • Figure 98: Europe Market Value Share (%) and BPS Analysis by Country, 2025-2035
  • Figure 99: Europe Market Y-o-Y Growth (%) Projections by Country, 2025-2035
  • Figure 100: Europe Market Value (USD Million) Analysis by Source, 2020-2035
  • Figure 101: Europe Market Volume (Units) Analysis by Source, 2020-2035
  • Figure 102: Europe Market Value Share (%) and BPS Analysis by Source, 2025-2035
  • Figure 103: Europe Market Y-o-Y Growth (%) Projections by Source, 2025-2035
  • Figure 104: Europe Market Value (USD Million) Analysis by Form, 2020-2035
  • Figure 105: Europe Market Volume (Units) Analysis by Form, 2020-2035
  • Figure 106: Europe Market Value Share (%) and BPS Analysis by Form, 2025-2035
  • Figure 107: Europe Market Y-o-Y Growth (%) Projections by Form, 2025-2035
  • Figure 108: Europe Market Value (USD Million) Analysis by Application, 2020-2035
  • Figure 109: Europe Market Volume (Units) Analysis by Application, 2020-2035
  • Figure 110: Europe Market Value Share (%) and BPS Analysis by Application, 2025-2035
  • Figure 111: Europe Market Y-o-Y Growth (%) Projections by Application, 2025-2035
  • Figure 112: Europe Market Value (USD Million) Analysis by Distribution Channel, 2020-2035
  • Figure 113: Europe Market Volume (Units) Analysis by Distribution Channel, 2020-2035
  • Figure 114: Europe Market Value Share (%) and BPS Analysis by Distribution Channel, 2025-2035
  • Figure 115: Europe Market Y-o-Y Growth (%) Projections by Distribution Channel, 2025-2035
  • Figure 116: Europe Market Attractiveness by Source, 2025-2035
  • Figure 117: Europe Market Attractiveness by Form, 2025-2035
  • Figure 118: Europe Market Attractiveness by Application, 2025-2035
  • Figure 119: Europe Market Attractiveness by Distribution Channel, 2025-2035
  • Figure 120: Europe Market Attractiveness by Country, 2025-2035
  • Figure 121: East Asia Market Value (USD Million) by Source, 2025-2035
  • Figure 122: East Asia Market Value (USD Million) by Form, 2025-2035
  • Figure 123: East Asia Market Value (USD Million) by Application, 2025-2035
  • Figure 124: East Asia Market Value (USD Million) by Distribution Channel, 2025-2035
  • Figure 125: East Asia Market Value (USD Million) by Country, 2025-2035
  • Figure 126: East Asia Market Value (USD Million) Analysis by Country, 2020-2035
  • Figure 127: East Asia Market Volume (Units) Analysis by Country, 2020-2035
  • Figure 128: East Asia Market Value Share (%) and BPS Analysis by Country, 2025-2035
  • Figure 129: East Asia Market Y-o-Y Growth (%) Projections by Country, 2025-2035
  • Figure 130: East Asia Market Value (USD Million) Analysis by Source, 2020-2035
  • Figure 131: East Asia Market Volume (Units) Analysis by Source, 2020-2035
  • Figure 132: East Asia Market Value Share (%) and BPS Analysis by Source, 2025-2035
  • Figure 133: East Asia Market Y-o-Y Growth (%) Projections by Source, 2025-2035
  • Figure 134: East Asia Market Value (USD Million) Analysis by Form, 2020-2035
  • Figure 135: East Asia Market Volume (Units) Analysis by Form, 2020-2035
  • Figure 136: East Asia Market Value Share (%) and BPS Analysis by Form, 2025-2035
  • Figure 137: East Asia Market Y-o-Y Growth (%) Projections by Form, 2025-2035
  • Figure 138: East Asia Market Value (USD Million) Analysis by Application, 2020-2035
  • Figure 139: East Asia Market Volume (Units) Analysis by Application, 2020-2035
  • Figure 140: East Asia Market Value Share (%) and BPS Analysis by Application, 2025-2035
  • Figure 141: East Asia Market Y-o-Y Growth (%) Projections by Application, 2025-2035
  • Figure 142: East Asia Market Value (USD Million) Analysis by Distribution Channel, 2020-2035
  • Figure 143: East Asia Market Volume (Units) Analysis by Distribution Channel, 2020-2035
  • Figure 144: East Asia Market Value Share (%) and BPS Analysis by Distribution Channel, 2025-2035
  • Figure 145: East Asia Market Y-o-Y Growth (%) Projections by Distribution Channel, 2025-2035
  • Figure 146: East Asia Market Attractiveness by Source, 2025-2035
  • Figure 147: East Asia Market Attractiveness by Form, 2025-2035
  • Figure 148: East Asia Market Attractiveness by Application, 2025-2035
  • Figure 149: East Asia Market Attractiveness by Distribution Channel, 2025-2035
  • Figure 150: East Asia Market Attractiveness by Country, 2025-2035
  • Figure 151: South Asia & Pacific Market Value (USD Million) by Source, 2025-2035
  • Figure 152: South Asia & Pacific Market Value (USD Million) by Form, 2025-2035
  • Figure 153: South Asia & Pacific Market Value (USD Million) by Application, 2025-2035
  • Figure 154: South Asia & Pacific Market Value (USD Million) by Distribution Channel, 2025-2035
  • Figure 155: South Asia & Pacific Market Value (USD Million) by Country, 2025-2035
  • Figure 156: South Asia & Pacific Market Value (USD Million) Analysis by Country, 2020-2035
  • Figure 157: South Asia & Pacific Market Volume (Units) Analysis by Country, 2020-2035
  • Figure 158: South Asia & Pacific Market Value Share (%) and BPS Analysis by Country, 2025-2035
  • Figure 159: South Asia & Pacific Market Y-o-Y Growth (%) Projections by Country, 2025-2035
  • Figure 160: South Asia & Pacific Market Value (USD Million) Analysis by Source, 2020-2035
  • Figure 161: South Asia & Pacific Market Volume (Units) Analysis by Source, 2020-2035
  • Figure 162: South Asia & Pacific Market Value Share (%) and BPS Analysis by Source, 2025-2035
  • Figure 163: South Asia & Pacific Market Y-o-Y Growth (%) Projections by Source, 2025-2035
  • Figure 164: South Asia & Pacific Market Value (USD Million) Analysis by Form, 2020-2035
  • Figure 165: South Asia & Pacific Market Volume (Units) Analysis by Form, 2020-2035
  • Figure 166: South Asia & Pacific Market Value Share (%) and BPS Analysis by Form, 2025-2035
  • Figure 167: South Asia & Pacific Market Y-o-Y Growth (%) Projections by Form, 2025-2035
  • Figure 168: South Asia & Pacific Market Value (USD Million) Analysis by Application, 2020-2035
  • Figure 169: South Asia & Pacific Market Volume (Units) Analysis by Application, 2020-2035
  • Figure 170: South Asia & Pacific Market Value Share (%) and BPS Analysis by Application, 2025-2035
  • Figure 171: South Asia & Pacific Market Y-o-Y Growth (%) Projections by Application, 2025-2035
  • Figure 172: South Asia & Pacific Market Value (USD Million) Analysis by Distribution Channel, 2020-2035
  • Figure 173: South Asia & Pacific Market Volume (Units) Analysis by Distribution Channel, 2020-2035
  • Figure 174: South Asia & Pacific Market Value Share (%) and BPS Analysis by Distribution Channel, 2025-2035
  • Figure 175: South Asia & Pacific Market Y-o-Y Growth (%) Projections by Distribution Channel, 2025-2035
  • Figure 176: South Asia & Pacific Market Attractiveness by Source, 2025-2035
  • Figure 177: South Asia & Pacific Market Attractiveness by Form, 2025-2035
  • Figure 178: South Asia & Pacific Market Attractiveness by Application, 2025-2035
  • Figure 179: South Asia & Pacific Market Attractiveness by Distribution Channel, 2025-2035
  • Figure 180: South Asia & Pacific Market Attractiveness by Country, 2025-2035
  • Figure 181: Middle East and Africa Market Value (USD Million) by Source, 2025-2035
  • Figure 182: Middle East and Africa Market Value (USD Million) by Form, 2025-2035
  • Figure 183: Middle East and Africa Market Value (USD Million) by Application, 2025-2035
  • Figure 184: Middle East and Africa Market Value (USD Million) by Distribution Channel, 2025-2035
  • Figure 185: Middle East and Africa Market Value (USD Million) by Country, 2025-2035
  • Figure 186: Middle East and Africa Market Value (USD Million) Analysis by Country, 2020-2035
  • Figure 187: Middle East and Africa Market Volume (Units) Analysis by Country, 2020-2035
  • Figure 188: Middle East and Africa Market Value Share (%) and BPS Analysis by Country, 2025-2035
  • Figure 189: Middle East and Africa Market Y-o-Y Growth (%) Projections by Country, 2025-2035
  • Figure 190: Middle East and Africa Market Value (USD Million) Analysis by Source, 2020-2035
  • Figure 191: Middle East and Africa Market Volume (Units) Analysis by Source, 2020-2035
  • Figure 192: Middle East and Africa Market Value Share (%) and BPS Analysis by Source, 2025-2035
  • Figure 193: Middle East and Africa Market Y-o-Y Growth (%) Projections by Source, 2025-2035
  • Figure 194: Middle East and Africa Market Value (USD Million) Analysis by Form, 2020-2035
  • Figure 195: Middle East and Africa Market Volume (Units) Analysis by Form, 2020-2035
  • Figure 196: Middle East and Africa Market Value Share (%) and BPS Analysis by Form, 2025-2035
  • Figure 197: Middle East and Africa Market Y-o-Y Growth (%) Projections by Form, 2025-2035
  • Figure 198: Middle East and Africa Market Value (USD Million) Analysis by Application, 2020-2035
  • Figure 199: Middle East and Africa Market Volume (Units) Analysis by Application, 2020-2035
  • Figure 200: Middle East and Africa Market Value Share (%) and BPS Analysis by Application, 2025-2035
  • Figure 201: Middle East and Africa Market Y-o-Y Growth (%) Projections by Application, 2025-2035
  • Figure 202: Middle East and Africa Market Value (USD Million) Analysis by Distribution Channel, 2020-2035
  • Figure 203: Middle East and Africa Market Volume (Units) Analysis by Distribution Channel, 2020-2035
  • Figure 204: Middle East and Africa Market Value Share (%) and BPS Analysis by Distribution Channel, 2025-2035
  • Figure 205: Middle East and Africa Market Y-o-Y Growth (%) Projections by Distribution Channel, 2025-2035
  • Figure 206: Middle East and Africa Market Attractiveness by Source, 2025-2035
  • Figure 207: Middle East and Africa Market Attractiveness by Form, 2025-2035
  • Figure 208: Middle East and Africa Market Attractiveness by Application, 2025-2035
  • Figure 209: Middle East and Africa Market Attractiveness by Distribution Channel, 2025-2035
  • Figure 210: Middle East and Africa Market Attractiveness by Country, 2025-2035

Frequently Asked Questions

How big is the Abierixin Market in 2025?

The Abierixin Market is estimated to be valued at USD 101.0 million in 2025.

What will be the size of the Abierixin Market in 2035?

The market size for the Abierixin Market is projected to reach USD 179.5 million by 2035.

How much will be the Abierixin Market growth between 2025 and 2035?

The Abierixin Market is expected to grow at a 5.9% CAGR between 2025 and 2035.

What are the key product types in the Abierixin Market?

The key product types in the Abierixin Market are Powder, Beadlets, Liquid/Oil Suspension, and Encapsulated/Microencapsulated formats.

Which source segment will contribute the significant share in the Abierixin Market in 2025?

In terms of source, the Microalgae segment is set to command 40% share in the Abierixin Market in 2025.

Future Market Insights

Abierixin Market

Chat With

MaRIA

Hi There, I am MaRIA, Your Market Research Intelligence Assistant. How may I help you?