Reports

- Global Locations -

Headquarters

Future Market Insights, Inc.

Christiana Corporate, 200
Continental Drive, Suite 401,
Newark, Delaware - 19713,
United States

T: +1-845-579-5705

Americas

Future Market Insights, Inc.

616 Corporate Way, Suite 2-9018,
Valley Cottage, NY 10989, United States

T: +1-347-918-3531

MEA

Future Market Insights

1602-6 Jumeirah Bay X2 Tower, Plot No: JLT-PH2-X2A,
Jumeirah Lakes Towers, Dubai,
United Arab Emirates

Europe

Future Market Insights

3rd Floor, 207 Regent Street,
W1B 3HH London
United Kingdom

T: + 44 (0) 20 8123 9659
D: +44 (0) 20 3287 4268

Asia Pacific

Future Market Insights

IndiaLand Global Tech Park, Unit UG-1, Behind Grand HighStreet, Phase 1, Hinjawadi, MH, Pune – 411057, India

Absinthe Market Outlook (2023 to 2033)

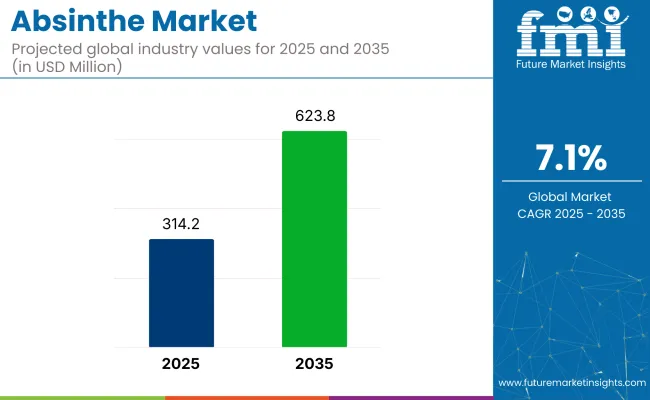
The absinthe market is anticipated to reach a forecasted market value of US$ 273.9 million by 2033 while expanding its global space at an average CAGR of 6.7% (2023 to 2033). The market holds a market value of US$ 142.7 million in 2023.

The increased demand for absinthe globally, its medicinal applications, and its growing popularity. Absinthe market survey explains the concept of mindful drinking and Sober-curious drinking and increased rising per capita income. Absinthe has gained popularity with a higher number of bars and restaurants around the world, fueling the sales for Absinthe.

Report Attribute Details
Absinthe Market Value (2023) US$ 142.7 million
Absinthe Market Anticipated Value (2033) US$ 273.9 million
Absinthe Market Projected Growth Rate (2022 to 2032) 6.7%

The absinthe market report explains that the new enhanced flavours and refined drinks are increasing the popularity of Absinthe. The responsible drinking and legalization of alcohol in some public places have gained traction for the absinthe market.

The market has witnessed a growth in sales as the medicinal use of wormwood, the plant from which absinthe is extracted, has increased over the years. People now have started looking for alternative medicines for the diseases as they have lower side effects than the usages of various drugs, fueling the sales of absinthe.

The use of absinthe in the food industry, especially in deserts and confectionery products, to keep them tasty and safe from bacteria also gains traction in the absinthe market. Absinthe without sugar is spirit, holds its properties, and is generally consumed by diluting it with water.

Expanding absinthe market share is attributed to its use in the food industry as a garnishing product. For instance, dried absinthe leaves are used in red meat, fish, and other curries.

Don't pay for what you don't need

Customize your report by selecting specific countries or regions and save 30%!

Growth Trends for Absinthe Market

The striving for an absinthe market and its growth are attributed to certain trends that affect the market’s performance. Future Market Insights describes these trends as follows:

High Alcohol Content:

Generally, alcohol like Whiskey and Gin has an alcohol percentage of 46% and 50%, respectively, while Absinthe’s levels vary from 65% to 90%. For example, the Parisian Absinthe brand’s Fee contains 68% alcohol, while Hapsburg Premium Reserve is 89.9% alcohol. So, the tendency to dilute with 4 to 5 parts water, even more later, is suggested, flourishing the demand for absinthe.

Medicinal Use:

The medicinal use of absinthe puts it in a unique spot with higher adoption rates. The key ingredient of absinthe is Artemisia absinthium, aka Wormwood, so named for its ability to kill and expel intestinal worms from the human body.

Its use is effective in digestion problems such as loss of appetite, upset stomach, intestinal spasms, and gall bladder disease. Its effective experiments in managing diabetes, heart illness, and cancer with anti-tumor and anti-inflammatory benefits fuel the demand for absinthe in various regions.

Popularity and History:

Absinthe is said to be consumed by famous personalities like Van Gogh, Picasso, Lautrec, and Hemingway and has been their drink of choice. Its popularity and reputation of being a creative enhancer and aphrodisiac for over 200 years now. History has given a name to the potent liquor absinthe that is known as the green fairy. Even the latest market players have made Absinthe Absente 55 which promotes Van Gogh’s drinking absinthe.

Food Applications:

Wormwood, the absinthe plant is used as an absolute in many confectioneries and deserts. It’s not just bartenders and alcohol mixologists that introduce the green spirit into their bars but kitchens worldwide also use the absinthe processed and absolute, even the wormwood plant leaves in different dishes in red meat, oysters, escargot, and fish.

What are the Major Drivers and Restraints of the Absinthe Market?

Drivers:

Emerging trends in the absinthe market define the absinthe’s popularity as skyrocketing worldwide due to its medicinal benefits, such as stimulating the digestive tract by increasing saliva, stomach acid, and digestive enzyme production.

Absinthe can also be used to treat parasitic worm infections. The soaring demand for cosmetics in the market is also driving up demand for absinthe, which is used as an anti-inflammatory, anti-microbial, and insect-repellent product in the industry.

Of Absinthe's ability to enhance the flavor and taste of food products, its use in the food industry has grown. Absinthe is another alcoholic beverage widely consumed worldwide and has seen significant growth in the forecast period.

Opportunities:

The increase in absinthe consumption following the repeal of the prohibition and the increase in disposable income is expected to propel the market growth. Furthermore, growth in absinthe demand, particularly among artists and painters, musicians, and guitarists, is expected to provide opportunities for the absinthe market.

Restraints:

Although, there is a significant rise in absinthe consumption following the repeal of the prohibition, and the increase in disposable income is expected to drive market growth. Nevertheless, alcohol bans in some countries, rumors of mental instability, and public perception of Absinthe's negative effects may stymie market growth.

Nandini Roy Choudhury

Principal Consultant

Talk to Analyst

Find your sweet spots for generating winning opportunities in this market.

Absinthe Market Segmental Analysis

Which Application is Expected to Exhibit Maximum Growth?

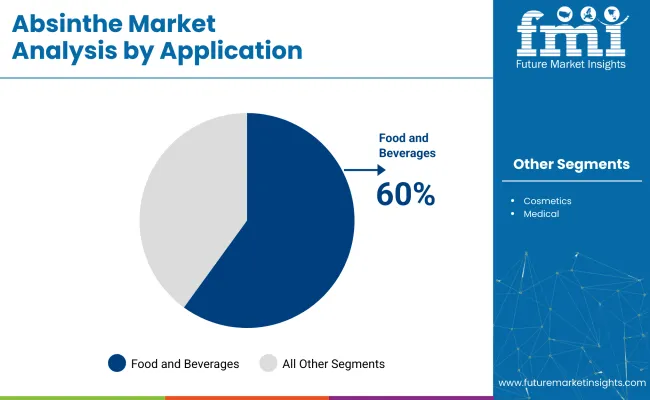
Based on application, the absinthe market is segmented into three segments: the food and beverage industry, the cosmetic industry, and the medical industry. The food and beverage segment was the most prominent, accounting for the majority of absinthe market share. This is due to an increase in demand for new flavors developed by the players in this category.

The one-stop shopping experience provided by retail stores and online formats makes it a very popular shopping option for consumers. However, due to rapid internet and smartphone penetration, online shopping is expected to boost growth during the forecast period.

Why is the Absinthe Bohemian Segment Projected to Gain Maximum Traction?

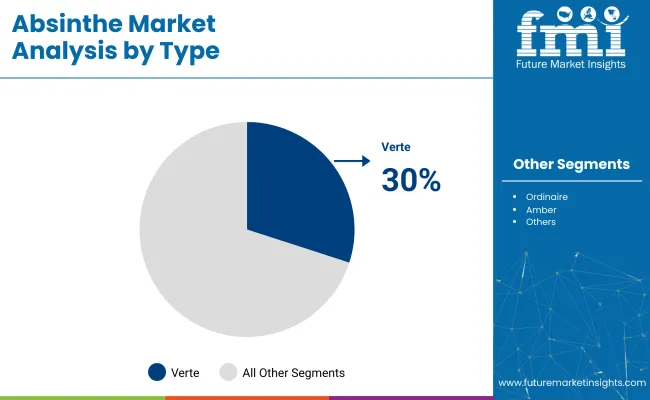
According to the types absinthe is classified into eight types, including absinthe blanche, absinthe amber, absinthe verte, absinthe ordinaire, absinthe reve pastis, absinthe bohemian, absinthe liqueur, and premium absinthe.

Absinthe bohemian is popular in Europe and is made without aniseed. The aniseed ingredient is replaced with lemon or another fruit extract in absinthe liqueur to obtain fruit flavor in absinthe liqueur. It is expected to fuel the demand for absinthe in new market spaces.

Regional Analysis

What are the Growth Prospects in North America?

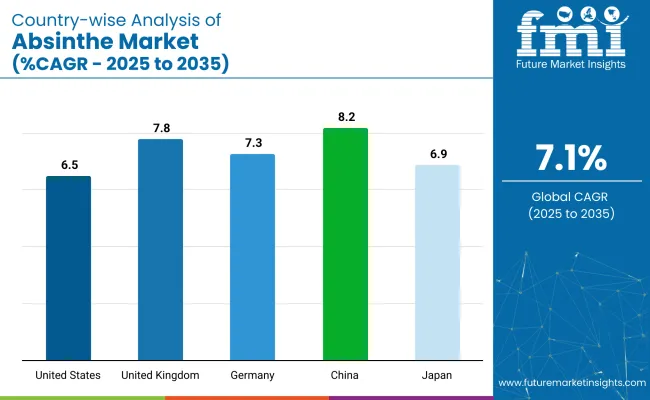
According to the study, the market in North America is anticipated to exhibit a market share of 33.7% in 2022. Since Absinthe is an extremely popular alcoholic beverage in USA, its demand is on a roll.

This trend is expected to continue during the forecast period owing to the health benefits of Absinthe as well as its increasing use in the cosmetic and Food & Beverage industries. Hence, the market is forecasted to show a positive outlook over the assessment period.

How are the Favorable Government Schemes Boosting the Market in Europe?

The Absinthe market survey explains that Europe is forecasted to be profitable for the Absinthe market players during the projected timeframe. Absinthe is one of the most consumed alcoholic beverages in European Countries. Moreover, with France and Switzerland being the top exporters of Absinthe in the world, the demand for Absinthe is expected to rise in the upcoming years.

Currently, the industry is thriving in Spain and the Czech Republic, owing to its wild popularity there, which is a key driving factor of the market. Moreover, as the awareness of the medical benefits of absinthe is increasing so is the use of absinthe in the medical industry.

As a result of the above-mentioned factors, the European absinthe market is anticipated to account for a 27.4% share of the global market in 2022. As Swiss alcohol is preferred all around the world because of its refined taste and containing aging processes, absinthe’s history related to Switzerland puts it in a favorable spot.

Get the data you need at a Fraction of the cost

Personalize your report by choosing insights you need
and save 40%!

How are Start-ups Structuring the Absinthe Market?

The startup dynamics for the absinthe market are dynamic and hold the capability of expanding market space. The new brands with exotic flavors and different levels of alcohol are fueling the sales of Absinthe. The new market players are investing huge amounts of money in the absinthe market. Companies experiment with products specific to the application of food and medicine.

How Key Players are Contributing to the Absinthe Market?

The market players in the global Absinthe market are adopting a variety of strategies to strengthen their position in the market. Acquisitions, partnerships, and agreements are some of the most adopted strategies.

Recent Mergers and Product Launch:

  • La Fée Absinthe, the vibrant green anise-flavored spirit that first gained popularity in the late 19th and early 20th centuries, is again launched its older-aged absinthe. This is anticipated to fuel the sales of absinthe.
  • Lucid Absinthe Superieure has introduced the first genuine absinthe made with real Grande Wormwood to be legally available in the USA after the repeal of the 95-year ban.

Key Players

  • La Fée Absinthe
  • Lucid Absinthe Supérieure
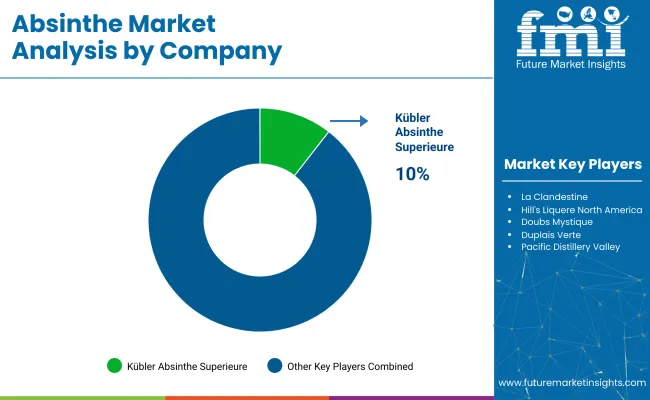
  • Kübler Absinthe Superieure
  • La Clandestine
  • Hill's Liquere North America
  • Doubs Mystique
  • Duplais Verte
  • Pacific Distillery
  • Alandia GmbH & Co. KG
  • Butterfly absinthe
  • Jade Liqueurs LLC
  • Philadelphia Distilling Company
  • Teichenne S.A.
  • Milan METELKA a.s
  • RUDOLF

Scope Of The Report

Report Attribute Details
Growth Rate CAGR of 6.7% from 2023 to 2033
Base Year for Estimation 2023
Historical Data 2018 to 2022
Forecast Period 2023 to 2033
Quantitative Units Revenue in US$ million and CAGR from 2023 to 2033
Report Coverage Revenue Forecast, Volume Forecast, Company Ranking, Competitive Landscape, Growth Factors, Trends, and Pricing Analysis
Segments Covered
  • Application
  • Type
  • Region
Regions Covered
  • North America
  • Latin America
  • Western Europe
  • Eastern Europe
  • The Asia Pacific excluding Japan
  • Japan
  • The Middle East and Africa
Key Countries Profiled
  • The USA
  • Canada
  • Brazil
  • Argentina
  • Germany
  • The United Kingdom
  • France
  • Spain
  • Italy
  • Nordics
  • BENELUX
  • Australia & New Zealand
  • China
  • India
  • GCC Countries
  • South Africa
Key Companies Profiled
  • La Fée Absinthe
  • Lucid Absinthe Supérieure
  • Kübler Absinthe Superieure
  • La Clandestine
  • Hill's Liquere North America
  • Doubs Mystique
  • Duplais Verte
  • Pacific Distillery
  • Alandia GmbH & Co. KG
  • Butterfly absinthe
  • Jade Liqueurs LLC
  • Philadelphia Distilling Company
  • Teichenne S.A.
  • Milan METELKA a.s
  • RUDOLF

Key segments

By Application:

  • Food and Beverages Industry
  • Cosmetics Industry
  • Medical Industry

By Type:

  • Blanche
  • Amber
  • Verte
  • Ordinaire
  • Reve Pastis
  • Bohemian
  • Liqueur
  • Premium

By Region:

  • North America
  • Latin America
  • Asia Pacific
  • Middle East and Africa
  • Europe

Frequently Asked Questions

What is the Absinthe Market Value in 2023?

The market is valued at US$ 142.7 million in 2023.

What is the Growth Potential of the Absinthe Market

The growth potential of the absinthe market is 6.7% through 2033.

Who are the Leading Market Players?

La Fée Absinthe and Lucid Absinthe Supérieure are the leading market players.

What Opportunities Await the Market Players?

Increasing demand for cosmetics to boost the market prospects.

Which is the Key Segment by Application?

The food and beverage segment is likely to remain preferred through 2033.

Table of Content

1. Executive Summary

    1.1. Global Market Outlook

    1.2. Demand-side Trends

    1.3. Supply-side Trends

    1.4. Technology Roadmap Analysis

    1.5. Analysis and Recommendations

2. Market Overview

    2.1. Market Coverage / Taxonomy

    2.2. Market Definition / Scope / Limitations

3. Market Background

    3.1. Market Dynamics

        3.1.1. Drivers

        3.1.2. Restraints

        3.1.3. Opportunity

        3.1.4. Trends

    3.2. Scenario Forecast

        3.2.1. Demand in Optimistic Scenario

        3.2.2. Demand in Likely Scenario

        3.2.3. Demand in Conservative Scenario

    3.3. Opportunity Map Analysis

    3.4. Product Life Cycle Analysis

    3.5. Supply Chain Analysis

        3.5.1. Supply Side Participants and their Roles

            3.5.1.1. Producers

            3.5.1.2. Mid-Level Participants (Traders/ Agents/ Brokers)

            3.5.1.3. Wholesalers and Distributors

        3.5.2. Value Added and Value Created at Node in the Supply Chain

        3.5.3. List of Raw Material Suppliers

        3.5.4. List of Existing and Potential Buyer’s

    3.6. Investment Feasibility Matrix

    3.7. Value Chain Analysis

        3.7.1. Profit Margin Analysis

        3.7.2. Wholesalers and Distributors

        3.7.3. Retailers

    3.8. PESTLE and Porter’s Analysis

    3.9. Regulatory Landscape

        3.9.1. By Key Regions

        3.9.2. By Key Countries

    3.10. Regional Parent Market Outlook

    3.11. Production and Consumption Statistics

    3.12. Import and Export Statistics

4. Global Market Analysis 2018 to 2022 and Forecast, 2023 to 2033

    4.1. Historical Market Size Value (US$ Million) & Volume (Liters) Analysis, 2018 to 2022

    4.2. Current and Future Market Size Value (US$ Million) & Volume (Liters) Projections, 2023 to 2033

        4.2.1. Y-o-Y Growth Trend Analysis

        4.2.2. Absolute $ Opportunity Analysis

5. Global Market Analysis 2018 to 2022 and Forecast 2023 to 2033, By Application

    5.1. Introduction / Key Findings

    5.2. Historical Market Size Value (US$ Million) & Volume (Liters) Analysis By Application, 2018 to 2022

    5.3. Current and Future Market Size Value (US$ Million) & Volume (Liters) Analysis and Forecast By Application, 2023 to 2033

        5.3.1. Food and Beverages Industry

        5.3.2. Cosmetics Industry

        5.3.3. Medical Industry

    5.4. Y-o-Y Growth Trend Analysis By Application, 2018 to 2022

    5.5. Absolute $ Opportunity Analysis By Application, 2023 to 2033

6. Global Market Analysis 2018 to 2022 and Forecast 2023 to 2033, By Type

    6.1. Introduction / Key Findings

    6.2. Historical Market Size Value (US$ Million) & Volume (Liters) Analysis By Type, 2018 to 2022

    6.3. Current and Future Market Size Value (US$ Million) & Volume (Liters) Analysis and Forecast By Type, 2023 to 2033

        6.3.1. Blanche

        6.3.2. Amber

        6.3.3. Verte

        6.3.4. Ordinaire

        6.3.5. Reve Pastis

        6.3.6. Bohemian

        6.3.7. Liqueur

        6.3.8. Premium

    6.4. Y-o-Y Growth Trend Analysis By Type, 2018 to 2022

    6.5. Absolute $ Opportunity Analysis By Type, 2023 to 2033

7. Global Market Analysis 2018 to 2022 and Forecast 2023 to 2033, By Region

    7.1. Introduction

    7.2. Historical Market Size Value (US$ Million) & Volume (Liters) Analysis By Region, 2018 to 2022

    7.3. Current Market Size Value (US$ Million) & Volume (Liters) Analysis and Forecast By Region, 2023 to 2033

        7.3.1. North America

        7.3.2. Latin America

        7.3.3. Western Europe

        7.3.4. Eastern Europe

        7.3.5. South Asia and Pacific

        7.3.6. East Asia

        7.3.7. Middle East and Africa

    7.4. Market Attractiveness Analysis By Region

8. North America Market Analysis 2018 to 2022 and Forecast 2023 to 2033, By Country

    8.1. Historical Market Size Value (US$ Million) & Volume (Liters) Trend Analysis By Market Taxonomy, 2018 to 2022

    8.2. Market Size Value (US$ Million) & Volume (Liters) Forecast By Market Taxonomy, 2023 to 2033

        8.2.1. By Country

            8.2.1.1. USA

            8.2.1.2. Canada

        8.2.2. By Application

        8.2.3. By Type

    8.3. Market Attractiveness Analysis

        8.3.1. By Country

        8.3.2. By Application

        8.3.3. By Type

    8.4. Key Takeaways

9. Latin America Market Analysis 2018 to 2022 and Forecast 2023 to 2033, By Country

    9.1. Historical Market Size Value (US$ Million) & Volume (Liters) Trend Analysis By Market Taxonomy, 2018 to 2022

    9.2. Market Size Value (US$ Million) & Volume (Liters) Forecast By Market Taxonomy, 2023 to 2033

        9.2.1. By Country

            9.2.1.1. Brazil

            9.2.1.2. Mexico

            9.2.1.3. Rest of Latin America

        9.2.2. By Application

        9.2.3. By Type

    9.3. Market Attractiveness Analysis

        9.3.1. By Country

        9.3.2. By Application

        9.3.3. By Type

    9.4. Key Takeaways

10. Western Europe Market Analysis 2018 to 2022 and Forecast 2023 to 2033, By Country

    10.1. Historical Market Size Value (US$ Million) & Volume (Liters) Trend Analysis By Market Taxonomy, 2018 to 2022

    10.2. Market Size Value (US$ Million) & Volume (Liters) Forecast By Market Taxonomy, 2023 to 2033

        10.2.1. By Country

            10.2.1.1. Germany

            10.2.1.2. UK

            10.2.1.3. France

            10.2.1.4. Spain

            10.2.1.5. Italy

            10.2.1.6. Rest of Western Europe

        10.2.2. By Application

        10.2.3. By Type

    10.3. Market Attractiveness Analysis

        10.3.1. By Country

        10.3.2. By Application

        10.3.3. By Type

    10.4. Key Takeaways

11. Eastern Europe Market Analysis 2018 to 2022 and Forecast 2023 to 2033, By Country

    11.1. Historical Market Size Value (US$ Million) & Volume (Liters) Trend Analysis By Market Taxonomy, 2018 to 2022

    11.2. Market Size Value (US$ Million) & Volume (Liters) Forecast By Market Taxonomy, 2023 to 2033

        11.2.1. By Country

            11.2.1.1. Poland

            11.2.1.2. Russia

            11.2.1.3. Czech Republic

            11.2.1.4. Romania

            11.2.1.5. Rest of Eastern Europe

        11.2.2. By Application

        11.2.3. By Type

    11.3. Market Attractiveness Analysis

        11.3.1. By Country

        11.3.2. By Application

        11.3.3. By Type

    11.4. Key Takeaways

12. South Asia and Pacific Market Analysis 2018 to 2022 and Forecast 2023 to 2033, By Country

    12.1. Historical Market Size Value (US$ Million) & Volume (Liters) Trend Analysis By Market Taxonomy, 2018 to 2022

    12.2. Market Size Value (US$ Million) & Volume (Liters) Forecast By Market Taxonomy, 2023 to 2033

        12.2.1. By Country

            12.2.1.1. India

            12.2.1.2. Bangladesh

            12.2.1.3. Australia

            12.2.1.4. New Zealand

            12.2.1.5. Rest of South Asia and Pacific

        12.2.2. By Application

        12.2.3. By Type

    12.3. Market Attractiveness Analysis

        12.3.1. By Country

        12.3.2. By Application

        12.3.3. By Type

    12.4. Key Takeaways

13. East Asia Market Analysis 2018 to 2022 and Forecast 2023 to 2033, By Country

    13.1. Historical Market Size Value (US$ Million) & Volume (Liters) Trend Analysis By Market Taxonomy, 2018 to 2022

    13.2. Market Size Value (US$ Million) & Volume (Liters) Forecast By Market Taxonomy, 2023 to 2033

        13.2.1. By Country

            13.2.1.1. China

            13.2.1.2. Japan

            13.2.1.3. South Korea

        13.2.2. By Application

        13.2.3. By Type

    13.3. Market Attractiveness Analysis

        13.3.1. By Country

        13.3.2. By Application

        13.3.3. By Type

    13.4. Key Takeaways

14. Middle East and Africa Market Analysis 2018 to 2022 and Forecast 2023 to 2033, By Country

    14.1. Historical Market Size Value (US$ Million) & Volume (Liters) Trend Analysis By Market Taxonomy, 2018 to 2022

    14.2. Market Size Value (US$ Million) & Volume (Liters) Forecast By Market Taxonomy, 2023 to 2033

        14.2.1. By Country

            14.2.1.1. GCC Countries

            14.2.1.2. South Africa

            14.2.1.3. Israel

            14.2.1.4. Rest of MEA

        14.2.2. By Application

        14.2.3. By Type

    14.3. Market Attractiveness Analysis

        14.3.1. By Country

        14.3.2. By Application

        14.3.3. By Type

    14.4. Key Takeaways

15. Key Countries Market Analysis

    15.1. USA

        15.1.1. Pricing Analysis

        15.1.2. Market Share Analysis, 2022

            15.1.2.1. By Application

            15.1.2.2. By Type

    15.2. Canada

        15.2.1. Pricing Analysis

        15.2.2. Market Share Analysis, 2022

            15.2.2.1. By Application

            15.2.2.2. By Type

    15.3. Brazil

        15.3.1. Pricing Analysis

        15.3.2. Market Share Analysis, 2022

            15.3.2.1. By Application

            15.3.2.2. By Type

    15.4. Mexico

        15.4.1. Pricing Analysis

        15.4.2. Market Share Analysis, 2022

            15.4.2.1. By Application

            15.4.2.2. By Type

    15.5. Germany

        15.5.1. Pricing Analysis

        15.5.2. Market Share Analysis, 2022

            15.5.2.1. By Application

            15.5.2.2. By Type

    15.6. UK

        15.6.1. Pricing Analysis

        15.6.2. Market Share Analysis, 2022

            15.6.2.1. By Application

            15.6.2.2. By Type

    15.7. France

        15.7.1. Pricing Analysis

        15.7.2. Market Share Analysis, 2022

            15.7.2.1. By Application

            15.7.2.2. By Type

    15.8. Spain

        15.8.1. Pricing Analysis

        15.8.2. Market Share Analysis, 2022

            15.8.2.1. By Application

            15.8.2.2. By Type

    15.9. Italy

        15.9.1. Pricing Analysis

        15.9.2. Market Share Analysis, 2022

            15.9.2.1. By Application

            15.9.2.2. By Type

    15.10. Poland

        15.10.1. Pricing Analysis

        15.10.2. Market Share Analysis, 2022

            15.10.2.1. By Application

            15.10.2.2. By Type

    15.11. Russia

        15.11.1. Pricing Analysis

        15.11.2. Market Share Analysis, 2022

            15.11.2.1. By Application

            15.11.2.2. By Type

    15.12. Czech Republic

        15.12.1. Pricing Analysis

        15.12.2. Market Share Analysis, 2022

            15.12.2.1. By Application

            15.12.2.2. By Type

    15.13. Romania

        15.13.1. Pricing Analysis

        15.13.2. Market Share Analysis, 2022

            15.13.2.1. By Application

            15.13.2.2. By Type

    15.14. India

        15.14.1. Pricing Analysis

        15.14.2. Market Share Analysis, 2022

            15.14.2.1. By Application

            15.14.2.2. By Type

    15.15. Bangladesh

        15.15.1. Pricing Analysis

        15.15.2. Market Share Analysis, 2022

            15.15.2.1. By Application

            15.15.2.2. By Type

    15.16. Australia

        15.16.1. Pricing Analysis

        15.16.2. Market Share Analysis, 2022

            15.16.2.1. By Application

            15.16.2.2. By Type

    15.17. New Zealand

        15.17.1. Pricing Analysis

        15.17.2. Market Share Analysis, 2022

            15.17.2.1. By Application

            15.17.2.2. By Type

    15.18. China

        15.18.1. Pricing Analysis

        15.18.2. Market Share Analysis, 2022

            15.18.2.1. By Application

            15.18.2.2. By Type

    15.19. Japan

        15.19.1. Pricing Analysis

        15.19.2. Market Share Analysis, 2022

            15.19.2.1. By Application

            15.19.2.2. By Type

    15.20. South Korea

        15.20.1. Pricing Analysis

        15.20.2. Market Share Analysis, 2022

            15.20.2.1. By Application

            15.20.2.2. By Type

    15.21. GCC Countries

        15.21.1. Pricing Analysis

        15.21.2. Market Share Analysis, 2022

            15.21.2.1. By Application

            15.21.2.2. By Type

    15.22. South Africa

        15.22.1. Pricing Analysis

        15.22.2. Market Share Analysis, 2022

            15.22.2.1. By Application

            15.22.2.2. By Type

    15.23. Israel

        15.23.1. Pricing Analysis

        15.23.2. Market Share Analysis, 2022

            15.23.2.1. By Application

            15.23.2.2. By Type

16. Market Structure Analysis

    16.1. Competition Dashboard

    16.2. Competition Benchmarking

    16.3. Market Share Analysis of Top Players

        16.3.1. By Regional

        16.3.2. By Application

        16.3.3. By Type

17. Competition Analysis

    17.1. Competition Deep Dive

        17.1.1. La Fée Absinthe

            17.1.1.1. Overview

            17.1.1.2. Product Portfolio

            17.1.1.3. Profitability by Market Segments

            17.1.1.4. Sales Footprint

            17.1.1.5. Strategy Overview

                17.1.1.5.1. Marketing Strategy

                17.1.1.5.2. Product Strategy

                17.1.1.5.3. Channel Strategy

        17.1.2. Lucid Supérieure

            17.1.2.1. Overview

            17.1.2.2. Product Portfolio

            17.1.2.3. Profitability by Market Segments

            17.1.2.4. Sales Footprint

            17.1.2.5. Strategy Overview

                17.1.2.5.1. Marketing Strategy

                17.1.2.5.2. Product Strategy

                17.1.2.5.3. Channel Strategy

        17.1.3. Kübler Superieure

            17.1.3.1. Overview

            17.1.3.2. Product Portfolio

            17.1.3.3. Profitability by Market Segments

            17.1.3.4. Sales Footprint

            17.1.3.5. Strategy Overview

                17.1.3.5.1. Marketing Strategy

                17.1.3.5.2. Product Strategy

                17.1.3.5.3. Channel Strategy

        17.1.4. La Clandestine

            17.1.4.1. Overview

            17.1.4.2. Product Portfolio

            17.1.4.3. Profitability by Market Segments

            17.1.4.4. Sales Footprint

            17.1.4.5. Strategy Overview

                17.1.4.5.1. Marketing Strategy

                17.1.4.5.2. Product Strategy

                17.1.4.5.3. Channel Strategy

        17.1.5. Hill's Liquere North America

            17.1.5.1. Overview

            17.1.5.2. Product Portfolio

            17.1.5.3. Profitability by Market Segments

            17.1.5.4. Sales Footprint

            17.1.5.5. Strategy Overview

                17.1.5.5.1. Marketing Strategy

                17.1.5.5.2. Product Strategy

                17.1.5.5.3. Channel Strategy

        17.1.6. Doubs Mystique

            17.1.6.1. Overview

            17.1.6.2. Product Portfolio

            17.1.6.3. Profitability by Market Segments

            17.1.6.4. Sales Footprint

            17.1.6.5. Strategy Overview

                17.1.6.5.1. Marketing Strategy

                17.1.6.5.2. Product Strategy

                17.1.6.5.3. Channel Strategy

        17.1.7. Duplais Verte

            17.1.7.1. Overview

            17.1.7.2. Product Portfolio

            17.1.7.3. Profitability by Market Segments

            17.1.7.4. Sales Footprint

            17.1.7.5. Strategy Overview

                17.1.7.5.1. Marketing Strategy

                17.1.7.5.2. Product Strategy

                17.1.7.5.3. Channel Strategy

        17.1.8. Pacific Distillery

            17.1.8.1. Overview

            17.1.8.2. Product Portfolio

            17.1.8.3. Profitability by Market Segments

            17.1.8.4. Sales Footprint

            17.1.8.5. Strategy Overview

                17.1.8.5.1. Marketing Strategy

                17.1.8.5.2. Product Strategy

                17.1.8.5.3. Channel Strategy

        17.1.9. Alandia GmbH & Co. KG

            17.1.9.1. Overview

            17.1.9.2. Product Portfolio

            17.1.9.3. Profitability by Market Segments

            17.1.9.4. Sales Footprint

            17.1.9.5. Strategy Overview

                17.1.9.5.1. Marketing Strategy

                17.1.9.5.2. Product Strategy

                17.1.9.5.3. Channel Strategy

        17.1.10. Butterfly absinthe

            17.1.10.1. Overview

            17.1.10.2. Product Portfolio

            17.1.10.3. Profitability by Market Segments

            17.1.10.4. Sales Footprint

            17.1.10.5. Strategy Overview

                17.1.10.5.1. Marketing Strategy

                17.1.10.5.2. Product Strategy

                17.1.10.5.3. Channel Strategy

        17.1.11. Jade Liqueurs LLC

            17.1.11.1. Overview

            17.1.11.2. Product Portfolio

            17.1.11.3. Profitability by Market Segments

            17.1.11.4. Sales Footprint

            17.1.11.5. Strategy Overview

                17.1.11.5.1. Marketing Strategy

                17.1.11.5.2. Product Strategy

                17.1.11.5.3. Channel Strategy

        17.1.12. Philadelphia Distilling Company

            17.1.12.1. Overview

            17.1.12.2. Product Portfolio

            17.1.12.3. Profitability by Market Segments

            17.1.12.4. Sales Footprint

            17.1.12.5. Strategy Overview

                17.1.12.5.1. Marketing Strategy

                17.1.12.5.2. Product Strategy

                17.1.12.5.3. Channel Strategy

        17.1.13. Teichenne S.A.

            17.1.13.1. Overview

            17.1.13.2. Product Portfolio

            17.1.13.3. Profitability by Market Segments

            17.1.13.4. Sales Footprint

            17.1.13.5. Strategy Overview

                17.1.13.5.1. Marketing Strategy

                17.1.13.5.2. Product Strategy

                17.1.13.5.3. Channel Strategy

        17.1.14. Milan METELKA a.s

            17.1.14.1. Overview

            17.1.14.2. Product Portfolio

            17.1.14.3. Profitability by Market Segments

            17.1.14.4. Sales Footprint

            17.1.14.5. Strategy Overview

                17.1.14.5.1. Marketing Strategy

                17.1.14.5.2. Product Strategy

                17.1.14.5.3. Channel Strategy

        17.1.15. RUDOLF

            17.1.15.1. Overview

            17.1.15.2. Product Portfolio

            17.1.15.3. Profitability by Market Segments

            17.1.15.4. Sales Footprint

            17.1.15.5. Strategy Overview

                17.1.15.5.1. Marketing Strategy

                17.1.15.5.2. Product Strategy

                17.1.15.5.3. Channel Strategy

18. Assumptions & Acronyms Used

19. Research Methodology

List of Tables

Table 1: Global Market Value (US$ Million) Forecast by Region, 2018 to 2033

Table 2: Global Market Volume (Liters) Forecast by Region, 2018 to 2033

Table 3: Global Market Value (US$ Million) Forecast by Application, 2018 to 2033

Table 4: Global Market Volume (Liters) Forecast by Application, 2018 to 2033

Table 5: Global Market Value (US$ Million) Forecast by Type, 2018 to 2033

Table 6: Global Market Volume (Liters) Forecast by Type, 2018 to 2033

Table 7: North America Market Value (US$ Million) Forecast by Country, 2018 to 2033

Table 8: North America Market Volume (Liters) Forecast by Country, 2018 to 2033

Table 9: North America Market Value (US$ Million) Forecast by Application, 2018 to 2033

Table 10: North America Market Volume (Liters) Forecast by Application, 2018 to 2033

Table 11: North America Market Value (US$ Million) Forecast by Type, 2018 to 2033

Table 12: North America Market Volume (Liters) Forecast by Type, 2018 to 2033

Table 13: Latin America Market Value (US$ Million) Forecast by Country, 2018 to 2033

Table 14: Latin America Market Volume (Liters) Forecast by Country, 2018 to 2033

Table 15: Latin America Market Value (US$ Million) Forecast by Application, 2018 to 2033

Table 16: Latin America Market Volume (Liters) Forecast by Application, 2018 to 2033

Table 17: Latin America Market Value (US$ Million) Forecast by Type, 2018 to 2033

Table 18: Latin America Market Volume (Liters) Forecast by Type, 2018 to 2033

Table 19: Western Europe Market Value (US$ Million) Forecast by Country, 2018 to 2033

Table 20: Western Europe Market Volume (Liters) Forecast by Country, 2018 to 2033

Table 21: Western Europe Market Value (US$ Million) Forecast by Application, 2018 to 2033

Table 22: Western Europe Market Volume (Liters) Forecast by Application, 2018 to 2033

Table 23: Western Europe Market Value (US$ Million) Forecast by Type, 2018 to 2033

Table 24: Western Europe Market Volume (Liters) Forecast by Type, 2018 to 2033

Table 25: Eastern Europe Market Value (US$ Million) Forecast by Country, 2018 to 2033

Table 26: Eastern Europe Market Volume (Liters) Forecast by Country, 2018 to 2033

Table 27: Eastern Europe Market Value (US$ Million) Forecast by Application, 2018 to 2033

Table 28: Eastern Europe Market Volume (Liters) Forecast by Application, 2018 to 2033

Table 29: Eastern Europe Market Value (US$ Million) Forecast by Type, 2018 to 2033

Table 30: Eastern Europe Market Volume (Liters) Forecast by Type, 2018 to 2033

Table 31: South Asia and Pacific Market Value (US$ Million) Forecast by Country, 2018 to 2033

Table 32: South Asia and Pacific Market Volume (Liters) Forecast by Country, 2018 to 2033

Table 33: South Asia and Pacific Market Value (US$ Million) Forecast by Application, 2018 to 2033

Table 34: South Asia and Pacific Market Volume (Liters) Forecast by Application, 2018 to 2033

Table 35: South Asia and Pacific Market Value (US$ Million) Forecast by Type, 2018 to 2033

Table 36: South Asia and Pacific Market Volume (Liters) Forecast by Type, 2018 to 2033

Table 37: East Asia Market Value (US$ Million) Forecast by Country, 2018 to 2033

Table 38: East Asia Market Volume (Liters) Forecast by Country, 2018 to 2033

Table 39: East Asia Market Value (US$ Million) Forecast by Application, 2018 to 2033

Table 40: East Asia Market Volume (Liters) Forecast by Application, 2018 to 2033

Table 41: East Asia Market Value (US$ Million) Forecast by Type, 2018 to 2033

Table 42: East Asia Market Volume (Liters) Forecast by Type, 2018 to 2033

Table 43: Middle East and Africa Market Value (US$ Million) Forecast by Country, 2018 to 2033

Table 44: Middle East and Africa Market Volume (Liters) Forecast by Country, 2018 to 2033

Table 45: Middle East and Africa Market Value (US$ Million) Forecast by Application, 2018 to 2033

Table 46: Middle East and Africa Market Volume (Liters) Forecast by Application, 2018 to 2033

Table 47: Middle East and Africa Market Value (US$ Million) Forecast by Type, 2018 to 2033

Table 48: Middle East and Africa Market Volume (Liters) Forecast by Type, 2018 to 2033

List of Charts

Figure 1: Global Market Value (US$ Million) by Application, 2023 to 2033

Figure 2: Global Market Value (US$ Million) by Type, 2023 to 2033

Figure 3: Global Market Value (US$ Million) by Region, 2023 to 2033

Figure 4: Global Market Value (US$ Million) Analysis by Region, 2018 to 2033

Figure 5: Global Market Volume (Liters) Analysis by Region, 2018 to 2033

Figure 6: Global Market Value Share (%) and BPS Analysis by Region, 2023 to 2033

Figure 7: Global Market Y-o-Y Growth (%) Projections by Region, 2023 to 2033

Figure 8: Global Market Value (US$ Million) Analysis by Application, 2018 to 2033

Figure 9: Global Market Volume (Liters) Analysis by Application, 2018 to 2033

Figure 10: Global Market Value Share (%) and BPS Analysis by Application, 2023 to 2033

Figure 11: Global Market Y-o-Y Growth (%) Projections by Application, 2023 to 2033

Figure 12: Global Market Value (US$ Million) Analysis by Type, 2018 to 2033

Figure 13: Global Market Volume (Liters) Analysis by Type, 2018 to 2033

Figure 14: Global Market Value Share (%) and BPS Analysis by Type, 2023 to 2033

Figure 15: Global Market Y-o-Y Growth (%) Projections by Type, 2023 to 2033

Figure 16: Global Market Attractiveness by Application, 2023 to 2033

Figure 17: Global Market Attractiveness by Type, 2023 to 2033

Figure 18: Global Market Attractiveness by Region, 2023 to 2033

Figure 19: North America Market Value (US$ Million) by Application, 2023 to 2033

Figure 20: North America Market Value (US$ Million) by Type, 2023 to 2033

Figure 21: North America Market Value (US$ Million) by Country, 2023 to 2033

Figure 22: North America Market Value (US$ Million) Analysis by Country, 2018 to 2033

Figure 23: North America Market Volume (Liters) Analysis by Country, 2018 to 2033

Figure 24: North America Market Value Share (%) and BPS Analysis by Country, 2023 to 2033

Figure 25: North America Market Y-o-Y Growth (%) Projections by Country, 2023 to 2033

Figure 26: North America Market Value (US$ Million) Analysis by Application, 2018 to 2033

Figure 27: North America Market Volume (Liters) Analysis by Application, 2018 to 2033

Figure 28: North America Market Value Share (%) and BPS Analysis by Application, 2023 to 2033

Figure 29: North America Market Y-o-Y Growth (%) Projections by Application, 2023 to 2033

Figure 30: North America Market Value (US$ Million) Analysis by Type, 2018 to 2033

Figure 31: North America Market Volume (Liters) Analysis by Type, 2018 to 2033

Figure 32: North America Market Value Share (%) and BPS Analysis by Type, 2023 to 2033

Figure 33: North America Market Y-o-Y Growth (%) Projections by Type, 2023 to 2033

Figure 34: North America Market Attractiveness by Application, 2023 to 2033

Figure 35: North America Market Attractiveness by Type, 2023 to 2033

Figure 36: North America Market Attractiveness by Country, 2023 to 2033

Figure 37: Latin America Market Value (US$ Million) by Application, 2023 to 2033

Figure 38: Latin America Market Value (US$ Million) by Type, 2023 to 2033

Figure 39: Latin America Market Value (US$ Million) by Country, 2023 to 2033

Figure 40: Latin America Market Value (US$ Million) Analysis by Country, 2018 to 2033

Figure 41: Latin America Market Volume (Liters) Analysis by Country, 2018 to 2033

Figure 42: Latin America Market Value Share (%) and BPS Analysis by Country, 2023 to 2033

Figure 43: Latin America Market Y-o-Y Growth (%) Projections by Country, 2023 to 2033

Figure 44: Latin America Market Value (US$ Million) Analysis by Application, 2018 to 2033

Figure 45: Latin America Market Volume (Liters) Analysis by Application, 2018 to 2033

Figure 46: Latin America Market Value Share (%) and BPS Analysis by Application, 2023 to 2033

Figure 47: Latin America Market Y-o-Y Growth (%) Projections by Application, 2023 to 2033

Figure 48: Latin America Market Value (US$ Million) Analysis by Type, 2018 to 2033

Figure 49: Latin America Market Volume (Liters) Analysis by Type, 2018 to 2033

Figure 50: Latin America Market Value Share (%) and BPS Analysis by Type, 2023 to 2033

Figure 51: Latin America Market Y-o-Y Growth (%) Projections by Type, 2023 to 2033

Figure 52: Latin America Market Attractiveness by Application, 2023 to 2033

Figure 53: Latin America Market Attractiveness by Type, 2023 to 2033

Figure 54: Latin America Market Attractiveness by Country, 2023 to 2033

Figure 55: Western Europe Market Value (US$ Million) by Application, 2023 to 2033

Figure 56: Western Europe Market Value (US$ Million) by Type, 2023 to 2033

Figure 57: Western Europe Market Value (US$ Million) by Country, 2023 to 2033

Figure 58: Western Europe Market Value (US$ Million) Analysis by Country, 2018 to 2033

Figure 59: Western Europe Market Volume (Liters) Analysis by Country, 2018 to 2033

Figure 60: Western Europe Market Value Share (%) and BPS Analysis by Country, 2023 to 2033

Figure 61: Western Europe Market Y-o-Y Growth (%) Projections by Country, 2023 to 2033

Figure 62: Western Europe Market Value (US$ Million) Analysis by Application, 2018 to 2033

Figure 63: Western Europe Market Volume (Liters) Analysis by Application, 2018 to 2033

Figure 64: Western Europe Market Value Share (%) and BPS Analysis by Application, 2023 to 2033

Figure 65: Western Europe Market Y-o-Y Growth (%) Projections by Application, 2023 to 2033

Figure 66: Western Europe Market Value (US$ Million) Analysis by Type, 2018 to 2033

Figure 67: Western Europe Market Volume (Liters) Analysis by Type, 2018 to 2033

Figure 68: Western Europe Market Value Share (%) and BPS Analysis by Type, 2023 to 2033

Figure 69: Western Europe Market Y-o-Y Growth (%) Projections by Type, 2023 to 2033

Figure 70: Western Europe Market Attractiveness by Application, 2023 to 2033

Figure 71: Western Europe Market Attractiveness by Type, 2023 to 2033

Figure 72: Western Europe Market Attractiveness by Country, 2023 to 2033

Figure 73: Eastern Europe Market Value (US$ Million) by Application, 2023 to 2033

Figure 74: Eastern Europe Market Value (US$ Million) by Type, 2023 to 2033

Figure 75: Eastern Europe Market Value (US$ Million) by Country, 2023 to 2033

Figure 76: Eastern Europe Market Value (US$ Million) Analysis by Country, 2018 to 2033

Figure 77: Eastern Europe Market Volume (Liters) Analysis by Country, 2018 to 2033

Figure 78: Eastern Europe Market Value Share (%) and BPS Analysis by Country, 2023 to 2033

Figure 79: Eastern Europe Market Y-o-Y Growth (%) Projections by Country, 2023 to 2033

Figure 80: Eastern Europe Market Value (US$ Million) Analysis by Application, 2018 to 2033

Figure 81: Eastern Europe Market Volume (Liters) Analysis by Application, 2018 to 2033

Figure 82: Eastern Europe Market Value Share (%) and BPS Analysis by Application, 2023 to 2033

Figure 83: Eastern Europe Market Y-o-Y Growth (%) Projections by Application, 2023 to 2033

Figure 84: Eastern Europe Market Value (US$ Million) Analysis by Type, 2018 to 2033

Figure 85: Eastern Europe Market Volume (Liters) Analysis by Type, 2018 to 2033

Figure 86: Eastern Europe Market Value Share (%) and BPS Analysis by Type, 2023 to 2033

Figure 87: Eastern Europe Market Y-o-Y Growth (%) Projections by Type, 2023 to 2033

Figure 88: Eastern Europe Market Attractiveness by Application, 2023 to 2033

Figure 89: Eastern Europe Market Attractiveness by Type, 2023 to 2033

Figure 90: Eastern Europe Market Attractiveness by Country, 2023 to 2033

Figure 91: South Asia and Pacific Market Value (US$ Million) by Application, 2023 to 2033

Figure 92: South Asia and Pacific Market Value (US$ Million) by Type, 2023 to 2033

Figure 93: South Asia and Pacific Market Value (US$ Million) by Country, 2023 to 2033

Figure 94: South Asia and Pacific Market Value (US$ Million) Analysis by Country, 2018 to 2033

Figure 95: South Asia and Pacific Market Volume (Liters) Analysis by Country, 2018 to 2033

Figure 96: South Asia and Pacific Market Value Share (%) and BPS Analysis by Country, 2023 to 2033

Figure 97: South Asia and Pacific Market Y-o-Y Growth (%) Projections by Country, 2023 to 2033

Figure 98: South Asia and Pacific Market Value (US$ Million) Analysis by Application, 2018 to 2033

Figure 99: South Asia and Pacific Market Volume (Liters) Analysis by Application, 2018 to 2033

Figure 100: South Asia and Pacific Market Value Share (%) and BPS Analysis by Application, 2023 to 2033

Figure 101: South Asia and Pacific Market Y-o-Y Growth (%) Projections by Application, 2023 to 2033

Figure 102: South Asia and Pacific Market Value (US$ Million) Analysis by Type, 2018 to 2033

Figure 103: South Asia and Pacific Market Volume (Liters) Analysis by Type, 2018 to 2033

Figure 104: South Asia and Pacific Market Value Share (%) and BPS Analysis by Type, 2023 to 2033

Figure 105: South Asia and Pacific Market Y-o-Y Growth (%) Projections by Type, 2023 to 2033

Figure 106: South Asia and Pacific Market Attractiveness by Application, 2023 to 2033

Figure 107: South Asia and Pacific Market Attractiveness by Type, 2023 to 2033

Figure 108: South Asia and Pacific Market Attractiveness by Country, 2023 to 2033

Figure 109: East Asia Market Value (US$ Million) by Application, 2023 to 2033

Figure 110: East Asia Market Value (US$ Million) by Type, 2023 to 2033

Figure 111: East Asia Market Value (US$ Million) by Country, 2023 to 2033

Figure 112: East Asia Market Value (US$ Million) Analysis by Country, 2018 to 2033

Figure 113: East Asia Market Volume (Liters) Analysis by Country, 2018 to 2033

Figure 114: East Asia Market Value Share (%) and BPS Analysis by Country, 2023 to 2033

Figure 115: East Asia Market Y-o-Y Growth (%) Projections by Country, 2023 to 2033

Figure 116: East Asia Market Value (US$ Million) Analysis by Application, 2018 to 2033

Figure 117: East Asia Market Volume (Liters) Analysis by Application, 2018 to 2033

Figure 118: East Asia Market Value Share (%) and BPS Analysis by Application, 2023 to 2033

Figure 119: East Asia Market Y-o-Y Growth (%) Projections by Application, 2023 to 2033

Figure 120: East Asia Market Value (US$ Million) Analysis by Type, 2018 to 2033

Figure 121: East Asia Market Volume (Liters) Analysis by Type, 2018 to 2033

Figure 122: East Asia Market Value Share (%) and BPS Analysis by Type, 2023 to 2033

Figure 123: East Asia Market Y-o-Y Growth (%) Projections by Type, 2023 to 2033

Figure 124: East Asia Market Attractiveness by Application, 2023 to 2033

Figure 125: East Asia Market Attractiveness by Type, 2023 to 2033

Figure 126: East Asia Market Attractiveness by Country, 2023 to 2033

Figure 127: Middle East and Africa Market Value (US$ Million) by Application, 2023 to 2033

Figure 128: Middle East and Africa Market Value (US$ Million) by Type, 2023 to 2033

Figure 129: Middle East and Africa Market Value (US$ Million) by Country, 2023 to 2033

Figure 130: Middle East and Africa Market Value (US$ Million) Analysis by Country, 2018 to 2033

Figure 131: Middle East and Africa Market Volume (Liters) Analysis by Country, 2018 to 2033

Figure 132: Middle East and Africa Market Value Share (%) and BPS Analysis by Country, 2023 to 2033

Figure 133: Middle East and Africa Market Y-o-Y Growth (%) Projections by Country, 2023 to 2033

Figure 134: Middle East and Africa Market Value (US$ Million) Analysis by Application, 2018 to 2033

Figure 135: Middle East and Africa Market Volume (Liters) Analysis by Application, 2018 to 2033

Figure 136: Middle East and Africa Market Value Share (%) and BPS Analysis by Application, 2023 to 2033

Figure 137: Middle East and Africa Market Y-o-Y Growth (%) Projections by Application, 2023 to 2033

Figure 138: Middle East and Africa Market Value (US$ Million) Analysis by Type, 2018 to 2033

Figure 139: Middle East and Africa Market Volume (Liters) Analysis by Type, 2018 to 2033

Figure 140: Middle East and Africa Market Value Share (%) and BPS Analysis by Type, 2023 to 2033

Figure 141: Middle East and Africa Market Y-o-Y Growth (%) Projections by Type, 2023 to 2033

Figure 142: Middle East and Africa Market Attractiveness by Application, 2023 to 2033

Figure 143: Middle East and Africa Market Attractiveness by Type, 2023 to 2033

Figure 144: Middle East and Africa Market Attractiveness by Country, 2023 to 2033

Recommendations

Packaging

Alcohol Packaging Market

Published : April 2024

Food and Beverage

Alcohol Ingredients Market

Published : October 2022

Explore Food and Beverage Insights

View Reports