Acetonitrile Market Size and Share Forecast Outlook 2025 to 2035

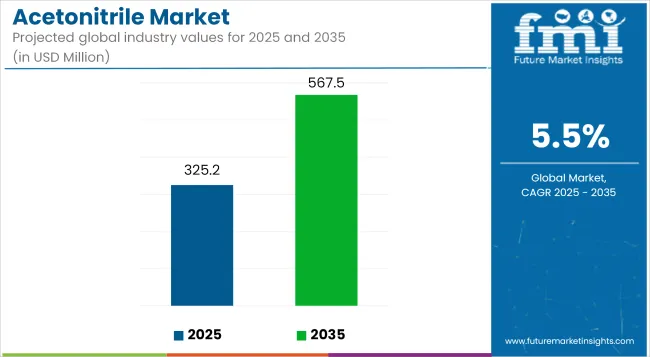
The global acetonitrile market is estimated to reach USD 325.2 million in 2025 and expand to USD 567.5 million by 2035, registering a CAGR of 5.5% during the forecast period. Growth is being driven by consistent demand from pharmaceutical, agrochemical, analytical, and energy storage industries.
Quick Stats for Acetonitrile Market

  • Industry Value (2025): USD 325.2 million
  • Forecast Value (2035): USD 567.5 million
  • Forecast CAGR: 5.5%
  • Leading Segment in 2025: Pharmaceutical (62% share)
  • Key Growth Region: Asia-Pacific and North America
  • Top Key Players: INEOS AG, Asahi Kasei Corporation, Avantor, Inc., Formosa Plastics Corporation, Tedia Company, Inc.

Acetonitrile Market Industry Value Analysis

Metric Value
Industry Size (2025E) USD 325.2 million
Industry Value (2035F) USD 567.5 million
CAGR (2025 to 2035) 5.5%

Acetonitrile is being widely utilized as a polar aprotic solvent due to its high solvency power, low viscosity, and chemical stability. Its use in high-performance liquid chromatography (HPLC) is supporting extensive pharmaceutical research and drug quality testing. As drug synthesis, formulation, and regulatory testing increase globally, the consumption of HPLC-grade solvents such as acetonitrile is being accelerated.

In the pharmaceutical sector, acetonitrile is being applied during the manufacture of Active Pharmaceutical Ingredients (APIs) and intermediates. Its compatibility with advanced analytical techniques and bioassay systems is reinforcing its position as a preferred solvent in pharmaceutical laboratories and manufacturing facilities.

In agrochemical production, acetonitrile is being incorporated into pesticide and herbicide formulation processes. The compound is playing a role in purification and crystallization during downstream processing. With rising agricultural output targets and increasing regulatory focus on precise formulation quality, demand for high-purity solvents is increasing across agrochemical manufacturing hubs.

In the electronics sector, acetonitrile is being adopted in lithium-ion battery production. It is serving as a solvent component in electrolyte formulations, where its dielectric properties and low moisture content contribute to improved battery performance. The expansion of electric vehicle manufacturing and grid-scale energy storage systems is contributing to higher usage of battery-grade acetonitrile.

Production innovations are focusing on reducing environmental impact by developing bio-based routes to acetonitrile and implementing sustainable solvent recovery systems. Emerging green chemistry protocols are influencing procurement and refining processes in response to global chemical safety directives.
Analyzing Acetonitrile Market by Top Investment Segments

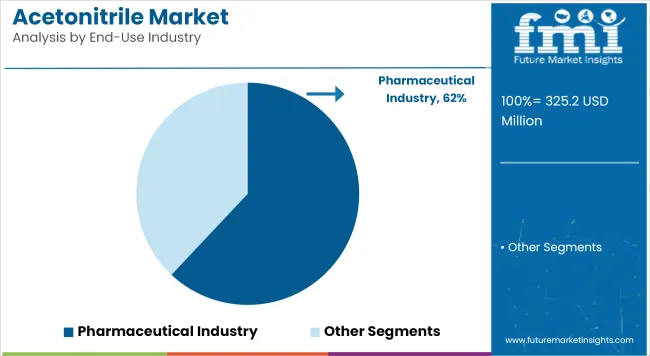
Pharmaceutical industry is projected to dominate end-use demand due to acetonitrile’s essential role as a solvent in drug synthesis and purification

Acetonitrile Market Analysis By End Use Industry

The pharmaceutical segment is estimated to account for approximately 62% of the global acetonitrile market share in 2025 and is projected to grow at a CAGR of 5.6% through 2035. Acetonitrile is widely used in the production of active pharmaceutical ingredients (APIs), serving as a critical solvent for reaction processes, crystallization, and HPLC analysis.

Its low viscosity, high elution strength, and miscibility with water and organic solvents make it indispensable in pharmaceutical purification and separation. As global drug production scales up-especially for generic drugs, oncology treatments, and vaccines-demand for high-purity acetonitrile is growing across manufacturing hubs in Asia-Pacific and North America. Manufacturers are also expanding capacity to meet rising requirements for cGMP-compliant solvents in regulated markets.
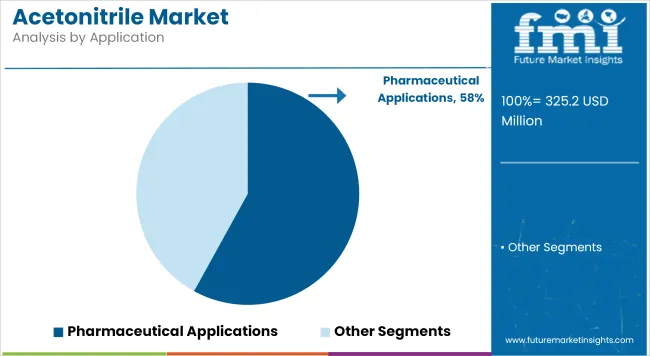
Pharmaceutical applications are expected to lead by volume and value due to consistent solvent demand across synthesis and chromatographic techniques

Acetonitrile Market Analysis By Application

Pharmaceutical applications are projected to hold approximately 58% of the global acetonitrile market share in 2025 and are expected to grow at a CAGR of 5.7% through 2035. Acetonitrile is used throughout drug discovery, formulation development, and quality control processes, particularly in high-performance liquid chromatography (HPLC) systems.

Its ability to dissolve a wide range of compounds and deliver precise analytical performance supports its extensive use in pharmaceutical laboratories and quality assurance programs. In addition to large-scale synthesis, acetonitrile plays a central role in clinical trial material validation and bioanalytical assays. With increasing regulatory scrutiny on solvent residues and analytical accuracy, demand for pharmaceutical-grade acetonitrile continues to rise in tandem with global drug development activity.

Challenges

Raw Material Availability & Price Volatility

Acetonitrile is made as the by-product of acrylonitrile production, which makes the availability of acetonitrile directly dependent on the market for acrylonitrile. Thus, fluctuations in production capacity and feedstock availability have caused supply crunch and price fluctuation. Furthermore, geopolitical issues, residual trade restrictions, and supply chain disruptions have also impacted uninterrupted availability of acetonitrile for end-use industries.

Environmental & Safety Regulations

Greater regulatory pressure on the chemical industry to reduce solvent emissions and implement green practices. As a VOC you have to treat acetonitrile and it has to be treated and the environment is sucked out of the regulations. Compliance to emission control and above all, the development of Alternative Solvents are the issues burning question for the market players.

Health & Safety Risks

Acetonitrile is also toxic and flammable, posing an acute health & safety risk. This drives additional safety measure need and operational, cost to industrials and end-users. Stricter workplace safety standards also could further restrict acetonitrile use in some applications and boost demand for safer substitutes.

Opportunities

Rising Demand from Pharmaceutical & Biotechnology Industries

Acetonitrile is primarily consumed by the pharmaceutical industry, especially as a solvent in high-performance liquid chromatography (HPLC), drug formulation, and drug synthesis. Growing investments in drug discovery, biopharmaceuticals, and clinical research is likely to sustain the demand for high-purity acetonitrile. The increase of biotech hubs and government backing for pharmaceutical R&D will further accelerate the market.

Expansion of Lithium-Ion Battery & Semiconductor Applications

The shift toward electric vehicles and renewable energy has driven exponential demand for lithium-ion batteries. One such important solvent, acetonitrile, permits the enhancement of electrolyte and battery technology. Acetonitrile is one of the leading candidates, because it features in both the chemical plant and the pharmaceutical factories (the electronics industry uses ultra-pure acetonitrile to clean and etch processes) and is also a front-line next-generation electronics.

Development of Sustainable & Bio-Based Alternatives

Acetonitrile producers come up under mounting regulator and brand pressure to lower their environmental footprint, driving a trend towards bio-based & sustainable production routes for this unique chemical platform.

Green approaches (e.g. how to use new solvents) are emerging and can encourage reporting of less toxic and/or environmentally friendly acetonitriles (or derivatives) with relatively less environmental footprint. Companies investing in sustainable production processes are likely to gain a competitive edge in the evolving market landscape.
Country Wise Insights

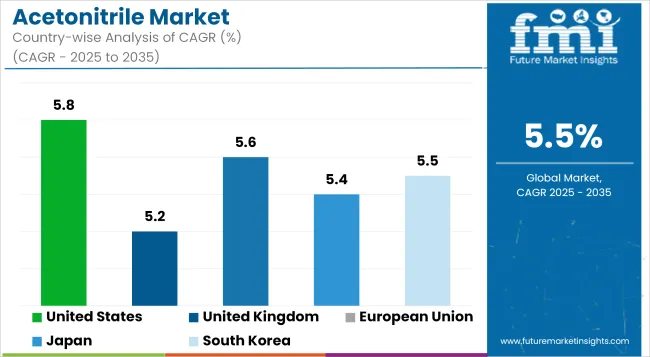
Acetonitrile Market Cagr Analysis By Country

United States

Furthermore, the acetonitrile market in the United States is growing because of the booming pharmaceutical and biotechnology sector, that are some end-users of high-purity acetonitrile. Market growth is primarily driven by the increasing demand by the analytical-grade solvent for high-performance liquid chromatography (HPLC) and DNA synthesis purposes.

Furthermore, demand is also being driven by improvements in agrochemicals and chemical synthesis processes. The strong market growth can be attributed to the large number of established chemical manufacturers and strict regulatory frameworks governing solvent purity and environmental safety. Further growth will be fueled by increased R&D spending in synthetic chemistry and biopharmaceuticals. Increasing R&D in synthetic chemistry and biopharmaceuticals will continue to support growth in the coming years.

  • Expansion in Pharmaceutical & Biotech Industries: High demand for HPLC solvents and synthesis intermediates.
  • Growth in Agrochemical Production: Increased use of acetonitrile in pesticide formulation.
  • Advancements in Chemical Synthesis: Growing applications in organic synthesis and specialty chemicals.
  • Stringent Regulatory Compliance: Focus towards high-purity and environmentally safe solvents.
  • R&D in Biotechnology & Genomics: Increasing use of acetonitrile in DNA and protein analysis.
Country CAGR (2025 to 2035)
United States 5.8%

United Kingdom

The acetonitrile market in the UK is also growing and is mostly attributed to the growing use of acetonitrile in pharmaceuticals and chemicals in the country. A growing emphasis on analytical applications - chromatography, for instance, as well as spectroscopy - is also helping drive demand for high-purity acetonitrile.

Moreover, government policies favoring sustainable chemical production and strict regulatory guidelines on solvent safety are contributing to market trends. The green chemistry and bio-based solvents movement is also driving development of acetonitrile recycling and recovery technologies. The UK market is set for steady growth in light of ongoing investments into pharmaceutical R&D, and biotechnological breakthroughs.

  • Rise in Pharmaceutical Research & Development: Growing need for Solvent Applications in Drug Synthesis
  • Expansion of Analytical Chemistry Applications: Increase of analytical chemistry in chromatography and laboratories reagents.
  • Regulatory Focus on Sustainable Solvent Use: Emphasis on environmentally friendly production.
  • Advancements in Agrochemical Sector: Higher acetonitrile demand in pesticide production.
  • Growth in Specialty Chemical Manufacturing: Increased demand for solvents in high-value synthesis of chemicals.
Country CAGR (2025 to 2035)
United Kingdom 5.2%

European Union

The acetonitrile market in the European Union (EU) is increasing on account of the [Pharmaceutical, Childcare and Research factors in the region. Under REACH (Registration, Evaluation, Authorization, and Restriction of Chemicals) regulatory policies, laboratory and industrial applications of high-purity acetonitrile are increasing.

Demand for analytical-grade solvents is also increasing in clinical research, biotechnology and environmental testing. In addition, investments in green chemistry and sustainable solvent recovery technologies are shaping the market trends. Because Europe remains at the forefront of precision medicine and novel drug formulations, the demand for high-performance acetonitrile is anticipated to see healthy growth.

  • Strict Chemical Regulations (REACH Compliance): Promoting the usage of high purity solvents.
  • Growth in Biotechnology & Life Sciences: Applications are rapidly growing in drug discovery & diagnostics.
  • Advancements in Sustainable Solvent Technologies: Development of eco-friendly acetonitrile recovery methods.
  • Expansion in Agrochemical & Pesticide Production: Rising demand in specialty formulations.
  • High Demand in Analytical & Industrial Chemistry: Very high use in chromatography and polymer synthesis.
Region CAGR (2025 to 2035)
European Union 5.6%

Japan

Japan is the leading acetonitrile market in Asia followed by China, India, and other countries. Market growth is being driven by rising demand for ultra-high-purity acetonitrile used in precision medicine as well as semiconductor processing and specialty chemicals. Japan’s strong R&D and innovation in green chemistry is, moreover, driving the development of sustainable solvent alternatives.

Acetonitrile of high purity is highly consumed in Japan with a strong focus on quality control and high-performance analytical applications for laboratory and industrial use. Tools like AI for drug development or the emergence of advanced materials science will further help the market in the country to grow.

  • Expansion in Precision Pharmaceuticals: High demand for solvent applications in drug formulation.
  • Advancements in Semiconductor & Electronics Industry: Application used throughout the cleaning and etching processes.
  • Investment in Green Chemistry Initiatives: Investments in green chemistry initiatives, including sustainable solvent recovery.
  • Growth in Analytical & Clinical Research: Rise in acetonitrile usage in laboratory testing.
  • Focus on High-Purity Chemical Applications: Increasing market for ultra-red acetonitrile.
Country CAGR (2025 to 2035)
Japan 5.4%

South Korea

Acetonitrile market in South Korea is expanding rapidly, primarily driven by its pharmaceutical, chemical, and electronics sectors. High-purity acetonitrile demand is also being propelled by the country’s focus on high-tech manufacturing and R&D-based chemical innovations.

Analytical and industrial demand for solvents is also rising as South Korea’s biopharmaceutical and semiconductor production growth continues to gather pace. Another factor that influences market dynamics is government support for sustainable chemical processing and investment in green solvent technologies. With periodic developments in biotechnology, high and fine materials, and special chemicals, South Korea is forecasted to show steady acetonitrile market growth.

  • Booming Biopharmaceutical & Chemical Sectors: Rising demand for high-purity solvents.
  • Strong Semiconductor & Electronics Industry: Growth in solvent uses for cleaning and etching.
  • Government Support for Sustainable Chemical Production: Policies promoting towards green chemistry initiatives.
  • Growth in Analytical Testing & Chromatography Applications: Increased alarms from laboratory research.
  • Expansion in Pesticide & Specialty Chemicals Manufacturing: Growing acetonitrile usage in formulations.
Country CAGR (2025 to 2035)
South Korea 5.5%

Competition Outlook

The acetonitrile market is competitive, with key players focusing on improving production processes to meet the increasing demand from industries such as pharmaceuticals, agribusiness, and electronics. As the demand for acetonitrile grows, especially in the production of active pharmaceutical ingredients and analytical applications, manufacturers are investing in more efficient, cost-effective production methods. With rising environmental concerns, companies are also exploring greener alternatives and sustainable production practices to minimize the environmental footprint of acetonitrile production.

  • In April 2024, INEOS Nitriles was reported to have commenced commercial sales of its bio-based acetonitrile, marking a world-first for pharmaceutical-grade applications. The product was developed using renewable raw materials and was stated to offer a 90% reduction in carbon footprint compared to conventionally produced acetonitrile. It was targeted at pharmaceutical and life sciences industries where acetonitrile is used as a key solvent in drug synthesis and analytical applications.

Key Players

  • INEOS AG
  • Asahi Kasei Corporation
  • Formosa Plastics Corporation
  • Imperial Chemical Corporation
  • Nova Molecular Technologies, Inc.
  • Tedia Company, Inc.
  • Avantor, Inc.
  • Shanghai SECCO Petrochemical Co., Ltd.
  • Nantong Acetic Acid Chemical Co., Ltd.
  • The Taekwang Group

Acetonitrile Market Segmentation

By End-Use Industry:

  • Pharmaceutical Industry
  • Analytical Industry

By Application:

  • Pharmaceutical Applications
  • Organic Synthesis
  • Specialty Chemicals
  • Extraction

By Region:

  • North America
  • Latin America
  • Western Europe
  • South Asia
  • East Asia
  • Eastern Europe
  • Middle East & Africa

Table of Content

  1. Executive Summary
  2. Industry Introduction, including Taxonomy and Market Definition
  3. Market Trends and Success Factors, including Macro-economic Factors, Market Dynamics, and Recent Industry Developments
  4. Global Market Demand Analysis 2020 to 2024 and Forecast 2025 to 2035, including Historical Analysis and Future Projections
  5. Pricing Analysis
  6. Global Market Analysis 2020 to 2024 and Forecast 2025 to 2035
    • Product Type
    • Application
  7. Global Market Analysis 2020 to 2024 and Forecast 2025 to 2035, By Product Type
    • Industrial Grade
    • High Purity Grade
  8. Global Market Analysis 2020 to 2024 and Forecast 2025 to 2035, By Application
    • Pharmaceutical
    • Organic Synthesis
    • Specialty Chemicals
    • Extraction
    • HPLC Solvents
    • DNA & RNA Synthesis
  9. Global Market Analysis 2020 to 2024 and Forecast 2025 to 2035, By Region
    • North America
    • Latin America
    • Western Europe
    • South Asia
    • East Asia
    • Eastern Europe
    • Middle East & Africa
  10. North America Sales Analysis 2020 to 2024 and Forecast 2025 to 2035, by Key Segments and Countries
  11. Latin America Sales Analysis 2020 to 2024 and Forecast 2025 to 2035, by Key Segments and Countries
  12. Western Europe Sales Analysis 2020 to 2024 and Forecast 2025 to 2035, by Key Segments and Countries
  13. South Asia Sales Analysis 2020 to 2024 and Forecast 2025 to 2035, by Key Segments and Countries
  14. East Asia Sales Analysis 2020 to 2024 and Forecast 2025 to 2035, by Key Segments and Countries
  15. Eastern Europe Sales Analysis 2020 to 2024 and Forecast 2025 to 2035, by Key Segments and Countries
  16. Middle East & Africa Sales Analysis 2020 to 2024 and Forecast 2025 to 2035, by Key Segments and Countries
  17. Sales Forecast 2025 to 2035 by Product Type and Application for 30 Countries
  18. Competition Outlook, including Market Structure Analysis, Company Share Analysis by Key Players, and Competition Dashboard
  19. Company Profile
    • INEOS AG
    • Asahi Kasei Corporation
    • Formosa Plastics Corporation
    • Imperial Chemical Corporation
    • Nova Molecular Technologies, Inc.
    • Tedia Company, Inc.
    • Avantor, Inc.
    • Shanghai SECCO Petrochemical Co. Ltd.
    • Nantong Acetic Acid Chemical Co., Ltd.
    • The Taekwang Group

List of Tables

  • Table 1: Global Market Value (USD Million) Forecast by Region, 2020 to 2035
  • Table 2: Global Market Volume (Tons) Forecast by Region, 2020 to 2035
  • Table 3: Global Market Value (USD Million) Forecast by End Use Industry, 2020 to 2035
  • Table 4: Global Market Volume (Tons) Forecast by End Use Industry, 2020 to 2035
  • Table 5: Global Market Value (USD Million) Forecast by Application, 2020 to 2035
  • Table 6: Global Market Volume (Tons) Forecast by Application, 2020 to 2035
  • Table 7: North America Market Value (USD Million) Forecast by Country, 2020 to 2035
  • Table 8: North America Market Volume (Tons) Forecast by Country, 2020 to 2035
  • Table 9: North America Market Value (USD Million) Forecast by End Use Industry, 2020 to 2035
  • Table 10: North America Market Volume (Tons) Forecast by End Use Industry, 2020 to 2035
  • Table 11: North America Market Value (USD Million) Forecast by Application, 2020 to 2035
  • Table 12: North America Market Volume (Tons) Forecast by Application, 2020 to 2035
  • Table 13: Latin America Market Value (USD Million) Forecast by Country, 2020 to 2035
  • Table 14: Latin America Market Volume (Tons) Forecast by Country, 2020 to 2035
  • Table 15: Latin America Market Value (USD Million) Forecast by End Use Industry, 2020 to 2035
  • Table 16: Latin America Market Volume (Tons) Forecast by End Use Industry, 2020 to 2035
  • Table 17: Latin America Market Value (USD Million) Forecast by Application, 2020 to 2035
  • Table 18: Latin America Market Volume (Tons) Forecast by Application, 2020 to 2035
  • Table 19: Western Europe Market Value (USD Million) Forecast by Country, 2020 to 2035
  • Table 20: Western Europe Market Volume (Tons) Forecast by Country, 2020 to 2035
  • Table 21: Western Europe Market Value (USD Million) Forecast by End Use Industry, 2020 to 2035
  • Table 22: Western Europe Market Volume (Tons) Forecast by End Use Industry, 2020 to 2035
  • Table 23: Western Europe Market Value (USD Million) Forecast by Application, 2020 to 2035
  • Table 24: Western Europe Market Volume (Tons) Forecast by Application, 2020 to 2035
  • Table 25: Eastern Europe Market Value (USD Million) Forecast by Country, 2020 to 2035
  • Table 26: Eastern Europe Market Volume (Tons) Forecast by Country, 2020 to 2035
  • Table 27: Eastern Europe Market Value (USD Million) Forecast by End Use Industry, 2020 to 2035
  • Table 28: Eastern Europe Market Volume (Tons) Forecast by End Use Industry, 2020 to 2035
  • Table 29: Eastern Europe Market Value (USD Million) Forecast by Application, 2020 to 2035
  • Table 30: Eastern Europe Market Volume (Tons) Forecast by Application, 2020 to 2035
  • Table 31: South Asia and Pacific Market Value (USD Million) Forecast by Country, 2020 to 2035
  • Table 32: South Asia and Pacific Market Volume (Tons) Forecast by Country, 2020 to 2035
  • Table 33: South Asia and Pacific Market Value (USD Million) Forecast by End Use Industry, 2020 to 2035
  • Table 34: South Asia and Pacific Market Volume (Tons) Forecast by End Use Industry, 2020 to 2035
  • Table 35: South Asia and Pacific Market Value (USD Million) Forecast by Application, 2020 to 2035
  • Table 36: South Asia and Pacific Market Volume (Tons) Forecast by Application, 2020 to 2035
  • Table 37: East Asia Market Value (USD Million) Forecast by Country, 2020 to 2035
  • Table 38: East Asia Market Volume (Tons) Forecast by Country, 2020 to 2035
  • Table 39: East Asia Market Value (USD Million) Forecast by End Use Industry, 2020 to 2035
  • Table 40: East Asia Market Volume (Tons) Forecast by End Use Industry, 2020 to 2035
  • Table 41: East Asia Market Value (USD Million) Forecast by Application, 2020 to 2035
  • Table 42: East Asia Market Volume (Tons) Forecast by Application, 2020 to 2035
  • Table 43: Middle East and Africa Market Value (USD Million) Forecast by Country, 2020 to 2035
  • Table 44: Middle East and Africa Market Volume (Tons) Forecast by Country, 2020 to 2035
  • Table 45: Middle East and Africa Market Value (USD Million) Forecast by End Use Industry, 2020 to 2035
  • Table 46: Middle East and Africa Market Volume (Tons) Forecast by End Use Industry, 2020 to 2035
  • Table 47: Middle East and Africa Market Value (USD Million) Forecast by Application, 2020 to 2035
  • Table 48: Middle East and Africa Market Volume (Tons) Forecast by Application, 2020 to 2035

List of Figures

  • Figure 1: Global Market Value (USD Million) by End Use Industry, 2025 to 2035
  • Figure 2: Global Market Value (USD Million) by Application, 2025 to 2035
  • Figure 3: Global Market Value (USD Million) by Region, 2025 to 2035
  • Figure 4: Global Market Value (USD Million) Analysis by Region, 2020 to 2035
  • Figure 5: Global Market Volume (Tons) Analysis by Region, 2020 to 2035
  • Figure 6: Global Market Value Share (%) and BPS Analysis by Region, 2025 to 2035
  • Figure 7: Global Market Y-o-Y Growth (%) Projections by Region, 2025 to 2035
  • Figure 8: Global Market Value (USD Million) Analysis by End Use Industry, 2020 to 2035
  • Figure 9: Global Market Volume (Tons) Analysis by End Use Industry, 2020 to 2035
  • Figure 10: Global Market Value Share (%) and BPS Analysis by End Use Industry, 2025 to 2035
  • Figure 11: Global Market Y-o-Y Growth (%) Projections by End Use Industry, 2025 to 2035
  • Figure 12: Global Market Value (USD Million) Analysis by Application, 2020 to 2035
  • Figure 13: Global Market Volume (Tons) Analysis by Application, 2020 to 2035
  • Figure 14: Global Market Value Share (%) and BPS Analysis by Application, 2025 to 2035
  • Figure 15: Global Market Y-o-Y Growth (%) Projections by Application, 2025 to 2035
  • Figure 16: Global Market Attractiveness by End Use Industry, 2025 to 2035
  • Figure 17: Global Market Attractiveness by Application, 2025 to 2035
  • Figure 18: Global Market Attractiveness by Region, 2025 to 2035
  • Figure 19: North America Market Value (USD Million) by End Use Industry, 2025 to 2035
  • Figure 20: North America Market Value (USD Million) by Application, 2025 to 2035
  • Figure 21: North America Market Value (USD Million) by Country, 2025 to 2035
  • Figure 22: North America Market Value (USD Million) Analysis by Country, 2020 to 2035
  • Figure 23: North America Market Volume (Tons) Analysis by Country, 2020 to 2035
  • Figure 24: North America Market Value Share (%) and BPS Analysis by Country, 2025 to 2035
  • Figure 25: North America Market Y-o-Y Growth (%) Projections by Country, 2025 to 2035
  • Figure 26: North America Market Value (USD Million) Analysis by End Use Industry, 2020 to 2035
  • Figure 27: North America Market Volume (Tons) Analysis by End Use Industry, 2020 to 2035
  • Figure 28: North America Market Value Share (%) and BPS Analysis by End Use Industry, 2025 to 2035
  • Figure 29: North America Market Y-o-Y Growth (%) Projections by End Use Industry, 2025 to 2035
  • Figure 30: North America Market Value (USD Million) Analysis by Application, 2020 to 2035
  • Figure 31: North America Market Volume (Tons) Analysis by Application, 2020 to 2035
  • Figure 32: North America Market Value Share (%) and BPS Analysis by Application, 2025 to 2035
  • Figure 33: North America Market Y-o-Y Growth (%) Projections by Application, 2025 to 2035
  • Figure 34: North America Market Attractiveness by End Use Industry, 2025 to 2035
  • Figure 35: North America Market Attractiveness by Application, 2025 to 2035
  • Figure 36: North America Market Attractiveness by Country, 2025 to 2035
  • Figure 37: Latin America Market Value (USD Million) by End Use Industry, 2025 to 2035
  • Figure 38: Latin America Market Value (USD Million) by Application, 2025 to 2035
  • Figure 39: Latin America Market Value (USD Million) by Country, 2025 to 2035
  • Figure 40: Latin America Market Value (USD Million) Analysis by Country, 2020 to 2035
  • Figure 41: Latin America Market Volume (Tons) Analysis by Country, 2020 to 2035
  • Figure 42: Latin America Market Value Share (%) and BPS Analysis by Country, 2025 to 2035
  • Figure 43: Latin America Market Y-o-Y Growth (%) Projections by Country, 2025 to 2035
  • Figure 44: Latin America Market Value (USD Million) Analysis by End Use Industry, 2020 to 2035
  • Figure 45: Latin America Market Volume (Tons) Analysis by End Use Industry, 2020 to 2035
  • Figure 46: Latin America Market Value Share (%) and BPS Analysis by End Use Industry, 2025 to 2035
  • Figure 47: Latin America Market Y-o-Y Growth (%) Projections by End Use Industry, 2025 to 2035
  • Figure 48: Latin America Market Value (USD Million) Analysis by Application, 2020 to 2035
  • Figure 49: Latin America Market Volume (Tons) Analysis by Application, 2020 to 2035
  • Figure 50: Latin America Market Value Share (%) and BPS Analysis by Application, 2025 to 2035
  • Figure 51: Latin America Market Y-o-Y Growth (%) Projections by Application, 2025 to 2035
  • Figure 52: Latin America Market Attractiveness by End Use Industry, 2025 to 2035
  • Figure 53: Latin America Market Attractiveness by Application, 2025 to 2035
  • Figure 54: Latin America Market Attractiveness by Country, 2025 to 2035
  • Figure 55: Western Europe Market Value (USD Million) by End Use Industry, 2025 to 2035
  • Figure 56: Western Europe Market Value (USD Million) by Application, 2025 to 2035
  • Figure 57: Western Europe Market Value (USD Million) by Country, 2025 to 2035
  • Figure 58: Western Europe Market Value (USD Million) Analysis by Country, 2020 to 2035
  • Figure 59: Western Europe Market Volume (Tons) Analysis by Country, 2020 to 2035
  • Figure 60: Western Europe Market Value Share (%) and BPS Analysis by Country, 2025 to 2035
  • Figure 61: Western Europe Market Y-o-Y Growth (%) Projections by Country, 2025 to 2035
  • Figure 62: Western Europe Market Value (USD Million) Analysis by End Use Industry, 2020 to 2035
  • Figure 63: Western Europe Market Volume (Tons) Analysis by End Use Industry, 2020 to 2035
  • Figure 64: Western Europe Market Value Share (%) and BPS Analysis by End Use Industry, 2025 to 2035
  • Figure 65: Western Europe Market Y-o-Y Growth (%) Projections by End Use Industry, 2025 to 2035
  • Figure 66: Western Europe Market Value (USD Million) Analysis by Application, 2020 to 2035
  • Figure 67: Western Europe Market Volume (Tons) Analysis by Application, 2020 to 2035
  • Figure 68: Western Europe Market Value Share (%) and BPS Analysis by Application, 2025 to 2035
  • Figure 69: Western Europe Market Y-o-Y Growth (%) Projections by Application, 2025 to 2035
  • Figure 70: Western Europe Market Attractiveness by End Use Industry, 2025 to 2035
  • Figure 71: Western Europe Market Attractiveness by Application, 2025 to 2035
  • Figure 72: Western Europe Market Attractiveness by Country, 2025 to 2035
  • Figure 73: Eastern Europe Market Value (USD Million) by End Use Industry, 2025 to 2035
  • Figure 74: Eastern Europe Market Value (USD Million) by Application, 2025 to 2035
  • Figure 75: Eastern Europe Market Value (USD Million) by Country, 2025 to 2035
  • Figure 76: Eastern Europe Market Value (USD Million) Analysis by Country, 2020 to 2035
  • Figure 77: Eastern Europe Market Volume (Tons) Analysis by Country, 2020 to 2035
  • Figure 78: Eastern Europe Market Value Share (%) and BPS Analysis by Country, 2025 to 2035
  • Figure 79: Eastern Europe Market Y-o-Y Growth (%) Projections by Country, 2025 to 2035
  • Figure 80: Eastern Europe Market Value (USD Million) Analysis by End Use Industry, 2020 to 2035
  • Figure 81: Eastern Europe Market Volume (Tons) Analysis by End Use Industry, 2020 to 2035
  • Figure 82: Eastern Europe Market Value Share (%) and BPS Analysis by End Use Industry, 2025 to 2035
  • Figure 83: Eastern Europe Market Y-o-Y Growth (%) Projections by End Use Industry, 2025 to 2035
  • Figure 84: Eastern Europe Market Value (USD Million) Analysis by Application, 2020 to 2035
  • Figure 85: Eastern Europe Market Volume (Tons) Analysis by Application, 2020 to 2035
  • Figure 86: Eastern Europe Market Value Share (%) and BPS Analysis by Application, 2025 to 2035
  • Figure 87: Eastern Europe Market Y-o-Y Growth (%) Projections by Application, 2025 to 2035
  • Figure 88: Eastern Europe Market Attractiveness by End Use Industry, 2025 to 2035
  • Figure 89: Eastern Europe Market Attractiveness by Application, 2025 to 2035
  • Figure 90: Eastern Europe Market Attractiveness by Country, 2025 to 2035
  • Figure 91: South Asia and Pacific Market Value (USD Million) by End Use Industry, 2025 to 2035
  • Figure 92: South Asia and Pacific Market Value (USD Million) by Application, 2025 to 2035
  • Figure 93: South Asia and Pacific Market Value (USD Million) by Country, 2025 to 2035
  • Figure 94: South Asia and Pacific Market Value (USD Million) Analysis by Country, 2020 to 2035
  • Figure 95: South Asia and Pacific Market Volume (Tons) Analysis by Country, 2020 to 2035
  • Figure 96: South Asia and Pacific Market Value Share (%) and BPS Analysis by Country, 2025 to 2035
  • Figure 97: South Asia and Pacific Market Y-o-Y Growth (%) Projections by Country, 2025 to 2035
  • Figure 98: South Asia and Pacific Market Value (USD Million) Analysis by End Use Industry, 2020 to 2035
  • Figure 99: South Asia and Pacific Market Volume (Tons) Analysis by End Use Industry, 2020 to 2035
  • Figure 100: South Asia and Pacific Market Value Share (%) and BPS Analysis by End Use Industry, 2025 to 2035
  • Figure 101: South Asia and Pacific Market Y-o-Y Growth (%) Projections by End Use Industry, 2025 to 2035
  • Figure 102: South Asia and Pacific Market Value (USD Million) Analysis by Application, 2020 to 2035
  • Figure 103: South Asia and Pacific Market Volume (Tons) Analysis by Application, 2020 to 2035
  • Figure 104: South Asia and Pacific Market Value Share (%) and BPS Analysis by Application, 2025 to 2035
  • Figure 105: South Asia and Pacific Market Y-o-Y Growth (%) Projections by Application, 2025 to 2035
  • Figure 106: South Asia and Pacific Market Attractiveness by End Use Industry, 2025 to 2035
  • Figure 107: South Asia and Pacific Market Attractiveness by Application, 2025 to 2035
  • Figure 108: South Asia and Pacific Market Attractiveness by Country, 2025 to 2035
  • Figure 109: East Asia Market Value (USD Million) by End Use Industry, 2025 to 2035
  • Figure 110: East Asia Market Value (USD Million) by Application, 2025 to 2035
  • Figure 111: East Asia Market Value (USD Million) by Country, 2025 to 2035
  • Figure 112: East Asia Market Value (USD Million) Analysis by Country, 2020 to 2035
  • Figure 113: East Asia Market Volume (Tons) Analysis by Country, 2020 to 2035
  • Figure 114: East Asia Market Value Share (%) and BPS Analysis by Country, 2025 to 2035
  • Figure 115: East Asia Market Y-o-Y Growth (%) Projections by Country, 2025 to 2035
  • Figure 116: East Asia Market Value (USD Million) Analysis by End Use Industry, 2020 to 2035
  • Figure 117: East Asia Market Volume (Tons) Analysis by End Use Industry, 2020 to 2035
  • Figure 118: East Asia Market Value Share (%) and BPS Analysis by End Use Industry, 2025 to 2035
  • Figure 119: East Asia Market Y-o-Y Growth (%) Projections by End Use Industry, 2025 to 2035
  • Figure 120: East Asia Market Value (USD Million) Analysis by Application, 2020 to 2035
  • Figure 121: East Asia Market Volume (Tons) Analysis by Application, 2020 to 2035
  • Figure 122: East Asia Market Value Share (%) and BPS Analysis by Application, 2025 to 2035
  • Figure 123: East Asia Market Y-o-Y Growth (%) Projections by Application, 2025 to 2035
  • Figure 124: East Asia Market Attractiveness by End Use Industry, 2025 to 2035
  • Figure 125: East Asia Market Attractiveness by Application, 2025 to 2035
  • Figure 126: East Asia Market Attractiveness by Country, 2025 to 2035
  • Figure 127: Middle East and Africa Market Value (USD Million) by End Use Industry, 2025 to 2035
  • Figure 128: Middle East and Africa Market Value (USD Million) by Application, 2025 to 2035
  • Figure 129: Middle East and Africa Market Value (USD Million) by Country, 2025 to 2035
  • Figure 130: Middle East and Africa Market Value (USD Million) Analysis by Country, 2020 to 2035
  • Figure 131: Middle East and Africa Market Volume (Tons) Analysis by Country, 2020 to 2035
  • Figure 132: Middle East and Africa Market Value Share (%) and BPS Analysis by Country, 2025 to 2035
  • Figure 133: Middle East and Africa Market Y-o-Y Growth (%) Projections by Country, 2025 to 2035
  • Figure 134: Middle East and Africa Market Value (USD Million) Analysis by End Use Industry, 2020 to 2035
  • Figure 135: Middle East and Africa Market Volume (Tons) Analysis by End Use Industry, 2020 to 2035
  • Figure 136: Middle East and Africa Market Value Share (%) and BPS Analysis by End Use Industry, 2025 to 2035
  • Figure 137: Middle East and Africa Market Y-o-Y Growth (%) Projections by End Use Industry, 2025 to 2035
  • Figure 138: Middle East and Africa Market Value (USD Million) Analysis by Application, 2020 to 2035
  • Figure 139: Middle East and Africa Market Volume (Tons) Analysis by Application, 2020 to 2035
  • Figure 140: Middle East and Africa Market Value Share (%) and BPS Analysis by Application, 2025 to 2035
  • Figure 141: Middle East and Africa Market Y-o-Y Growth (%) Projections by Application, 2025 to 2035
  • Figure 142: Middle East and Africa Market Attractiveness by End Use Industry, 2025 to 2035
  • Figure 143: Middle East and Africa Market Attractiveness by Application, 2025 to 2035
  • Figure 144: Middle East and Africa Market Attractiveness by Country, 2025 to 2035

Frequently Asked Questions

What is the market size of global Acetonitrile market estimated for 2025?

The market is estimated to reach a value of USD 325.2 million by the end of 2025.

At what rate the market is projected to grow during the forecast period?

The market is projected to exhibit a CAGR of 5.5% over the assessment period.

What is the market worth projected by end of forecast period?

The market is expected to clock revenue of USD 567.5 million by end of 2035.

Which are the key companies in Acetonitrile market?

Key companies in the Acetonitrile market include INEOS AG, Asahi Kasei Corporation, Formosa Plastics Corporation

Which is the leading segment in the Acetonitrile market?

On the basis on Industrial Grade and Pharmaceutical to command significant share over the forecast period.

Future Market Insights

Acetonitrile Market