Acid-Sensitive APIs Market Size, Share & Forecast Outlook 2025 to 2035

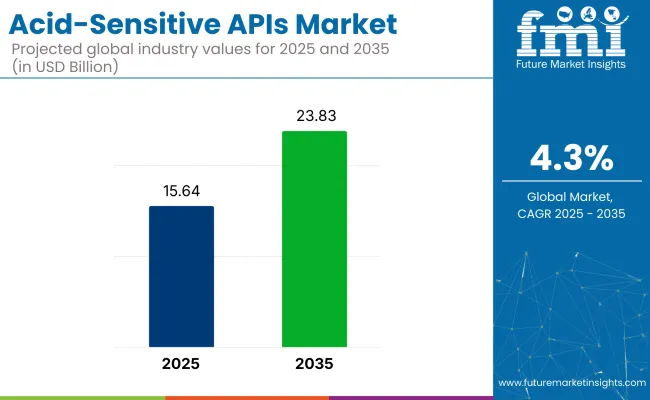
The acid-sensitive APIs market is expected to be valued at USD 15.64 billion in 2025 and USD 23.83 billion by 2035, with a projected CAGR of 4.3% during the forecast period. The growth of the market is being driven by the increasing demand for specialized drugs that require controlled release for the treatment of acid-related disorders and diseases.
Acid-Sensitive APIs Market Quick Stats

  • Market Value (2025): USD 15.64 billion
  • Forecast Value (2035): USD 23.83 billion
  • Forecast CAGR: 4.3%
  • Leading Segment in 2025: Omeprazole / Esomeprazole (~22% share)
  • Key Growth Region: Asia Pacific (India)
  • Top Key Players: Dr. Reddy’s Laboratories, ChemWerth Inc., Teva API, RPG Life Sciences, Apotex Pharmachem

Acid Sensitive Apis Market

Pharmaceutical technologies are continuously being advanced to develop drug formulations that enhance stability, solubility, and bioavailability, which are considered essential for effective treatment outcomes. The rising use of biopharmaceuticals and targeted therapies is expected to further contribute to market growth.

As highlighted by Kim Huynh-Ba in the Handbook of Stability Testing in Pharmaceutical Development, the importance of forced degradation studies (acid, base, and oxidative degradation) in stability programs is emphasized.

These studies are crucial in identifying degradation products, establishing degradation pathways, and validating the stability-indicating power of the analytical procedures used. The effects of stress testing are used to assess how acid-sensitive APIs behave under different environmental conditions, providing valuable insights into their intrinsic stability.

The adoption of acid-sensitive APIs is expected to increase, especially in the gastrointestinal and oncology sectors, where regulated treatments are in high demand. As regulations around drug safety tighten, the focus on targeted treatments is expected to be intensified. Technological innovations in drug delivery systems and drug formulations are expected to continue shaping the market through 2035, improving the efficacy and bioavailability of drugs, and enhancing overall patient outcomes in diverse therapeutic areas.

Analyzing Acid-Sensitive APIs Market by Top Investment Segments

The acid-sensitive APIs market is segmented into various key investment areas. By molecule, the market includes erythromycin, omeprazole/esomeprazole, lansoprazole, pancrelipase, rabeprazole, didanosine, liraglutide, mesalamine, and others.

Therapeutically, the market covers antibiotics, immunosuppressants, proton pump inhibitors, enzyme replacement, antiretrovirals, GLP-1 receptor agonists, and anti-inflammatory drugs. The end-users of these APIs include pharmaceutical manufacturers, biopharmaceutical companies, and contract development and manufacturing organizations (CDMOs).

Geographically, the market spans across key regions, including North America, Western Europe, East Asia, and South Asia, with each region contributing to the market’s expansion and growth.

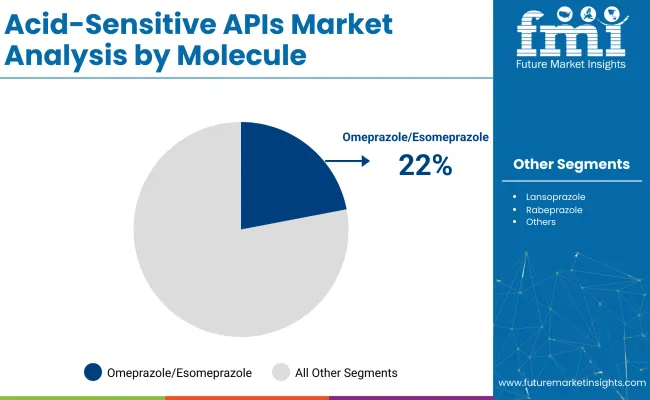
Omeprazole/Esomeprazole to Hold 22% Market Share in 2025

Omeprazole and esomeprazole are expected to capture 22% of the acid-sensitive APIs market share in 2025. These molecules are integral in treating conditions like gastroesophageal reflux disease (GERD), peptic ulcers, and Zollinger-Ellison syndrome. They work by reducing stomach acid production and are favored for their long-term effectiveness and safety profile.
  • Major pharmaceutical companies like AstraZeneca manufacture these molecules, which are widely available both in prescription and over-the-counter forms.
  • The increasing prevalence of acid-related disorders globally, particularly in emerging markets, is driving the demand for omeprazole and esomeprazole. Their affordability and proven efficacy will continue to support their growth in the market.

Acid Sensitive Apis Market Analysis By Molecule

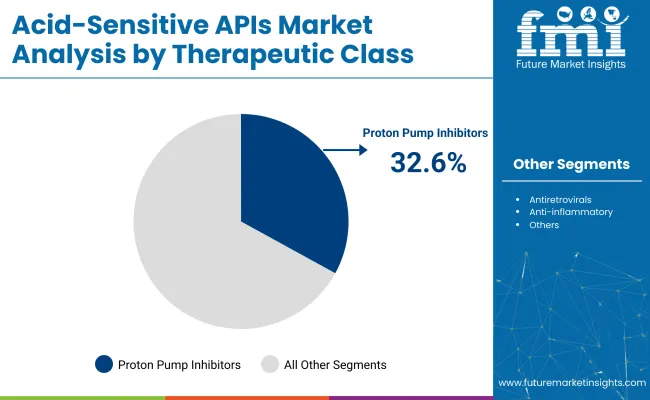
Proton Pump Inhibitors to Dominate Therapeutic Class with 32.6% Share in 2025

Proton pump inhibitors (PPIs) are projected to hold 32.6% of the acid-sensitive APIs market in 2025. PPIs, including omeprazole, pantoprazole, and lansoprazole, are considered the first-line treatment for acid-related disorders such as GERD, ulcers, and dyspepsia. These medications work by blocking the proton pumps in the stomach, significantly reducing acid production.
  • Major players like AstraZeneca, Takeda Pharmaceuticals, and Novartis lead the PPI market with these high-demand drugs.
  • With the rising number of patients suffering from acid reflux and related diseases, PPIs are expected to maintain their dominant position due to their effectiveness and wide availability, ensuring continued market growth in this therapeutic class.

Acid Sensitive Apis Market Analysis By Therapeutic Class

Pharmaceutical Manufacturers to Capture 45% Market Share in 2025

Pharmaceutical manufacturers are anticipated to dominate the acid-sensitive APIs market, securing 45% of the market share by 2025. These manufacturers are responsible for the production of API formulations, which are essential in treating a wide range of gastrointestinal conditions.

  • Major companies, such as GlaxoSmithKline, Novartis, and Johnson & Johnson, play key roles in the development and distribution of acid-sensitive drugs. As the demand for effective treatments for digestive health increases, these companies are expanding their portfolios with innovative formulations and combinations.
  • The growing focus on personalized medicine, along with advances in drug delivery systems, will further enhance the position of pharmaceutical manufacturers in the market.

Top Acid-Sensitive APIs Market Dynamics

The acid-sensitive active pharmaceutical ingredients (APIs) market is being driven by increasing demand for targeted therapies and advancements in drug delivery systems. However, formulation complexities and stability issues are limiting market expansion.

Increasing demand for targeted therapies and advancements in drug delivery systems are driving market growth.

The demand for acid-sensitive APIs is being significantly boosted by the growing prevalence of chronic diseases and the increasing need for targeted drug delivery. Advancements in drug delivery technologies, such as enteric coatings and controlled-release formulations, are enabling effective delivery of acid-sensitive APIs to specific sites in the gastrointestinal tract.

These innovations are enhancing the therapeutic efficacy of acid-sensitive drugs, leading to their greater adoption in treating conditions such as gastrointestinal disorders and certain cancers. Additionally, the growing focus on personalized medicine is further propelling demand for acid-sensitive APIs, allowing for more precise and effective treatment regimens.

Formulation complexities and stability issues are limiting market growth

Despite positive growth prospects, the acid-sensitive APIs market is being hindered by formulation complexities and stability issues. The instability of certain APIs in acidic environments requires the development of specialized formulations to protect the active ingredient until it reaches the targeted site of action.

These formulation challenges are necessitating significant investment in research and development, along with strict adherence to regulatory standards. Additionally, the high cost of producing acid-sensitive formulations is limiting accessibility, particularly in cost-sensitive markets. Overcoming these challenges is seen as essential for the continued growth and widespread adoption of acid-sensitive APIs in the pharmaceutical industry.

Analyzing Top Countries Formulating, Distributing, and Supplying Acid-Sensitive APIs

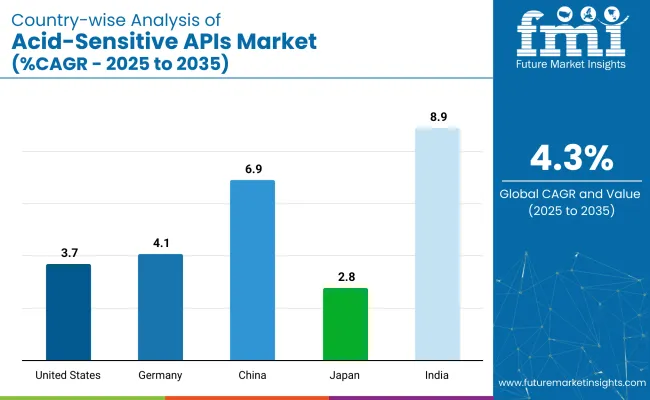
The acid-sensitive APIs market is expected to grow through 2035, driven by rising demand for controlled-release drugs. Industrialization in China and India is contributing to market growth, while advanced drug formulation technologies in the USA and Germany are also fueling expansion. Health awareness and specialized treatments are driving the market’s adoption.
Country Wise Analysis Of Acid Sensitive Apis Market

Countries CAGR (%)
United States 3.7%
Germany 4.1%
China 6.9%
Japan 2.8%
India 8.9%

United States Acid-Sensitive APIs Market Driven by Advancements in Drug Formulation

The United States acid-sensitive APIs market is expected to grow at a CAGR of 3.7% through 2035. Growth is driven by advancements in drug formulation technologies, with a focus on controlled-release formulations.

  • Major pharmaceutical companies like Pfizer and Merck are investing heavily in the development of acid-sensitive APIs.
  • Government regulations regarding pharmaceutical packaging and consumer awareness of product quality contribute to market growth. The development of sustainable and eco-friendly packaging materials is further driving demand for acid-sensitive APIs.
  • Regulatory standards ensuring the safety of packaging also support the steady expansion of this market in the USA.

Germany Acid-Sensitive APIs Market Focused on High-Quality Standards and Innovation

The Germany acid-sensitive APIs market is projected to grow at a CAGR of 4.1% through 2035. Growth is supported by increasing demand for high-quality pharmaceuticals and innovations in drug formulation.

  • Leading companies such as Bayer and Boehringer Ingelheim are focusing on developing new acid-sensitive APIs. Government policies supporting pharmaceutical research and adherence to quality standards are contributing to market expansion.
  • The strong pharmaceutical industry in Germany and its export-driven economy are enhancing demand for high-quality acid-sensitive APIs.
  • Innovations in sustainable packaging and a commitment to green chemistry are supporting the continued growth of the market in Germany.

China Acid-Sensitive APIs Market Expanding with Industrialization and Pharmaceutical Demand

Acid-sensitive APIs market in China is expected to grow at a CAGR of 6.9% through 2035. The market is being driven by rapid industrialization, increased pharmaceutical production, and the growing demand for safe drug packaging.

  • Leading companies such as Zhejiang Glass and China National Pharmaceutical Group are investing in the development of advanced packaging technologies.
  • Government policies promoting safety standards and packaging regulations are contributing to the market’s growth. The growing pharmaceutical sector and increasing exports are fueling demand for durable, high-quality glass packaging.
  • Technological advancements in manufacturing processes are further enhancing product safety and efficacy.

India Acid-Sensitive APIs Market Growing with Pharmaceutical Industry Expansion

The acid-sensitive APIs market in India is projected to grow at a CAGR of 8.9% through 2035. Growth is driven by the expanding pharmaceutical industry, increasing generics production, and the demand for packaging solutions meeting international standards.

  • Companies like Bormioli Pharma and Piramal Glass are expanding production capacities and improving packaging quality. The government’s focus on strengthening the domestic pharmaceutical industry and improving packaging standards is supporting market growth.
  • The increasing demand for Indian pharmaceuticals in international markets is further fueling the adoption of high-quality acid-sensitive APIs. India’s rising pharmaceutical exports are accelerating demand for packaging solutions in the market.

Japan Acid-Sensitive APIs Market Driven by Technological Advancements and Safety Standards

The acid-sensitive APIs market in Japan is projected to grow at a CAGR of 5.1% through 2035. Growth is supported by Japan’s advanced pharmaceutical sector and emphasis on drug safety and packaging quality.
  • Companies such as Nipro Corporation and SGD Pharma are advancing packaging technologies to ensure product safety and stability. Government regulations mandating high-quality packaging are contributing to market growth.
  • The country’s stringent safety standards and commitment to sustainable practices are fueling innovation in drug packaging. The focus on improving packaging performance and extending product shelf life is driving the steady growth of the market in Japan.

Leading Suppliers in the Acid-Sensitive Active Pharmaceutical Ingredients (API) Market

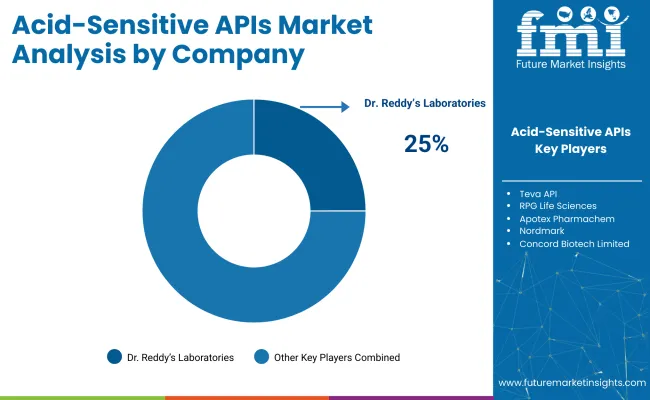
Acid Sensitive Apis Market Analysis By Company

The acid-sensitive API market is characterized by a diverse range of suppliers. Key players like Lonza Group, BASF SE, Evonik Industries, and Fujifilm Diosynth Biotechnologies dominate the market due to their extensive product portfolios, technological advancements, and strong global presence in the pharmaceutical sector.

Other significant suppliers such as Cipla Limited, Dr. Reddy's Laboratories, and Aurobindo Pharma focus on specialized markets, offering innovative and sustainable solutions tailored to the unique requirements of acid-sensitive APIs. Emerging players like Hikal Ltd, Granules India Limited, and Suven Pharmaceuticals target regional markets with cost-effective and niche product offerings, catering to specific consumer needs and preferences.

Recent Industry News

  • In May 2025, Lonza Group introduced the Capsugel Enprotect® size 9 capsule, a next-generation enteric capsule designed to enhance drug delivery for acid-sensitive APIs. This innovative capsule eliminates the need for additional coating and ensures consistent API release in the small intestine, simplifying formulation and manufacturing processes.
  • In April 2025, Lonza Group launched the Innovaform™ Accelerator center at its Colmar (France) site. This Center of Excellence aims to co-innovate with pharmaceutical customers on formulation and encapsulation solutions, addressing challenges such as solubility and bioavailability in acid-sensitive APIs. These developments highlight the industry's commitment to advancing drug delivery technologies for acid-sensitive active pharmaceutical ingredients.

Key Players in the Acid-Sensitive APIs Market

  • Dr. Reddy’s Laboratories
  • ChemWerth Inc.
  • Teva API
  • RPG Life Sciences
  • ApotexPharmachem
  • Nordmark
  • Chunghwa Chemical Synthesis & Biotech Co., Ltd
  • Concord Biotech Limited

Research Coverage and Scope Summary

Report Attributes Details
Current Total Market Size (2025) USD 15.64 billion
Projected Market Size (2035) USD 23.83 billion
CAGR (2025 to 2035) 4.3%
Base Year for Estimation 2024
Historical Period 2020 to 2024
Projections Period 2025 to 2035
Quantitative Units USD million for value and Metric Tons for volume
Molecules Analyzed (Segment 1) Erythromycin; Omeprazole/Esomeprazole; Lansoprazole; Pancrelipase; Rabeprazole; Didanosine; Liraglutide; Mesalamine; Others
Therapeutic Classes Covered (Segment 2) Antibiotics; Immunosuppressants; Proton pump inhibitors; Enzyme replacement; Antiretrovirals; GLP-1 receptor agonists; Anti-inflammatory; Others
End-Users Covered (Segment 3) Pharmaceutical manufacturers, Biopharmaceutical companies, and CDMOs
Regions Covered North America, Western Europe, East Asia, South Asia
Countries Covered United States; Canada; Germany; United Kingdom; France; Italy; Spain; China; Japan; South Korea; India; Pakistan; Bangladesh
Key Players Influencing the Market Dr. Reddy’s Laboratories; ChemWerth Inc.; Teva API; RPG Life Sciences; Apotex Pharmachem; Nordmark; Chunghwa Chemical Synthesis & Biotech Co., Ltd; Concord Biotech Limited
Additional Attributes Dollar sales by molecule (erythromycin, omeprazole, others); Growth of proton pump inhibitors and GLP-1 receptor agonists; Regional trends in API manufacturing; Market demand for enzyme replacement and anti-inflammatory therapies

Key Segments

By Molecule:

The market is segmented into erythromycin, omeprazole/esomeprazole, lansoprazole, pancrelipase, rabeprazole, didanosine, liraglutide, mesalamine, and others.

By Therapeutic Class:

The market covers antibiotics, immunosuppressants, proton pump inhibitors, enzyme replacement, antiretrovirals, GLP-1 receptor agonists, and anti-inflammatories.

By End-User:

The market is categorized into pharmaceutical manufacturers, biopharmaceutical companies, and CDMOs.

By Region:

The market spans North America, Western Europe, East Asia, and South Asia.

Table of Content

  1. Executive Summary
  2. Market Overview
  3. Market Background
  4. Global Market Analysis 2020 to 2024 and Forecast, 2025 to 2035
  5. Global Market Pricing Analysis 2020 to 2024 and Forecast 2025 to 2035
  6. Global Market Analysis 2020 to 2024 and Forecast 2025 to 2035, By Molecule
    • Erythromycin
    • Omeprazole / Esomeprazole
    • Carbon Aerogel Films
    • Lansoprazole
    • Pancrelipase
    • Rabeprazole
    • Didanosine
    • Liraglutide
    • Mesalamine
    • Others
  7. Global Market Analysis 2020 to 2024 and Forecast 2025 to 2035, By Therapeutic Class
    • Antibiotics
    • Immunosuppressant
    • Antiretroviral
    • GLP-1 receptor agonist
    • Anti-Inflammatory
  8. Global Market Analysis 2020 to 2024 and Forecast 2025 to 2035, By End User
    • Pharmaceutical Manufacturers
    • Biopharmaceutical Companies
    • CDMO
  9. Global Market Analysis 2020 to 2024 and Forecast 2025 to 2035, By Region
    • North America
    • Latin America
    • Western Europe
    • Eastern Europe
    • East Asia
    • South Asia & Pacific
    • Middle East and Africa
  10. North America Market Analysis 2020 to 2024 and Forecast 2025 to 2035, By Country
  11. Latin America Market Analysis 2020 to 2024 and Forecast 2025 to 2035, By Country
  12. Western Europe Market Analysis 2020 to 2024 and Forecast 2025 to 2035, By Country
  13. Eastern Europe Market Analysis 2020 to 2024 and Forecast 2025 to 2035, By Country
  14. East Asia Market Analysis 2020 to 2024 and Forecast 2025 to 2035, By Country
  15. South Asia & Pacific Market Analysis 2020 to 2024 and Forecast 2025 to 2035, By Country
  16. Middle East and Africa Market Analysis 2020 to 2024 and Forecast 2025 to 2035, By Country
  17. Key Countries Market Analysis
  18. Competition Analysis
    • Dr. Reddy’s Laboratories
    • ChemWerth Inc.
    • Teva API
    • RPG Life Sciences
    • Apotex Pharmachem
    • Nordmark
    • Chunghwa Chemical Synthesis & Biotech Co. Ltd
    • Concord Biotech Limited
  19. Assumptions & Acronyms Used
  20. Research Methodology

List of Tables

  • Table 1: Global Market Value (USD Billion) Forecast by Region, 2020 to 2035
  • Table 2: Global Market Volume (MT) Forecast by Region, 2020 to 2035
  • Table 3: Global Market Value (USD Billion) Forecast by Molecule, 2020 to 2035
  • Table 4: Global Market Volume (MT) Forecast by Molecule, 2020 to 2035
  • Table 5: Global Market Value (USD Billion) Forecast by Therapeutic Class, 2020 to 2035
  • Table 6: Global Market Volume (MT) Forecast by Therapeutic Class, 2020 to 2035
  • Table 7: Global Market Value (USD Billion) Forecast by End User, 2020 to 2035
  • Table 8: Global Market Volume (MT) Forecast by End User, 2020 to 2035
  • Table 9: North America Market Value (USD Billion) Forecast by Country, 2020 to 2035
  • Table 10: North America Market Volume (MT) Forecast by Country, 2020 to 2035
  • Table 11: North America Market Value (USD Billion) Forecast by Molecule, 2020 to 2035
  • Table 12: North America Market Volume (MT) Forecast by Molecule, 2020 to 2035
  • Table 13: North America Market Value (USD Billion) Forecast by Therapeutic Class, 2020 to 2035
  • Table 14: North America Market Volume (MT) Forecast by Therapeutic Class, 2020 to 2035
  • Table 15: North America Market Value (USD Billion) Forecast by End User, 2020 to 2035
  • Table 16: North America Market Volume (MT) Forecast by End User, 2020 to 2035
  • Table 17: Latin America Market Value (USD Billion) Forecast by Country, 2020 to 2035
  • Table 18: Latin America Market Volume (MT) Forecast by Country, 2020 to 2035
  • Table 19: Latin America Market Value (USD Billion) Forecast by Molecule, 2020 to 2035
  • Table 20: Latin America Market Volume (MT) Forecast by Molecule, 2020 to 2035
  • Table 21: Latin America Market Value (USD Billion) Forecast by Therapeutic Class, 2020 to 2035
  • Table 22: Latin America Market Volume (MT) Forecast by Therapeutic Class, 2020 to 2035
  • Table 23: Latin America Market Value (USD Billion) Forecast by End User, 2020 to 2035
  • Table 24: Latin America Market Volume (MT) Forecast by End User, 2020 to 2035
  • Table 25: Western Europe Market Value (USD Billion) Forecast by Country, 2020 to 2035
  • Table 26: Western Europe Market Volume (MT) Forecast by Country, 2020 to 2035
  • Table 27: Western Europe Market Value (USD Billion) Forecast by Molecule, 2020 to 2035
  • Table 28: Western Europe Market Volume (MT) Forecast by Molecule, 2020 to 2035
  • Table 29: Western Europe Market Value (USD Billion) Forecast by Therapeutic Class, 2020 to 2035
  • Table 30: Western Europe Market Volume (MT) Forecast by Therapeutic Class, 2020 to 2035
  • Table 31: Western Europe Market Value (USD Billion) Forecast by End User, 2020 to 2035
  • Table 32: Western Europe Market Volume (MT) Forecast by End User, 2020 to 2035
  • Table 33: Eastern Europe Market Value (USD Billion) Forecast by Country, 2020 to 2035
  • Table 34: Eastern Europe Market Volume (MT) Forecast by Country, 2020 to 2035
  • Table 35: Eastern Europe Market Value (USD Billion) Forecast by Molecule, 2020 to 2035
  • Table 36: Eastern Europe Market Volume (MT) Forecast by Molecule, 2020 to 2035
  • Table 37: Eastern Europe Market Value (USD Billion) Forecast by Therapeutic Class, 2020 to 2035
  • Table 38: Eastern Europe Market Volume (MT) Forecast by Therapeutic Class, 2020 to 2035
  • Table 39: Eastern Europe Market Value (USD Billion) Forecast by End User, 2020 to 2035
  • Table 40: Eastern Europe Market Volume (MT) Forecast by End User, 2020 to 2035
  • Table 41: East Asia Market Value (USD Billion) Forecast by Country, 2020 to 2035
  • Table 42: East Asia Market Volume (MT) Forecast by Country, 2020 to 2035
  • Table 43: East Asia Market Value (USD Billion) Forecast by Molecule, 2020 to 2035
  • Table 44: East Asia Market Volume (MT) Forecast by Molecule, 2020 to 2035
  • Table 45: East Asia Market Value (USD Billion) Forecast by Therapeutic Class, 2020 to 2035
  • Table 46: East Asia Market Volume (MT) Forecast by Therapeutic Class, 2020 to 2035
  • Table 47: East Asia Market Value (USD Billion) Forecast by End User, 2020 to 2035
  • Table 48: East Asia Market Volume (MT) Forecast by End User, 2020 to 2035
  • Table 49: South Asia & Pacific Market Value (USD Billion) Forecast by Country, 2020 to 2035
  • Table 50: South Asia & Pacific Market Volume (MT) Forecast by Country, 2020 to 2035
  • Table 51: South Asia & Pacific Market Value (USD Billion) Forecast by Molecule, 2020 to 2035
  • Table 52: South Asia & Pacific Market Volume (MT) Forecast by Molecule, 2020 to 2035
  • Table 53: South Asia & Pacific Market Value (USD Billion) Forecast by Therapeutic Class, 2020 to 2035
  • Table 54: South Asia & Pacific Market Volume (MT) Forecast by Therapeutic Class, 2020 to 2035
  • Table 55: South Asia & Pacific Market Value (USD Billion) Forecast by End User, 2020 to 2035
  • Table 56: South Asia & Pacific Market Volume (MT) Forecast by End User, 2020 to 2035
  • Table 57: Middle East and Africa Market Value (USD Billion) Forecast by Country, 2020 to 2035
  • Table 58: Middle East and Africa Market Volume (MT) Forecast by Country, 2020 to 2035
  • Table 59: Middle East and Africa Market Value (USD Billion) Forecast by Molecule, 2020 to 2035
  • Table 60: Middle East and Africa Market Volume (MT) Forecast by Molecule, 2020 to 2035
  • Table 61: Middle East and Africa Market Value (USD Billion) Forecast by Therapeutic Class, 2020 to 2035
  • Table 62: Middle East and Africa Market Volume (MT) Forecast by Therapeutic Class, 2020 to 2035
  • Table 63: Middle East and Africa Market Value (USD Billion) Forecast by End User, 2020 to 2035
  • Table 64: Middle East and Africa Market Volume (MT) Forecast by End User, 2020 to 2035

List of Figures

  • Figure 1: Global Market Volume (MT) Forecast 2020 to 2035
  • Figure 2: Global Market Pricing Analysis
  • Figure 3: Global Market Value (USD Billion) Forecast 2020 to 2035
  • Figure 4: Global Market Value Share and BPS Analysis by Molecule, 2025 and 2035
  • Figure 5: Global Market Y-o-Y Growth Comparison by Molecule, 2025 to 2035
  • Figure 6: Global Market Attractiveness Analysis by Molecule
  • Figure 7: Global Market Value Share and BPS Analysis by Therapeutic Class, 2025 and 2035
  • Figure 8: Global Market Y-o-Y Growth Comparison by Therapeutic Class, 2025 to 2035
  • Figure 9: Global Market Attractiveness Analysis by Therapeutic Class
  • Figure 10: Global Market Value Share and BPS Analysis by End User, 2025 and 2035
  • Figure 11: Global Market Y-o-Y Growth Comparison by End User, 2025 to 2035
  • Figure 12: Global Market Attractiveness Analysis by End User
  • Figure 13: Global Market Value (USD Billion) Share and BPS Analysis by Region, 2025 and 2035
  • Figure 14: Global Market Y-o-Y Growth Comparison by Region, 2025 to 2035
  • Figure 15: Global Market Attractiveness Analysis by Region
  • Figure 16: North America Market Incremental USD Opportunity, 2025 to 2035
  • Figure 17: Latin America Market Incremental USD Opportunity, 2025 to 2035
  • Figure 18: Western Europe Market Incremental USD Opportunity, 2025 to 2035
  • Figure 19: Eastern Europe Market Incremental USD Opportunity, 2025 to 2035
  • Figure 20: East Asia Market Incremental USD Opportunity, 2025 to 2035
  • Figure 21: South Asia & Pacific Market Incremental USD Opportunity, 2025 to 2035
  • Figure 22: Middle East and Africa Market Incremental USD Opportunity, 2025 to 2035
  • Figure 23: North America Market Value Share and BPS Analysis by Country, 2025 and 2035
  • Figure 24: North America Market Value Share and BPS Analysis by Molecule, 2025 and 2035
  • Figure 25: North America Market Y-o-Y Growth Comparison by Molecule, 2025 to 2035
  • Figure 26: North America Market Attractiveness Analysis by Molecule
  • Figure 27: North America Market Value Share and BPS Analysis by Therapeutic Class, 2025 and 2035
  • Figure 28: North America Market Y-o-Y Growth Comparison by Therapeutic Class, 2025 to 2035
  • Figure 29: North America Market Attractiveness Analysis by Therapeutic Class
  • Figure 30: North America Market Value Share and BPS Analysis by End User, 2025 and 2035
  • Figure 31: North America Market Y-o-Y Growth Comparison by End User, 2025 to 2035
  • Figure 32: North America Market Attractiveness Analysis by End User
  • Figure 33: Latin America Market Value Share and BPS Analysis by Country, 2025 and 2035
  • Figure 34: Latin America Market Value Share and BPS Analysis by Molecule, 2025 and 2035
  • Figure 35: Latin America Market Y-o-Y Growth Comparison by Molecule, 2025 to 2035
  • Figure 36: Latin America Market Attractiveness Analysis by Molecule
  • Figure 37: Latin America Market Value Share and BPS Analysis by Therapeutic Class, 2025 and 2035
  • Figure 38: Latin America Market Y-o-Y Growth Comparison by Therapeutic Class, 2025 to 2035
  • Figure 39: Latin America Market Attractiveness Analysis by Therapeutic Class
  • Figure 40: Latin America Market Value Share and BPS Analysis by End User, 2025 and 2035
  • Figure 41: Latin America Market Y-o-Y Growth Comparison by End User, 2025 to 2035
  • Figure 42: Latin America Market Attractiveness Analysis by End User
  • Figure 43: Western Europe Market Value Share and BPS Analysis by Country, 2025 and 2035
  • Figure 44: Western Europe Market Value Share and BPS Analysis by Molecule, 2025 and 2035
  • Figure 45: Western Europe Market Y-o-Y Growth Comparison by Molecule, 2025 to 2035
  • Figure 46: Western Europe Market Attractiveness Analysis by Molecule
  • Figure 47: Western Europe Market Value Share and BPS Analysis by Therapeutic Class, 2025 and 2035
  • Figure 48: Western Europe Market Y-o-Y Growth Comparison by Therapeutic Class, 2025 to 2035
  • Figure 49: Western Europe Market Attractiveness Analysis by Therapeutic Class
  • Figure 50: Western Europe Market Value Share and BPS Analysis by End User, 2025 and 2035
  • Figure 51: Western Europe Market Y-o-Y Growth Comparison by End User, 2025 to 2035
  • Figure 52: Western Europe Market Attractiveness Analysis by End User
  • Figure 53: Eastern Europe Market Value Share and BPS Analysis by Country, 2025 and 2035
  • Figure 54: Eastern Europe Market Value Share and BPS Analysis by Molecule, 2025 and 2035
  • Figure 55: Eastern Europe Market Y-o-Y Growth Comparison by Molecule, 2025 to 2035
  • Figure 56: Eastern Europe Market Attractiveness Analysis by Molecule
  • Figure 57: Eastern Europe Market Value Share and BPS Analysis by Therapeutic Class, 2025 and 2035
  • Figure 58: Eastern Europe Market Y-o-Y Growth Comparison by Therapeutic Class, 2025 to 2035
  • Figure 59: Eastern Europe Market Attractiveness Analysis by Therapeutic Class
  • Figure 60: Eastern Europe Market Value Share and BPS Analysis by End User, 2025 and 2035
  • Figure 61: Eastern Europe Market Y-o-Y Growth Comparison by End User, 2025 to 2035
  • Figure 62: Eastern Europe Market Attractiveness Analysis by End User
  • Figure 63: East Asia Market Value Share and BPS Analysis by Country, 2025 and 2035
  • Figure 64: East Asia Market Value Share and BPS Analysis by Molecule, 2025 and 2035
  • Figure 65: East Asia Market Y-o-Y Growth Comparison by Molecule, 2025 to 2035
  • Figure 66: East Asia Market Attractiveness Analysis by Molecule
  • Figure 67: East Asia Market Value Share and BPS Analysis by Therapeutic Class, 2025 and 2035
  • Figure 68: East Asia Market Y-o-Y Growth Comparison by Therapeutic Class, 2025 to 2035
  • Figure 69: East Asia Market Attractiveness Analysis by Therapeutic Class
  • Figure 70: East Asia Market Value Share and BPS Analysis by End User, 2025 and 2035
  • Figure 71: East Asia Market Y-o-Y Growth Comparison by End User, 2025 to 2035
  • Figure 72: East Asia Market Attractiveness Analysis by End User
  • Figure 73: South Asia & Pacific Market Value Share and BPS Analysis by Country, 2025 and 2035
  • Figure 74: South Asia & Pacific Market Value Share and BPS Analysis by Molecule, 2025 and 2035
  • Figure 75: South Asia & Pacific Market Y-o-Y Growth Comparison by Molecule, 2025 to 2035
  • Figure 76: South Asia & Pacific Market Attractiveness Analysis by Molecule
  • Figure 77: South Asia & Pacific Market Value Share and BPS Analysis by Therapeutic Class, 2025 and 2035
  • Figure 78: South Asia & Pacific Market Y-o-Y Growth Comparison by Therapeutic Class, 2025 to 2035
  • Figure 79: South Asia & Pacific Market Attractiveness Analysis by Therapeutic Class
  • Figure 80: South Asia & Pacific Market Value Share and BPS Analysis by End User, 2025 and 2035
  • Figure 81: South Asia & Pacific Market Y-o-Y Growth Comparison by End User, 2025 to 2035
  • Figure 82: South Asia & Pacific Market Attractiveness Analysis by End User
  • Figure 83: Middle East and Africa Market Value Share and BPS Analysis by Country, 2025 and 2035
  • Figure 84: Middle East and Africa Market Value Share and BPS Analysis by Molecule, 2025 and 2035
  • Figure 85: Middle East and Africa Market Y-o-Y Growth Comparison by Molecule, 2025 to 2035
  • Figure 86: Middle East and Africa Market Attractiveness Analysis by Molecule
  • Figure 87: Middle East and Africa Market Value Share and BPS Analysis by Therapeutic Class, 2025 and 2035
  • Figure 88: Middle East and Africa Market Y-o-Y Growth Comparison by Therapeutic Class, 2025 to 2035
  • Figure 89: Middle East and Africa Market Attractiveness Analysis by Therapeutic Class
  • Figure 90: Middle East and Africa Market Value Share and BPS Analysis by End User, 2025 and 2035
  • Figure 91: Middle East and Africa Market Y-o-Y Growth Comparison by End User, 2025 to 2035
  • Figure 92: Middle East and Africa Market Attractiveness Analysis by End User
  • Figure 93: Global Market - Tier Structure Analysis
  • Figure 94: Global Market - Company Share Analysis

Frequently Asked Questions

What is the projected size of the acid-sensitive APIs market by 2035?

The market is expected to reach USD 23.83 billion by 2035.

What is the estimated market size of the acid-sensitive APIs market in 2025?

The market size is projected to be USD 15.64 billion in 2025.

What is the CAGR of the acid-sensitive APIs market from 2025 to 2035?

The market is expected to grow at a CAGR of 4.3%.

Which country is the fastest growing in the acid-sensitive APIs market?

India is the fastest growing country with a CAGR of 8.9%.

Which country holds the highest market share in the acid-sensitive APIs market?

The United States holds the highest market share with a 3.7% CAGR.

Explore Pharmaceuticals Insights

Future Market Insights

Acid-Sensitive APIs Market