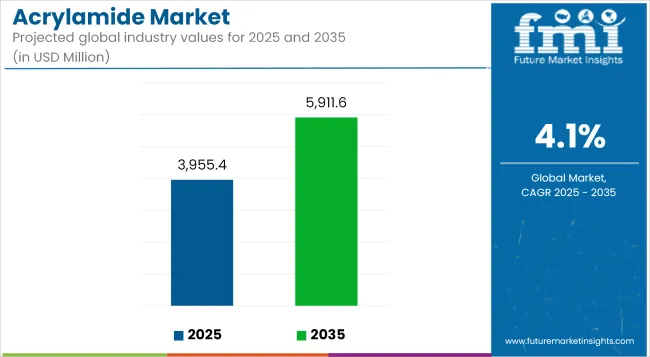
The global acrylamide market is projected to increase from USD 3,955.4 million in 2025 to USD 5,911.6 million by 2035, reflecting a CAGR of 4.1% over the forecast period. Market expansion is being supported by widespread use in water treatment, oil recovery, pulp and paper production, mining, and textile processing.

| Metric | Value |
|---|---|
| Industry Size (2025E) | USD 3,955.4 million |
| Industry Value (2035F) | USD 5,911.6 million |
| CAGR (2025 to 2035) | 4.1% |
Acrylamide is being primarily utilized in the production of polyacrylamide (PAM), which serves as a high-performance flocculant, thickener, and binding agent. Municipal and industrial wastewater facilities are applying polyacrylamide to improve sedimentation, sludge dewatering, and solid-liquid separation, in response to tightening regulatory frameworks and rising water stress.
In the oil and gas industry, acrylamide-based polymers are being deployed in enhanced oil recovery (EOR) operations. These polymers are increasing reservoir sweep efficiency by improving fluid viscosity and reducing water mobility. The technique is being widely adopted in mature oilfields and unconventional recovery zones where output has plateaued under conventional methods.
In paper manufacturing, acrylamide-based products are being used as retention aids and dry-strength additives. Increased demand for lightweight, recyclable, and biodegradable paper-based packaging materials is driving consumption in pulp and paper mills. These materials are being adopted as substitutes for single-use plastics across consumer goods and industrial packaging sectors.
Acrylamide is also being applied in textile sizing and fiber treatment processes, where it enhances fabric strength and dye uptake. Its role in soil conditioning for agriculture and in gel electrophoresis for biotechnology further contributes to steady end-use diversification.
Recent innovations have introduced bio-based acrylamide production routes, allowing for the formulation of eco-friendly polyacrylamide alternatives. These products are supporting market development in regions that are upgrading water infrastructure or pursuing circular economy goals. Research initiatives targeting reduced toxicity and improved biodegradability are aligning with long-term regulatory and environmental priorities.
As investment in water infrastructure and resource efficiency continues across Asia, Africa, and Latin America, acrylamide consumption is expected to rise. The material’s role in industrial process optimization, energy resource extraction, and environmental compliance is expected to drive its demand in near future.

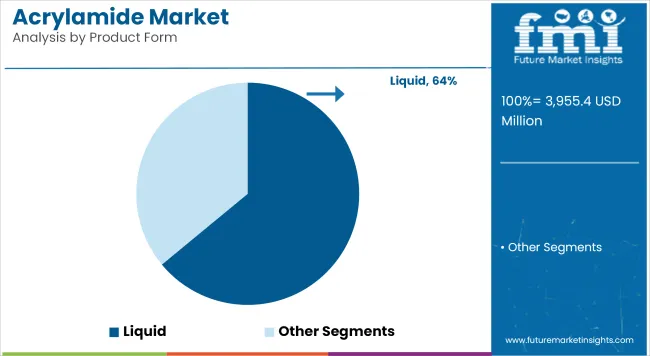
Liquid acrylamide is estimated to account for approximately 64% of the global acrylamide market share in 2025 and is projected to grow at a CAGR of 4.2% through 2035. This form is widely used as a precursor in the production of polyacrylamide, which is applied in wastewater treatment, mining, and oil recovery processes.
Liquid form offers advantages such as easier dosing, faster reaction rates, and compatibility with continuous processing systems. Demand remains high across regions investing in municipal water treatment infrastructure and enhanced oil recovery operations. Producers are focusing on improving storage stability and developing low-residual formulations to meet regulatory and environmental requirements.

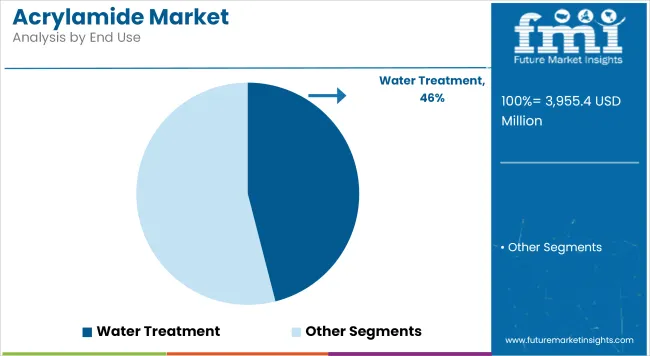
The water treatment segment is projected to hold approximately 46% of the global acrylamide market share in 2025 and is expected to grow at a CAGR of 4.3% through 2035. Acrylamide-based polymers play a critical role in removing suspended solids, organic contaminants, and heavy metals from water in both public utilities and industrial operations.
Rising concerns over water scarcity, pollution control, and regulatory compliance are driving investments in advanced water treatment systems across Asia-Pacific, North America, and parts of the Middle East. With stricter discharge norms and sustainability mandates being adopted worldwide, acrylamide continues to serve as a key building block for high-efficiency flocculants and sedimentation aids.
Problems Related to Environment and Health
Acrylamide is a substance which is regarded as might be a human carcinogen, so it has raised a number of significant issues related to health and the environment. This is largely due to its presence in industrial wastewater, food processing, as well as polymer applications, which has led to the need for strict regulatory actions, therefore industries need to follow controlled handling, exposure minimization, and safe disposal practices as prescribed. The substance Neurotoxic Effects and suspected origination of cancer have led to global desires to lessen acrylamide in food, drinking water, and industrial effluents.
Public enlightenment and regulatory action are the two main factors that are driving industries to transition to low-toxicity, biodegradable materials. Firms nowadays are more inclined to invest in the studies of non-toxic derivatives of acrylicamide, enzyme-based polymerization methods, and bio-based flocculants that would address environmental and human health risks. On the downside, their scalability, cost-effectiveness, and performance consistency remain major constraints for industry implementation.
Raw material Prices That Shift
Acrylamide production largely utilizes acrylonitrile which is a petroleum chemical derivative, thus the industry becomes extremely vulnerable to crude oil price caps, supply chain interruptions, and geopolitical calmness. The worldwide energy crisis, fluctuating oil stockpiles, and trade prohibitions give rise to the initial phase of trip and flimsy economic conditions which drive raw material pricing insecure thus greatly affecting the production costs and profit margins of acrylamide makers.
The industry's dependency on imported raw materials and regional gaps in the acrylonitrile supply chain worsens the pricing fluctuations. They are searching for alternative feedstock’s, bio-based production processes, and advanced synthesis technologies that would get them out of the petrochemical supply chain. Nevertheless, the shift to renewable or waste-derived raw materials is a sustainable one and presents both technical and financial barriers requiring large-scale R&D funding and regulatory approvals.
Overarching Regulatory Compliance
Governments all over the globe are decisively coming up with benchmarks that belie acrylamide use, particularly in food safety, drinking water treatment, wastewater disposal, and polymeric-based consumer products. Regulatory bodies including the USA Environmental Protection Agency (EPA), European Chemicals Agency (ECHA), and China's Ministry of Ecology and Environment (MEE) have provided strict permissible exposure limits, disposal protocols, and monitoring frameworks to minimize the risk of acrylamide contamination.
Design of Eco-Friendly & Biodegradable Acrylamide Alternatives
Driving of non-toxic and sustainable acrylamide substitutes is a key factor triggering the advance of bio-based polymers, enzyme-catalyzed polyacrylamide synthesis, and degradable flocculants.
Scientists are uniquely focused on green chemistry approaches such as: Polymers based on biobased alternatives derived from starch, cellulose, and chitosan, which have very high water absorption capacity and are excellent flocculants. Enzyme-related polymerization which leads to residual toxic acrylamide, absent and allow analogon the formation ofhigh molecular weight properties for industry to intramolecular add.
Hybrid and modified polyacrylamide formulations, which are preset with two or more monomers, are not only added with bio-based crosslinking agents but also included with nano-particles to considerably improve performance and safety.
As sustainability policies worldwide get tougher and investors in ESG (Environmental, Social, and Governance) feel more commitment, companies that are putting in money to produce it become next-reader acrylamide replacements are however, the cost-effective, scalable. regulatory approval for eco-friendly alternatives is one of the key industry challenges.
The oil and gas industry keeps being a major consumer of acrylamide-based polyacrylamides with their specific application in enhanced oil recovery (EOR), drilling fluid additives, and oil sands processing. Rising in global energy demand, companies have decided to implement complex polymer flooding to enhance oil extraction and to maximize reservoir performance.
Polyvalent flocculants based on polyacrylamide attend copper ore processing, tailings dewatering, and solid-liquid separation, thus, being used in the mining sector. The movement towards rare earth metal mining, lithium extraction, and mineral element refining have pushed the demand for polymeric-based separation agents of the highest quality.
The textile and paper industries are on the rise using acrylic acid- based retention aids, drainage aids, and fiber-binding agents to increase the durability of fabric, to strengthen paper, and to increase the production efficiency. The change to environmentally sustainable textile manufacturing and the move to biodegradable paper products is the mind driver for the development of polyacrylamides which are less toxic to the environment.

The United States acronym of acrylamide market is on the way to getting higher, as its water treatment industry is getting broader as well as the increasing usage of it in petroleum recovery and total polymer chemistry. The wastewater treatment plants are driving the need for acrylamide-based polyacrylamides as a result of stringent EPA rules concerning the industrial effluents and potable water standards.
Acrylamide is one of the major raw materials used in the field of oil and gas for the EOR (Enhanced Oil Recovery) techniques. Polyacrylamides used in EOR improved the viscosity and also the extraction of the crude oil. Furthermore, the paper manufacturing sector within the USA is slowly but steadily being demanded to produce harder papers with the addition of acrylamide-based retention aids and drainage agents.
The profitability of sustainable production of acrylamide, which is bio-based as well, forms a different ground for market parameters. In the face of a considerable intensity of research in polymer applications, and an assured stance of government support for wastewater treatment projects, the USA acrylamide market is looking forward to an uninterrupted increase.
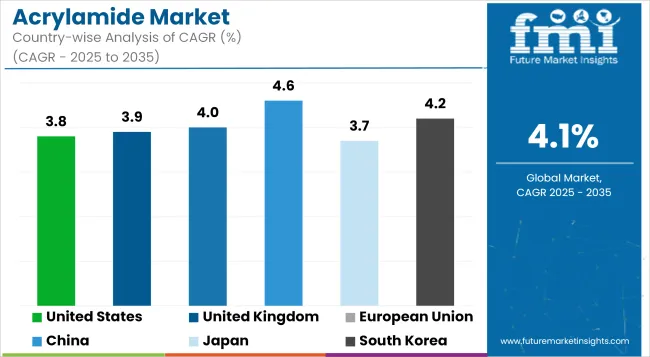
| Country | CAGR (2025 to 2035) |
|---|---|
| United States | 3.8% |
The UK acrylamide market is on a moderate growth trend, as the country keeps focusing on securing and efficient water management, setting up regulatory policies for the industrial wastewater treatment sector, and the rising demand for paper products. In the framework for stricter ecological sustainability, the UK government is motivating the enterprises to promote the use of polyacrylamide-based flocculants for wastewater treatment. This is a measure that aims to comply with EU-derived clean water directives.
In addition, the use of biodegradable packaging in food and drink shops is one of the main factors causing an increase in the demand for acrylamide-based paper processing agents. As a result of the olecrasování which is currently being promoted in the use of acrylamide for mining and drilling fluids in industrial applications as a lubricant and filter aid, this will also be a factor of market expansion.
Advancements in the field of developing technology in the direction of bio-based acrylamide production are not only affording but also making the UK strategic as a long-lasting and approved market sector in the acrylamide industry
| Country | CAGR (2025 to 2035) |
|---|---|
| United Kingdom | 3.9% |
The European Union (EU) is a stable both in the production and the consumption of acrylamide products in this market, due to an effective yet strict environmental policy, a high degree of innovation in water recycling technologies, and the growing demand from several sectors such as paper and petroleum industries. The EU's commitment to reach the net-zero emissions and minimize industrial waste, in turn, has hastened the use of acrylamide-based flocculants in municipal and industrial wastewater treatment plants.
In addition, the wave of trend towards biodegradable and reusable paper packaging in reaction to single-use plastic bans is the force that drives the demand for acrylamide-based retention and drainage aids in the paper industry. The chemical and petroleum industry is also being expanded by the major EU countries such as Germany, France, and Italy thus providing the opportunities for acrylamide-based EOR applications. The EU acrylamide market is planned to remain further growth due to constant stress on the industrial sector's sustainable development and R&D drive on modern polymers.
| Region | CAGR (2025 to 2035) |
|---|---|
| European Union | 4.0% |
China is the premier consumer and also producer of acrylamide with its enormous demand for water treatment, growing paper production and swift industrialization. The policies of the Chinese government that target the improvement of water quality and the decrease of industrial pollution have brought about direct investments in new plants where the acrylamide-based polyacrylamides are used for flocculation and purification processes.
The newly minted demand for the paper products of various kinds which among others now include packaging materials is adding to the consumption escalation for acrylamide-based retention and strengthening agents for the pulp and paper industry. Oil and gas developments in the Country Champion have embraced a wider potential oil recovery mechanism using the acrylamide-based formulations for better extraction levels.
By way of constant improvement in the production capacity, along with the recently introduced environmentally friendly polymer chemistry, China is on the way to keeping its position as the largest acrylamide market worldwide.
| Country | CAGR (2025 to 2035) |
|---|---|
| China | 4.6% |
The market for acrylamide in Japan is exemplary by technology-oriented innovations, strict environmental rules, and the vast application in wastewater treatment and specialty chemicals. The strict water quality standards of the country and its focus on industrial emission reduction have been the major drivers behind the considerable inflow of money for the development of advanced flocculation and filtration solutions with the help of acrylamide-based polymers.
Besides, the paper and packaging sector of Japan has been addressing the issues of acrylamide-based additives to the processing efficiency of materials and the enhancement of the durability of the biodegradable packaging materials.
The pharmaceuticals and electronics sectors in Japan as well employ acrylamide derivatives in the process of precision chemical synthesis and microfabrication. The expected shift towards biopolymer alternatives and research in nanotechnology are projected to help the Japanese scaling up of acrylamide-based applications in the technical sectors further.
| Country | CAGR (2025 to 2035) |
|---|---|
| Japan | 3.7% |
The market scenario of acrylamide in South Korea is bright primarily because of the fast expansion of the industrial sector, new technology in water treatment, and the steadily rising demand from the petrochemical and packaging industries. The government's operating strategies that emphasize ecological site remediation and green manufacturing have quickened the transformation of the water treatment process with carton saponification.
Staying in oil, the holistic techniques based on the method of acrylamide, are coming out to be one of the leading technique of enhanced oil recovery and this way they make the whole process of resource extraction more effective. South Korea's high-tech electronics and semiconductor manufactures also put to use acrylamide-based chemical processes for the production of materials on the atomic level.
With smart manufacturing technology on the rise and material research enhancer development, South Korea shall not only hold its trajectory but be at the forefront of the acrylamide market, dealing economically and environmentally with innovation in industry.
| Country | CAGR (2025 to 2035) |
|---|---|
| South Korea | 4.2% |
Acrylamide producers are placing greater emphasis on enhancing the efficiency of acrylamide production while adhering to stricter environmental regulations. As a result, alternative processes are being explored to minimize harmful by-products and shift toward more sustainable and safer production methods. Companies are also focusing on developing higher purity acrylamide products to meet the specialized requirements of industries such as pharmaceuticals and food processing.
The overall market size for Acrylamide was USD 3,799.7 million in 2024.
The market is expected to reach USD 3,955.4 million in 2025.
Higher adoption hydraulic fracturing for fossil fuels is driving the market.
The Acrylamide Market is projected to reach USD 5,911.6 million by 2035.


Full Research Suite comprises of:
Market outlook & trends analysis
Interviews & case studies
Strategic recommendations
Vendor profiles & capabilities analysis
5-year forecasts
8 regions and 60+ country-level data splits
Market segment data splits
12 months of continuous data updates
DELIVERED AS:
PDF EXCEL ONLINE
Polyacrylamide Market Size and Share Forecast Outlook 2025 to 2035
Enzymatic Acrylamide-Reduction Systems Market Analysis - Size, Share, and Forecast Outlook 2025 to 2035

Thank you!
You will receive an email from our Business Development Manager. Please be sure to check your SPAM/JUNK folder too.
Chat With
MaRIA