Agrimony Market Size and Share Forecast Outlook 2025 to 2035

The global agrimony market is projected to grow from USD 357.3 million in 2025 to USD 604.6 million by 2035, at a CAGR of 5.4%.The market growth is driven by the rising consumer preference for natural and alternative health solutions, as well as the growing focus on organic and sustainable farming practices.
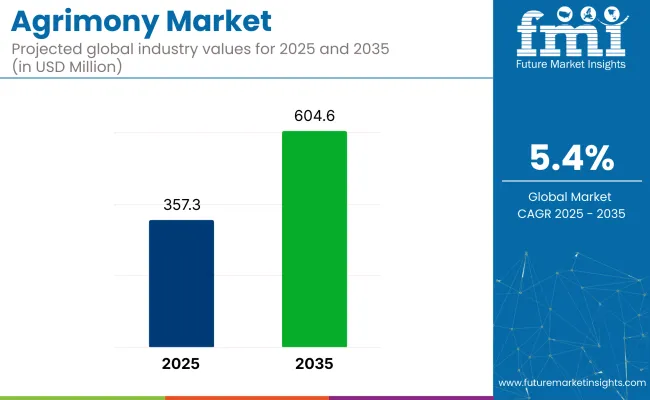
Quick Stats of Agrimony Market

  • Market Value (2025): USD 357.3 million
  • Forecast Value (2035): USD 604.6 million
  • Forecast CAGR (2025-2035): 5.4%
  • Leading Segment in 2025: Agrimony Powder (55%)
  • Key Growth Region: Asia Pacific (India 4.3% of CAGR )
  • Top Key Players: Best Agrolife Ltd., Crystal Crop Protection Limited, DhanukaAgritech, BASF SE, Bayer AG

Agrimony Market

Metric Value
Market Size in 2025 USD 357.3 million
Projected Market Size in 2035 USD 604.6 million
CAGR (2025 to 2035) 5.4%

The demand for agrimony is particularly high in herbal remedies, where it is used for its therapeutic benefits, and in natural skincare formulations due to its anti-inflammatory and antioxidant properties. The agrimony market has a small yet significant share in its parent industries.

In the herbal supplements market, agrimony holds a share of around 1-2%, as it is one of many herbal remedies used for various health conditions. In the pharmaceuticals market, agrimony accounts for approximately 0.5-1%, as it is utilized in niche therapeutic applications.

The cosmetics and personal care sector also shows a growing interest, with agrimony representing around 2-3% of the market, driven by its inclusion in natural skincare products. In the functional foods market, agrimony's share stands at 1-2%, where it is added to specialized health products aimed at improving well-being.

Recent developments in agrimony-based products have focused on improving production efficiency and ensuring product quality. Manufacturers like Gaia Herbs and Nature’s Way are prioritizing third-party testing and supply chain transparency to enhance consumer trust.

Additionally, companies are incorporating advanced extraction technologies to standardize the concentration of active compounds, ensuring consistency across product batches. Strategic partnerships, such as DhanukaAgritech's agreement with Kimitec, are also advancing the development of natural, bio-based products that align with sustainable agricultural practices.

Agrimony Market Analyzed by Top Investment Segments

The market is segmented by form into powder and dried leaf form; by application into pharmaceuticals and food & beverages; by distribution channel into store-based retail, specialty stores, online retail, supermarkets, and hypermarkets.

The market is segmented into North America, Latin America, Western Europe, Eastern Europe, South Asia & Pacific, East Asia, Central Asia, Balkan and Baltic countries, Russia and Belarus, and the Middle East & Africa.

Agrimony Powder to Lead with 55% Market Share in 2025

Agrimony powder is expected to hold 55% of the agrimony market share by 2025. Its popularity is growing due to its extensive use in herbal remedies and natural supplements, which are gaining traction among health-conscious consumers.

Agrimony powder is widely appreciated for its potential health benefits, including its anti-inflammatory and antioxidant properties. Companies like Swanson Health Products, Nature’s Way, and Herbalife are focusing on expanding agrimony powder-based products in the market. The demand for natural ingredients in pharmaceuticals and wellness products is expected to further drive the growth of this segment.
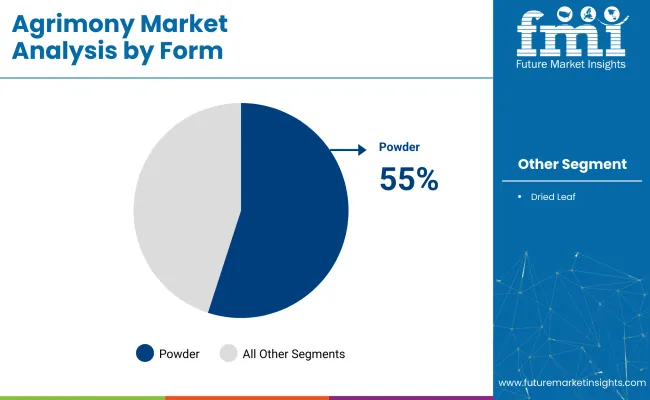
  • Agrimony powder is increasingly used in herbal remedies and natural supplements.
  • Swanson Health Products, Nature’s Way, and Herbalife are major players in the agrimony powder market.
  • The growth of the natural products market is driving the demand for agrimony powder.

Agrimony Market By Form

Pharmaceutical Applications Driving Increased Product Adoption

Pharmaceutical applications of agrimony are projected to hold a dominant 60% share of the market by 2025. Agrimony is widely used in traditional medicine for treating conditions such as digestive issues, skin problems, and respiratory disorders.

With rising consumer preference for natural treatments, agrimony’s pharmaceutical applications are increasingly adopted in products aimed at digestive health, anti-inflammatory treatments, and immune support. Companies like Herbalife, NOW Foods, and Gaia Herbs are incorporating agrimony into their product lines, with growth driven by increasing consumer awareness about plant-based remedies.
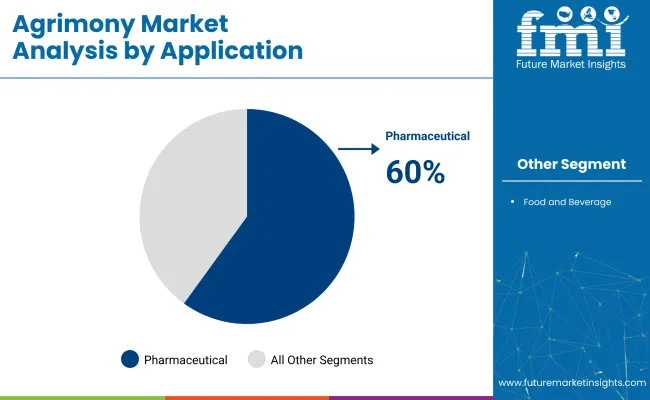
  • Agrimony is increasingly used in digestive health, anti-inflammatory, and immune support products.
  • Leading companies like Herbalife, NOW Foods, and Gaia Herbs are incorporating agrimony into their product offerings.
  • The increasing preference for natural treatments is fueling agrimony’s pharmaceutical market growth.

Agrimony Market By Application

Physical Retail Crucial for Distribution Channels

Store-based retail is expected to account for 35% of the agrimony market share by 2025. Physical retail stores, including health food stores, pharmacies, and supermarkets, play a critical role in the distribution of agrimony products. The rise in consumer demand for health supplements and natural remedies is expected to boost sales through brick-and-mortar retail channels.

Leading retail chains like Walmart, CVS Health, and Boots are expanding their product offerings to include agrimony-based products. This trend is further supported by the growing number of health-conscious consumers seeking natural solutions.

  • Health food stores, pharmacies, and supermarkets are key drivers for agrimony product sales.
  • Retail chains such as Walmart, CVS Health, and Boots are expanding agrimony-based offerings.
  • The demand for natural remedies is driving agrimony sales through physical retail outlets.

Top Agrimony Market Dynamics

The agrimony market is growing due to the increasing demand for natural remedies and functional foods. Agrimony is becoming more popular for its medicinal properties, and its inclusion in various products is expected to drive further market growth.

Preference for herbal and natural products boosts agrimony demand.

Consumers are increasingly shifting toward bio-based and holistic health solutions, pushing the demand for agrimony, especially for its antimicrobial, antioxidant, and anti-inflammatory properties. Agrimony’s versatility in use across functional foods, beverages, dietary supplements, and skincare products is also contributing to its market growth.

As more consumers seek alternatives to synthetic chemicals, agrimony-based products are expected to see wider adoption across different sectors. Additionally, increasing government support for the use of herbal remedies in consumer products is fueling demand for agrimony.

  • Preference for herbal and natural products boosts agrimony demand.
  • Increasing applications in health and wellness products drive market growth.
  • Growing adoption of agrimony-based products across functional food and beverage sectors.

High production costs limit affordability for consumers.

Despite its increasing demand, the agrimony market faces challenges related to high production costs, especially for organic and sustainably sourced agrimony. The cost of cultivation, harvesting, and processing organic agrimony can limit its affordability.

Additionally, regulatory challenges regarding the approval of health claims associated with agrimony in supplements and food products pose significant hurdles. Limited scientific research on the full therapeutic benefits of agrimony also affects consumer confidence. Market fragmentation, with many small producers, leads to inconsistencies in quality and supply chain complexities, making it difficult for larger companies to scale up operations.
  • High production costs limit affordability for consumers.
  • Limited scientific research restricts market acceptance and consumer confidence.
  • Regulatory approval challenges for health claims impact product development.

Top Countries Manufacturing, Distributing, and Generating Demand for Agrimony

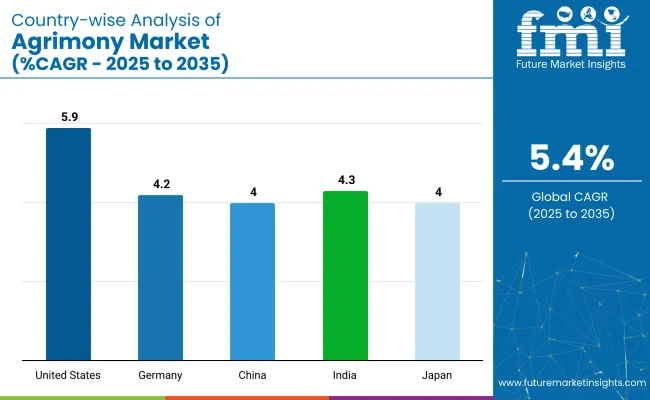
Country Wise Analysis Of Agrimony Market

Country CAGR (2025 to 2035)
United States 5.9%
Germany 4.2%
China 4.0%
India 4.3%
Japan 4.0%

The agrimony marketshows steady growth across both OECD and BRICS countries. Among the OECD countries, the United States is expected to lead with a CAGR of 5.9% from 2020 to 2035. Growth in the USA is driven by increasing consumer interest in herbal and natural remedies, as well as expanding demand for functional foods. Germany, with a CAGR of 4.2%, benefits from its well-established health-conscious population and the increasing preference for plant-based products.

In China and India, the market shows moderate growth, with CAGRs of 4.0% and 4.3%, respectively. These markets are benefiting from the rising interest in traditional herbal medicine and the growing demand for natural ingredients in wellness products. Japan also experiences steady growth at 4.0%, with a focus on herbal supplements and traditional remedies driving demand for agrimony.

The report covers detailed analysis of 40+ countries and the top five countries have been shared as a reference.

In-depth Analysis of Agrimony Market in the United States

Demand for agrimony in the United States is expected to grow at a CAGR of 5.9% through 2035. The increasing demand for herbal remedies, wellness products, and natural solutions is driving market expansion. Agrimony, a popular herb used in teas and supplements, has seen rising adoption due to its perceived health benefits.

With a growing focus on plant-based health products, the USA continues to lead in the market for herbal ingredients. Key trends include technological advancements in product formulations, along with a shift toward natural and organic wellness products.

  • Increased adoption of herbal and natural remedies in health products.
  • Growing demand for wellness-focused products like teas and supplements.
  • Technological advancements supporting the formulation of plant-based ingredients.

Demand Forecast for Agrimony Market in Germany

Germany is projected to grow at a CAGR of 4.2% through 2035 in the agrimony market. The country’s strong preference for organic, natural products and healthy living fuels the demand for agrimony in functional foods and wellness products. Agrimony’s medicinal properties, particularly for digestive health, are well recognized, driving adoption in herbal remedies.

Increased awareness of plant-based products and clean-label ingredients contributes to the market’s growth. Germany’s robust regulatory framework and eco-conscious population support agrimony’s integration into the consumer wellness segment.

  • High demand for organic, clean-label, and natural wellness products.
  • Increased use of agrimony in functional foods and supplements.
  • Strong regulatory support for plant-based ingredients in wellness products.

Growth Analysis of Agrimony Market in China

Sales of agrimony in China is expected to grow at a CAGR of 4% through 2035. The rising interest in traditional Chinese medicine (TCM) and natural ingredients is driving the demand for agrimony. As consumers increasingly adopt herbal remedies for various health benefits, agrimony’s use in supplements, teas, and medicinal products is growing.

Government policies promoting the use of herbal ingredients also support market growth. Agrimony’s role in promoting digestive health, along with its natural properties, is gaining attention among consumers seeking natural alternatives.

  • Rising adoption of herbal and traditional Chinese medicine in wellness.
  • Increased consumer interest in plant-based health solutions and supplements.
  • Government support for herbal ingredients in health and wellness products.

Agrimony Market Growth Outlook in India

The agrimony marketin India is expected to grow at a CAGR of 4.3% through 2035. As health consciousness grows in the country, agrimony’s demand as a natural remedy for digestive health is increasing. The herb is gaining popularity in the form of herbal teas, supplements, and health tonics. Agrimony’s use in alternative medicine and growing consumer awareness of its benefits are driving adoption. India’s expanding middle class, along with a shift toward plant-based and organic products, is expected to propel agrimony market growth.

  • Growing interest in natural health solutions and herbal remedies.
  • Rise in plant-based and organic product adoption in the wellness sector.
  • Increased awareness of agrimony’s benefits in digestive health management.

Agrimony Market Growth Outlook in Japan

Demand for agrimony in Japan is likely to grow at a CAGR of 4% through 2035. The aging population, alongside the increasing demand for natural health products, is driving agrimony’s adoption. Japanese consumers are turning to herbal remedies like agrimony to manage digestive health and promote wellness.

As the demand for plant-based and natural products rises, agrimony is becoming an important ingredient in supplements, teas, and functional foods. The country’s strong affinity for traditional and herbal medicine supports the growing popularity of agrimony.

  • Aging population driving demand for natural health and wellness products.
  • Rising adoption of agrimony in traditional and herbal medicine practices.
  • Growing interest in plant-based health solutions among Japanese consumers.

Leading Agrimony Market Suppliers

The agrimony market, is driven by a diverse range of suppliers, including seed companies, herbal product manufacturers, and specialty retailers. Key players such as Sheffield's Seed Company, Em's Herbals, and Strictly Medicinal Seeds are recognized for their extensive portfolios, including seeds and dried herbs for medicinal use.

These companies focus on product innovation, sustainability, and expanding distribution networks to meet growing demand for natural, organic herbal products. Emerging players like Gracie Deola's Natural Wellness Remedies, Sacred Plant Co, and Mountain Rose Herbs add to the market's dynamism. Significant companies such as Best Agrolife Ltd., Crystal Crop Protection Limited, BASF SE, Bayer AG, Syngenta AG, and CortevaAgriscience leverage their global presence and innovation to capture a share of the market.

Recent Agrimony Industry News

  • Best Agrolife Ltd. went on a product expansion trajectory by designing six brand new formulations out of which Amito, Promos, and Propique are included, with the target of providing farmers with effective yet inexpensive crop solutions and thus augmenting the productivity of farms.
  • Crystal Crop Protection Limited has announced to acquire the GRAMOXONE® trademark from Syngenta for the Indian market. This way, the company will further reinforce its position in the herbicide sector and will be able to support even more farmers from all around India.

Leading Agrimony Brands

  • Sheffield's Seed Company
  • Em's Herbals
  • Strictly Medicinal Seeds
  • Gracie Deola's Natural Wellness Remedies
  • Sacred Plant Co
  • Mountain Rose Herbs
  • Best Agrolife Ltd.
  • Crystal Crop Protection Limited
  • DhanukaAgritech
  • BASF SE
  • Bayer AG
  • UPL Limited
  • Syngenta AG
  • CortevaAgriscience

Research Coverage and Scope Summary

Report Attributes Details
Market Size (2025) USD 357.3 million
Market Size (2035) USD 604.6 million
CAGR (2025 to 2035) 5.4%
Base Year for Estimation 2024
Historical Period 2020 to 2024
Projections Period 2025 to 2035
Quantitative Units USD million for value and tons for volume
Forms Analyzed (Segment 1) Powder, Dried Leaf
Applications Analyzed (Segment 2) Pharmaceutical, Food & Beverage
Distribution Channels Analyzed (Segment 3) Store-Based Retail, Specialty Stores, Online Retail, Supermarkets, Hypermarkets
Regions Covered Global
Countries Covered United States, Canada, Germany, United Kingdom, France, Italy, Spain, China, India, Japan, South Korea, Australia, Brazil, Mexico, Argentina, Saudi Arabia, UAE, South Africa
Key Players Best Agrolife Ltd., Crystal Crop Protection Limited, Dhanuka Agritech , BASF SE, Bayer AG, UPL Limited, Syngenta AG, Corteva Agriscience
Additional Attributes Dollar sales, share by form and application, growing demand in pharmaceutical use, rising interest in herbal remedies, regional shifts in food & beverage applications, trends in sustainable agrimony production

Agrimony Market Analyzed by Key Investment Segments

By Form:

The market is segmented into powder and dried leaf form.

By Application:

Agrimony is applied in the pharmaceutical and food & beverage industries.

By Distribution Channel:

The market is segmented by distribution channels including store-based retail, specialty stores, online retail, supermarkets, and hypermarkets.

By Region:

The market is segmented into North America, Latin America, Western Europe, Eastern Europe, South Asia & Pacific, East Asia, Central Asia, Balkan and Baltic Countries, Russia and Belarus, and The Middle East & Africa.

Table of Content

  1. Executive Summary
    • Global Market Outlook
    • Demand-side Trends
    • Supply-side Trends
    • Technology Roadmap Analysis
    • Analysis and Recommendations
  2. Market Overview
    • Market Coverage / Taxonomy
    • Market Definition / Scope / Limitations
  3. Market Background
    • Market Dynamics
      • Drivers
      • Restraints
      • Opportunity
      • Trends
    • Scenario Forecast
      • Demand in Optimistic Scenario
      • Demand in Likely Scenario
      • Demand in Conservative Scenario
    • Opportunity Map Analysis
    • Product Life Cycle Analysis
    • Supply Chain Analysis
      • Supply Side Participants and their Roles
        • Producers
        • Mid-Level Participants (Traders/ Agents/ Brokers)
        • Wholesalers and Distributors
      • Value Added and Value Created at Node in the Supply Chain
      • List of Raw Material Suppliers
      • List of Existing and Potential Buyer’s
    • Investment Feasibility Matrix
    • Value Chain Analysis
      • Profit Margin Analysis
      • Wholesalers and Distributors
      • Retailers
    • PESTLE and Porter’s Analysis
    • Regulatory Landscape
      • By Key Regions
      • By Key Countries
    • Regional Parent Market Outlook
    • Production and Consumption Statistics
    • Import and Export Statistics
  4. Global Market Analysis 2020-2024 and Forecast, 2025-2035
    • Historical Market Size Value (USD Million) & Volume (Tons) Analysis, 2020-2024
    • Current and Future Market Size Value (USD Million) & Volume (Tons) Projections, 2025-2035
      • Y-o-Y Growth Trend Analysis
      • Absolute $ Opportunity Analysis
  5. Global Market Pricing Analysis 2020-2024 and Forecast 2025-2035
  6. Global Market Analysis 2020-2024 and Forecast 2025-2035, By Form
    • Introduction / Key Findings
    • Historical Market Size Value (USD Million) & Volume (Tons) Analysis By Form, 2020-2024
    • Current and Future Market Size Value (USD Million) & Volume (Tons) Analysis and Forecast By Form, 2025-2035
      • Powder
      • Dried leaf form
    • Y-o-Y Growth Trend Analysis By Form, 2020-2024
    • Absolute $ Opportunity Analysis By Form, 2025-2035
  7. Global Market Analysis 2020-2024 and Forecast 2025-2035, By Application
    • Introduction / Key Findings
    • Historical Market Size Value (USD Million) & Volume (Tons) Analysis By Application, 2020-2024
    • Current and Future Market Size Value (USD Million) & Volume (Tons) Analysis and Forecast By Application, 2025-2035
      • Pharmaceutical
      • Food and Beverage
    • Y-o-Y Growth Trend Analysis By Application, 2020-2024
    • Absolute $ Opportunity Analysis By Application, 2025-2035
  8. Global Market Analysis 2020-2024 and Forecast 2025-2035, By Distribution channel
    • Introduction / Key Findings
    • Historical Market Size Value (USD Million) & Volume (Tons) Analysis By Distribution channel, 2020-2024
    • Current and Future Market Size Value (USD Million) & Volume (Tons) Analysis and Forecast By Distribution channel, 2025-2035
      • Store Based Retail
      • Specialty Stores
      • Online Retail
      • Supermarkets
      • Hypermarkets
    • Y-o-Y Growth Trend Analysis By Distribution channel, 2020-2024
    • Absolute $ Opportunity Analysis By Distribution channel, 2025-2035
  9. Global Market Analysis 2020-2024 and Forecast 2025-2035, By Region
    • Introduction
    • Historical Market Size Value (USD Million) & Volume (Tons) Analysis By Region, 2020-2024
    • Current Market Size Value (USD Million) & Volume (Tons) Analysis and Forecast By Region, 2025-2035
      • North America
      • Latin America
      • Western Europe
      • Eastern Europe
      • East Asia
      • South Asia & Pacific
      • Middle East and Africa
    • Market Attractiveness Analysis By Region
  10. North America Market Analysis 2020-2024 and Forecast 2025-2035, By Country
    • Historical Market Size Value (USD Million) & Volume (Tons) Trend Analysis By Market Taxonomy, 2020-2024
    • Market Size Value (USD Million) & Volume (Tons) Forecast By Market Taxonomy, 2025-2035
      • By Country
        • USA
        • Canada
        • Mexico
      • By Form
      • By Application
      • By Distribution channel
    • Market Attractiveness Analysis
      • By Country
      • By Form
      • By Application
      • By Distribution channel
    • Key Takeaways
  11. Latin America Market Analysis 2020-2024 and Forecast 2025-2035, By Country
    • Historical Market Size Value (USD Million) & Volume (Tons) Trend Analysis By Market Taxonomy, 2020-2024
    • Market Size Value (USD Million) & Volume (Tons) Forecast By Market Taxonomy, 2025-2035
      • By Country
        • Brazil
        • Argentina
        • Rest of LATAM
      • By Form
      • By Application
      • By Distribution channel
    • Market Attractiveness Analysis
      • By Country
      • By Form
      • By Application
      • By Distribution channel
    • Key Takeaways
  12. Western Europe Market Analysis 2020-2024 and Forecast 2025-2035, By Country
    • Historical Market Size Value (USD Million) & Volume (Tons) Trend Analysis By Market Taxonomy, 2020-2024
    • Market Size Value (USD Million) & Volume (Tons) Forecast By Market Taxonomy, 2025-2035
      • By Country
        • Germany
        • Italy
        • France
        • UK
        • Spain
        • BENELUX
        • Nordic
        • Rest of W.Europe
      • By Form
      • By Application
      • By Distribution channel
    • Market Attractiveness Analysis
      • By Country
      • By Form
      • By Application
      • By Distribution channel
    • Key Takeaways
  13. Eastern Europe Market Analysis 2020-2024 and Forecast 2025-2035, By Country
    • Historical Market Size Value (USD Million) & Volume (Tons) Trend Analysis By Market Taxonomy, 2020-2024
    • Market Size Value (USD Million) & Volume (Tons) Forecast By Market Taxonomy, 2025-2035
      • By Country
        • Russia
        • Hungary
        • Poland
        • Balkan & Baltics
        • Rest of E. Europe
      • By Form
      • By Application
      • By Distribution channel
    • Market Attractiveness Analysis
      • By Country
      • By Form
      • By Application
      • By Distribution channel
    • Key Takeaways
  14. East Asia Market Analysis 2020-2024 and Forecast 2025-2035, By Country
    • Historical Market Size Value (USD Million) & Volume (Tons) Trend Analysis By Market Taxonomy, 2020-2024
    • Market Size Value (USD Million) & Volume (Tons) Forecast By Market Taxonomy, 2025-2035
      • By Country
        • China
        • Japan
        • South Korea
      • By Form
      • By Application
      • By Distribution channel
    • Market Attractiveness Analysis
      • By Country
      • By Form
      • By Application
      • By Distribution channel
    • Key Takeaways
  15. South Asia & Pacific Market Analysis 2020-2024 and Forecast 2025-2035, By Country
    • Historical Market Size Value (USD Million) & Volume (Tons) Trend Analysis By Market Taxonomy, 2020-2024
    • Market Size Value (USD Million) & Volume (Tons) Forecast By Market Taxonomy, 2025-2035
      • By Country
        • India
        • Australia & New Zealand
        • ASEAN
        • Rest of SAP
      • By Form
      • By Application
      • By Distribution channel
    • Market Attractiveness Analysis
      • By Country
      • By Form
      • By Application
      • By Distribution channel
    • Key Takeaways
  16. Middle East and Africa Market Analysis 2020-2024 and Forecast 2025-2035, By Country
    • Historical Market Size Value (USD Million) & Volume (Tons) Trend Analysis By Market Taxonomy, 2020-2024
    • Market Size Value (USD Million) & Volume (Tons) Forecast By Market Taxonomy, 2025-2035
      • By Country
        • GCC Countries
        • Northern Africa
        • South Africa
        • Turkiye
        • Rest of MEA
      • By Form
      • By Application
      • By Distribution channel
    • Market Attractiveness Analysis
      • By Country
      • By Form
      • By Application
      • By Distribution channel
    • Key Takeaways
  17. Key Countries Market Analysis
    • USA
      • Pricing Analysis
      • Market Share Analysis, 2024
        • By Form
        • By Application
        • By Distribution channel
    • Canada
      • Pricing Analysis
      • Market Share Analysis, 2024
        • By Form
        • By Application
        • By Distribution channel
    • Brazil
      • Pricing Analysis
      • Market Share Analysis, 2024
        • By Form
        • By Application
        • By Distribution channel
    • Mexico
      • Pricing Analysis
      • Market Share Analysis, 2024
        • By Form
        • By Application
        • By Distribution channel
    • Argentina
      • Pricing Analysis
      • Market Share Analysis, 2024
        • By Form
        • By Application
        • By Distribution channel
  18. Market Structure Analysis
    • Competition Dashboard
    • Competition Benchmarking
    • Market Share Analysis of Top Players
      • By Regional
      • By Form
      • By Application
      • By Distribution channel
  19. Competition Analysis
    • Competition Deep Dive
      • Sheffield's Seed Company
        • Overview
        • Product Portfolio
        • Profitability by Market Segments (Product/Age /Sales Channel/Region)
        • Sales Footprint
        • Strategy Overview
          • Marketing Strategy
          • Product Strategy
          • Channel Strategy
      • Em's Herbals
        • Overview
        • Product Portfolio
        • Profitability by Market Segments (Product/Age /Sales Channel/Region)
        • Sales Footprint
        • Strategy Overview
          • Marketing Strategy
          • Product Strategy
          • Channel Strategy
      • Strictly Medicinal Seeds
        • Overview
        • Product Portfolio
        • Profitability by Market Segments (Product/Age /Sales Channel/Region)
        • Sales Footprint
        • Strategy Overview
          • Marketing Strategy
          • Product Strategy
          • Channel Strategy
      • Gracie Deola's Natural Wellness Remedies
        • Overview
        • Product Portfolio
        • Profitability by Market Segments (Product/Age /Sales Channel/Region)
        • Sales Footprint
        • Strategy Overview
          • Marketing Strategy
          • Product Strategy
          • Channel Strategy
      • Sacred Plant Co
        • Overview
        • Product Portfolio
        • Profitability by Market Segments (Product/Age /Sales Channel/Region)
        • Sales Footprint
        • Strategy Overview
          • Marketing Strategy
          • Product Strategy
          • Channel Strategy
      • Mountain Rose Herbs
        • Overview
        • Product Portfolio
        • Profitability by Market Segments (Product/Age /Sales Channel/Region)
        • Sales Footprint
        • Strategy Overview
          • Marketing Strategy
          • Product Strategy
          • Channel Strategy
      • Best Agrolife Ltd.
        • Overview
        • Product Portfolio
        • Profitability by Market Segments (Product/Age /Sales Channel/Region)
        • Sales Footprint
        • Strategy Overview
          • Marketing Strategy
          • Product Strategy
          • Channel Strategy
      • Crystal Crop Protection Limited
        • Overview
        • Product Portfolio
        • Profitability by Market Segments (Product/Age /Sales Channel/Region)
        • Sales Footprint
        • Strategy Overview
          • Marketing Strategy
          • Product Strategy
          • Channel Strategy
      • Dhanuka Agritech
        • Overview
        • Product Portfolio
        • Profitability by Market Segments (Product/Age /Sales Channel/Region)
        • Sales Footprint
        • Strategy Overview
          • Marketing Strategy
          • Product Strategy
          • Channel Strategy
      • BASF SE
        • Overview
        • Product Portfolio
        • Profitability by Market Segments (Product/Age /Sales Channel/Region)
        • Sales Footprint
        • Strategy Overview
          • Marketing Strategy
          • Product Strategy
          • Channel Strategy
      • Bayer AG
        • Overview
        • Product Portfolio
        • Profitability by Market Segments (Product/Age /Sales Channel/Region)
        • Sales Footprint
        • Strategy Overview
          • Marketing Strategy
          • Product Strategy
          • Channel Strategy
      • UPL Limited
        • Overview
        • Product Portfolio
        • Profitability by Market Segments (Product/Age /Sales Channel/Region)
        • Sales Footprint
        • Strategy Overview
          • Marketing Strategy
          • Product Strategy
          • Channel Strategy
      • Syngenta AG
        • Overview
        • Product Portfolio
        • Profitability by Market Segments (Product/Age /Sales Channel/Region)
        • Sales Footprint
        • Strategy Overview
          • Marketing Strategy
          • Product Strategy
          • Channel Strategy
      • Corteva Agriscience
        • Overview
        • Product Portfolio
        • Profitability by Market Segments (Product/Age /Sales Channel/Region)
        • Sales Footprint
        • Strategy Overview
          • Marketing Strategy
          • Product Strategy
          • Channel Strategy
  20. Assumptions & Acronyms Used
  21. Research Methodology

List of Tables

  • Table 1: Global Market Value (USD Million) Forecast by Region, 2020-2035
  • Table 2: Global Market Volume (Tons) Forecast by Region, 2020-2035
  • Table 3: Global Market Value (USD Million) Forecast by Form, 2020-2035
  • Table 4: Global Market Volume (Tons) Forecast by Form, 2020-2035
  • Table 5: Global Market Value (USD Million) Forecast by Application, 2020-2035
  • Table 6: Global Market Volume (Tons) Forecast by Application, 2020-2035
  • Table 7: Global Market Value (USD Million) Forecast by Distribution channel, 2020-2035
  • Table 8: Global Market Volume (Tons) Forecast by Distribution channel, 2020-2035
  • Table 9: North America Market Value (USD Million) Forecast by Country, 2020-2035
  • Table 10: North America Market Volume (Tons) Forecast by Country, 2020-2035
  • Table 11: North America Market Value (USD Million) Forecast by Form, 2020-2035
  • Table 12: North America Market Volume (Tons) Forecast by Form, 2020-2035
  • Table 13: North America Market Value (USD Million) Forecast by Application, 2020-2035
  • Table 14: North America Market Volume (Tons) Forecast by Application, 2020-2035
  • Table 15: North America Market Value (USD Million) Forecast by Distribution channel, 2020-2035
  • Table 16: North America Market Volume (Tons) Forecast by Distribution channel, 2020-2035
  • Table 17: Latin America Market Value (USD Million) Forecast by Country, 2020-2035
  • Table 18: Latin America Market Volume (Tons) Forecast by Country, 2020-2035
  • Table 19: Latin America Market Value (USD Million) Forecast by Form, 2020-2035
  • Table 20: Latin America Market Volume (Tons) Forecast by Form, 2020-2035
  • Table 21: Latin America Market Value (USD Million) Forecast by Application, 2020-2035
  • Table 22: Latin America Market Volume (Tons) Forecast by Application, 2020-2035
  • Table 23: Latin America Market Value (USD Million) Forecast by Distribution channel, 2020-2035
  • Table 24: Latin America Market Volume (Tons) Forecast by Distribution channel, 2020-2035
  • Table 25: Western Europe Market Value (USD Million) Forecast by Country, 2020-2035
  • Table 26: Western Europe Market Volume (Tons) Forecast by Country, 2020-2035
  • Table 27: Western Europe Market Value (USD Million) Forecast by Form, 2020-2035
  • Table 28: Western Europe Market Volume (Tons) Forecast by Form, 2020-2035
  • Table 29: Western Europe Market Value (USD Million) Forecast by Application, 2020-2035
  • Table 30: Western Europe Market Volume (Tons) Forecast by Application, 2020-2035
  • Table 31: Western Europe Market Value (USD Million) Forecast by Distribution channel, 2020-2035
  • Table 32: Western Europe Market Volume (Tons) Forecast by Distribution channel, 2020-2035
  • Table 33: Eastern Europe Market Value (USD Million) Forecast by Country, 2020-2035
  • Table 34: Eastern Europe Market Volume (Tons) Forecast by Country, 2020-2035
  • Table 35: Eastern Europe Market Value (USD Million) Forecast by Form, 2020-2035
  • Table 36: Eastern Europe Market Volume (Tons) Forecast by Form, 2020-2035
  • Table 37: Eastern Europe Market Value (USD Million) Forecast by Application, 2020-2035
  • Table 38: Eastern Europe Market Volume (Tons) Forecast by Application, 2020-2035
  • Table 39: Eastern Europe Market Value (USD Million) Forecast by Distribution channel, 2020-2035
  • Table 40: Eastern Europe Market Volume (Tons) Forecast by Distribution channel, 2020-2035
  • Table 41: East Asia Market Value (USD Million) Forecast by Country, 2020-2035
  • Table 42: East Asia Market Volume (Tons) Forecast by Country, 2020-2035
  • Table 43: East Asia Market Value (USD Million) Forecast by Form, 2020-2035
  • Table 44: East Asia Market Volume (Tons) Forecast by Form, 2020-2035
  • Table 45: East Asia Market Value (USD Million) Forecast by Application, 2020-2035
  • Table 46: East Asia Market Volume (Tons) Forecast by Application, 2020-2035
  • Table 47: East Asia Market Value (USD Million) Forecast by Distribution channel, 2020-2035
  • Table 48: East Asia Market Volume (Tons) Forecast by Distribution channel, 2020-2035
  • Table 49: South Asia & Pacific Market Value (USD Million) Forecast by Country, 2020-2035
  • Table 50: South Asia & Pacific Market Volume (Tons) Forecast by Country, 2020-2035
  • Table 51: South Asia & Pacific Market Value (USD Million) Forecast by Form, 2020-2035
  • Table 52: South Asia & Pacific Market Volume (Tons) Forecast by Form, 2020-2035
  • Table 53: South Asia & Pacific Market Value (USD Million) Forecast by Application, 2020-2035
  • Table 54: South Asia & Pacific Market Volume (Tons) Forecast by Application, 2020-2035
  • Table 55: South Asia & Pacific Market Value (USD Million) Forecast by Distribution channel, 2020-2035
  • Table 56: South Asia & Pacific Market Volume (Tons) Forecast by Distribution channel, 2020-2035
  • Table 57: Middle East and Africa Market Value (USD Million) Forecast by Country, 2020-2035
  • Table 58: Middle East and Africa Market Volume (Tons) Forecast by Country, 2020-2035
  • Table 59: Middle East and Africa Market Value (USD Million) Forecast by Form, 2020-2035
  • Table 60: Middle East and Africa Market Volume (Tons) Forecast by Form, 2020-2035
  • Table 61: Middle East and Africa Market Value (USD Million) Forecast by Application, 2020-2035
  • Table 62: Middle East and Africa Market Volume (Tons) Forecast by Application, 2020-2035
  • Table 63: Middle East and Africa Market Value (USD Million) Forecast by Distribution channel, 2020-2035
  • Table 64: Middle East and Africa Market Volume (Tons) Forecast by Distribution channel, 2020-2035

List of Figures

  • Figure 1: Global Market Volume (Tons) Forecast 2020-2035
  • Figure 2: Global Market Pricing Analysis
  • Figure 3: Global Market Value (USD Million) Forecast 2020-2035
  • Figure 4: Global Market Value Share and BPS Analysis by Form, 2025 and 2035
  • Figure 5: Global Market Y-o-Y Growth Comparison by Form, 2025-2035
  • Figure 6: Global Market Attractiveness Analysis by Form
  • Figure 7: Global Market Value Share and BPS Analysis by Application, 2025 and 2035
  • Figure 8: Global Market Y-o-Y Growth Comparison by Application, 2025-2035
  • Figure 9: Global Market Attractiveness Analysis by Application
  • Figure 10: Global Market Value Share and BPS Analysis by Distribution channel, 2025 and 2035
  • Figure 11: Global Market Y-o-Y Growth Comparison by Distribution channel, 2025-2035
  • Figure 12: Global Market Attractiveness Analysis by Distribution channel
  • Figure 13: Global Market Value (USD Million) Share and BPS Analysis by Region, 2025 and 2035
  • Figure 14: Global Market Y-o-Y Growth Comparison by Region, 2025-2035
  • Figure 15: Global Market Attractiveness Analysis by Region
  • Figure 16: North America Market Incremental $ Opportunity, 2025-2035
  • Figure 17: Latin America Market Incremental $ Opportunity, 2025-2035
  • Figure 18: Western Europe Market Incremental $ Opportunity, 2025-2035
  • Figure 19: Eastern Europe Market Incremental $ Opportunity, 2025-2035
  • Figure 20: East Asia Market Incremental $ Opportunity, 2025-2035
  • Figure 21: South Asia & Pacific Market Incremental $ Opportunity, 2025-2035
  • Figure 22: Middle East and Africa Market Incremental $ Opportunity, 2025-2035
  • Figure 23: North America Market Value Share and BPS Analysis by Country, 2025 and 2035
  • Figure 24: North America Market Value Share and BPS Analysis by Form, 2025 and 2035
  • Figure 25: North America Market Y-o-Y Growth Comparison by Form, 2025-2035
  • Figure 26: North America Market Attractiveness Analysis by Form
  • Figure 27: North America Market Value Share and BPS Analysis by Application, 2025 and 2035
  • Figure 28: North America Market Y-o-Y Growth Comparison by Application, 2025-2035
  • Figure 29: North America Market Attractiveness Analysis by Application
  • Figure 30: North America Market Value Share and BPS Analysis by Distribution channel, 2025 and 2035
  • Figure 31: North America Market Y-o-Y Growth Comparison by Distribution channel, 2025-2035
  • Figure 32: North America Market Attractiveness Analysis by Distribution channel
  • Figure 33: Latin America Market Value Share and BPS Analysis by Country, 2025 and 2035
  • Figure 34: Latin America Market Value Share and BPS Analysis by Form, 2025 and 2035
  • Figure 35: Latin America Market Y-o-Y Growth Comparison by Form, 2025-2035
  • Figure 36: Latin America Market Attractiveness Analysis by Form
  • Figure 37: Latin America Market Value Share and BPS Analysis by Application, 2025 and 2035
  • Figure 38: Latin America Market Y-o-Y Growth Comparison by Application, 2025-2035
  • Figure 39: Latin America Market Attractiveness Analysis by Application
  • Figure 40: Latin America Market Value Share and BPS Analysis by Distribution channel, 2025 and 2035
  • Figure 41: Latin America Market Y-o-Y Growth Comparison by Distribution channel, 2025-2035
  • Figure 42: Latin America Market Attractiveness Analysis by Distribution channel
  • Figure 43: Western Europe Market Value Share and BPS Analysis by Country, 2025 and 2035
  • Figure 44: Western Europe Market Value Share and BPS Analysis by Form, 2025 and 2035
  • Figure 45: Western Europe Market Y-o-Y Growth Comparison by Form, 2025-2035
  • Figure 46: Western Europe Market Attractiveness Analysis by Form
  • Figure 47: Western Europe Market Value Share and BPS Analysis by Application, 2025 and 2035
  • Figure 48: Western Europe Market Y-o-Y Growth Comparison by Application, 2025-2035
  • Figure 49: Western Europe Market Attractiveness Analysis by Application
  • Figure 50: Western Europe Market Value Share and BPS Analysis by Distribution channel, 2025 and 2035
  • Figure 51: Western Europe Market Y-o-Y Growth Comparison by Distribution channel, 2025-2035
  • Figure 52: Western Europe Market Attractiveness Analysis by Distribution channel
  • Figure 53: Eastern Europe Market Value Share and BPS Analysis by Country, 2025 and 2035
  • Figure 54: Eastern Europe Market Value Share and BPS Analysis by Form, 2025 and 2035
  • Figure 55: Eastern Europe Market Y-o-Y Growth Comparison by Form, 2025-2035
  • Figure 56: Eastern Europe Market Attractiveness Analysis by Form
  • Figure 57: Eastern Europe Market Value Share and BPS Analysis by Application, 2025 and 2035
  • Figure 58: Eastern Europe Market Y-o-Y Growth Comparison by Application, 2025-2035
  • Figure 59: Eastern Europe Market Attractiveness Analysis by Application
  • Figure 60: Eastern Europe Market Value Share and BPS Analysis by Distribution channel, 2025 and 2035
  • Figure 61: Eastern Europe Market Y-o-Y Growth Comparison by Distribution channel, 2025-2035
  • Figure 62: Eastern Europe Market Attractiveness Analysis by Distribution channel
  • Figure 63: East Asia Market Value Share and BPS Analysis by Country, 2025 and 2035
  • Figure 64: East Asia Market Value Share and BPS Analysis by Form, 2025 and 2035
  • Figure 65: East Asia Market Y-o-Y Growth Comparison by Form, 2025-2035
  • Figure 66: East Asia Market Attractiveness Analysis by Form
  • Figure 67: East Asia Market Value Share and BPS Analysis by Application, 2025 and 2035
  • Figure 68: East Asia Market Y-o-Y Growth Comparison by Application, 2025-2035
  • Figure 69: East Asia Market Attractiveness Analysis by Application
  • Figure 70: East Asia Market Value Share and BPS Analysis by Distribution channel, 2025 and 2035
  • Figure 71: East Asia Market Y-o-Y Growth Comparison by Distribution channel, 2025-2035
  • Figure 72: East Asia Market Attractiveness Analysis by Distribution channel
  • Figure 73: South Asia & Pacific Market Value Share and BPS Analysis by Country, 2025 and 2035
  • Figure 74: South Asia & Pacific Market Value Share and BPS Analysis by Form, 2025 and 2035
  • Figure 75: South Asia & Pacific Market Y-o-Y Growth Comparison by Form, 2025-2035
  • Figure 76: South Asia & Pacific Market Attractiveness Analysis by Form
  • Figure 77: South Asia & Pacific Market Value Share and BPS Analysis by Application, 2025 and 2035
  • Figure 78: South Asia & Pacific Market Y-o-Y Growth Comparison by Application, 2025-2035
  • Figure 79: South Asia & Pacific Market Attractiveness Analysis by Application
  • Figure 80: South Asia & Pacific Market Value Share and BPS Analysis by Distribution channel, 2025 and 2035
  • Figure 81: South Asia & Pacific Market Y-o-Y Growth Comparison by Distribution channel, 2025-2035
  • Figure 82: South Asia & Pacific Market Attractiveness Analysis by Distribution channel
  • Figure 83: Middle East and Africa Market Value Share and BPS Analysis by Country, 2025 and 2035
  • Figure 84: Middle East and Africa Market Value Share and BPS Analysis by Form, 2025 and 2035
  • Figure 85: Middle East and Africa Market Y-o-Y Growth Comparison by Form, 2025-2035
  • Figure 86: Middle East and Africa Market Attractiveness Analysis by Form
  • Figure 87: Middle East and Africa Market Value Share and BPS Analysis by Application, 2025 and 2035
  • Figure 88: Middle East and Africa Market Y-o-Y Growth Comparison by Application, 2025-2035
  • Figure 89: Middle East and Africa Market Attractiveness Analysis by Application
  • Figure 90: Middle East and Africa Market Value Share and BPS Analysis by Distribution channel, 2025 and 2035
  • Figure 91: Middle East and Africa Market Y-o-Y Growth Comparison by Distribution channel, 2025-2035
  • Figure 92: Middle East and Africa Market Attractiveness Analysis by Distribution channel
  • Figure 93: Global Market - Tier Structure Analysis
  • Figure 94: Global Market - Company Share Analysis

Frequently Asked Questions

What is the projected market value of the agrimony market by 2035?

The industry is expected to reach USD 604.6 million by 2035.

What is the forecasted CAGR of the agrimony market from 2025 to 2035?

The industry is projected to grow at a CAGR of 5.4% from 2025 to 2035.

Which product segment will dominate the agrimony market in 2025?

The agrimony powder segment is expected to lead with a 55% share in 2025.

Which region is expected to experience the highest growth in the agrimony market?

South Asia, particularly India, is expected to grow at a 4.3% CAGR.

Who is the leading company in the agrimony market and its market share?

Sheffield's Seed Company leads the industry with a 12% market share.

Future Market Insights

Agrimony Market