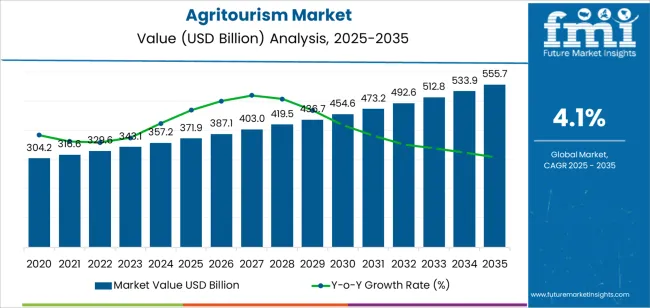
The agritourism market is experiencing consistent growth, supported by rising consumer interest in sustainable travel, rural experiences, and farm-based education. Industry publications and tourism board reports have emphasized a shift toward experiential travel, where tourists are seeking authentic, hands-on agricultural activities.
Government incentives and rural development programs have also encouraged farm owners to diversify income sources by incorporating tourism services. Agricultural ministries and regional tourism authorities have reported increased funding for infrastructure upgrades and promotional campaigns aimed at boosting local agritourism ecosystems.
Additionally, rising awareness around organic farming, wellness, and ecological conservation has aligned with tourist preferences for educational and environmentally conscious travel. Press releases from travel platforms have shown growing bookings for rural stays and seasonal farm visits, particularly in regions with established agricultural heritage. Looking ahead, digital marketing, eco-certification programs, and mobile booking solutions are expected to broaden the market’s reach. Segmental growth is being driven by the popularity of on-farm sales activities, group travel formats, and strong male participation in rural tourism experiences.
| Metric | Value |
|---|---|
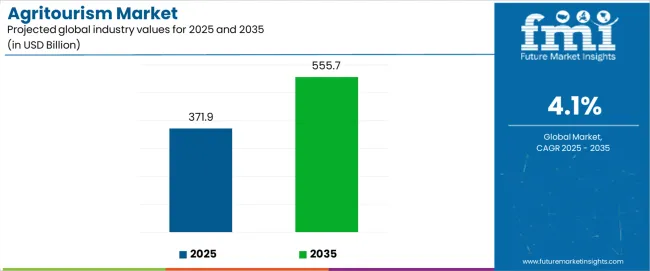
| Agritourism Market Estimated Value in (2025 E) | USD 371.9 billion |
| Agritourism Market Forecast Value in (2035 F) | USD 555.7 billion |
| Forecast CAGR (2025 to 2035) | 4.1% |
The market is segmented by Activity, Tour, Demographics, Age Group, and Booking Channel and region. By Activity, the market is divided into On-farm Sales, Outdoor Recreation, Entertainment, Educational Tourism, Accommodations, and Others. In terms of Tour, the market is classified into Group Travelers and Individual Travelers. Based on Demographics, the market is segmented into Men, Women, and Kids. By Age Group, the market is divided into 26-35, 15-25, 36-45, 46-55, and 55 Years Above. By Booking Channel, the market is segmented into Online and Offline. Regionally, the market is classified into North America, Latin America, Western Europe, Eastern Europe, Balkan & Baltic Countries, Russia & Belarus, Central Asia, East Asia, South Asia & Pacific, and the Middle East & Africa.
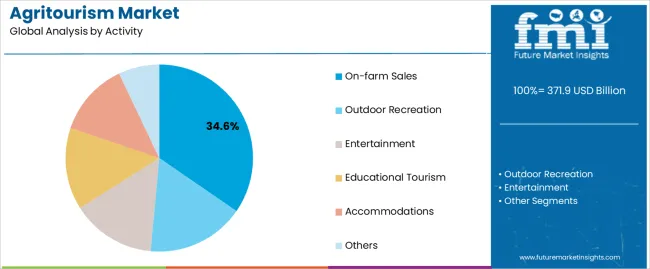
The On-farm Sales segment is projected to contribute 34.6% of the agritourism market revenue in 2025, establishing it as the leading activity segment. This growth has been influenced by tourists’ desire to purchase farm-fresh produce directly from growers, enhancing the authenticity and economic impact of their visits.
Farmers have capitalized on this demand by offering curated sales experiences, including harvest picking, local product tastings, and craft displays. Trade publications and rural development reports have pointed to the high profitability of on-site sales as a supplementary revenue stream for farms.
Moreover, tourists have increasingly valued the transparency and traceability of food products, boosting direct purchases. Seasonal produce events, farmer’s markets hosted on agricultural estates, and culinary tourism packages have further elevated interest in this segment. With expanding consumer focus on local sourcing and agri-lifestyle experiences, the On-farm Sales segment is expected to remain a cornerstone of agritourism activity offerings.
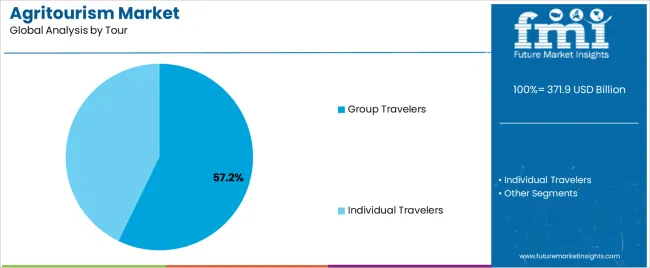
The Group Travelers segment is projected to account for 57.2% of the agritourism market revenue in 2025, securing its position as the leading tour format. This segment’s growth has been driven by the structured nature of group tours, which facilitate access to remote farm locations and offer guided educational experiences.
Travel agencies and regional tourism boards have promoted group itineraries tailored to school trips, corporate retreats, and eco-tourism clubs. Press releases from travel operators have highlighted rising demand for bundled farm tour experiences that include meals, activities, and transportation, offering convenience and value.
Additionally, group formats have allowed farms to optimize resource use, with guided tours improving safety, logistics, and visitor engagement. Community-based tourism projects have also preferred group formats to manage visitor flow and maximize cultural exchange. As collective travel continues to appeal to eco-conscious and educational audiences, the Group Travelers segment is expected to retain its leading market position.
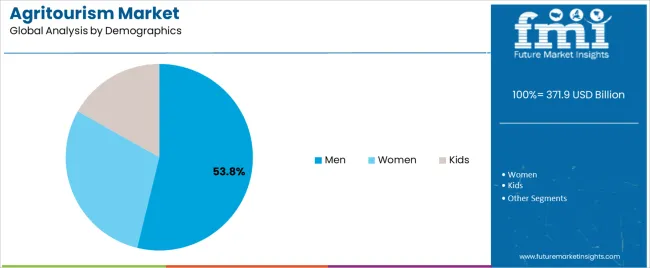
The Men segment is projected to capture 53.8% of the agritourism market revenue in 2025, maintaining its lead among demographic groups. Growth in this segment has been shaped by rising interest among male travelers in agricultural heritage, outdoor exploration, and farm-based adventure activities.
Tourism trend analyses have noted that male tourists increasingly participate in activities such as orchard tours, animal care demonstrations, and vineyard-based culinary workshops. Additionally, agritourism destinations offering camping, fishing, and off-road farm tours have seen strong male engagement.
Marketing campaigns targeting men’s wellness retreats, culinary tastings, and weekend rural escapes have supported segment expansion. Data from regional tourism councils have shown higher repeat visit rates among male travelers, particularly in destinations with active, hands-on experiences. As agritourism continues to evolve beyond passive sightseeing toward immersive experiences, the Men segment is expected to remain a key contributor to market revenue.
Below table presents the expected CAGR for the global agritourism market over several semi-annual periods spanning from 2025 to 2035. First half (H1) from 2020 to 2025, the sector is seen to have growth of CAGR 2.9%, followed by growing numbers of 4.3% in the second half (H2) of the same decade.
| Particular | Value CAGR |
|---|---|
| H1 | 2.9% (2020 to 2025) |
| H2 | 4.3% (2020 to 2025) |
| H1 | 3.6% (2025 to 2035) |
| H2 | 4.6% (2025 to 2035) |
Moving forward to the subsequent period from H1 2025 to H2 2035, the CAGR is foreseen to surge from 3.6% in the first half to 4.6% in the second half.
The increasing demand for authentic rural experience and growing interest in sustainable and eco-friendly travel generated scope for the agritourism sector. This type of tourism offers unique opportunities to experience rural life on a farm, local food production, and rural culture. As a consequence, more people escape from urban environments and get tuned to nature, so the industry is growing.
The growing global consciousness towards sustainability and environmental impact is motivating tourists to take up locations for agritourism that feature organic farming and low-impact living. These two point factors are drivers for the agritourism market, allowing the preservation of rural heritage and environmental conservation.
Social media and online platforms have shaped and enhanced the reach of this sector to a wider audience globally. Government support and investments in rural tourism infrastructure also play a crucial role in fostering growth. Initiatives like funding for farm accommodation, marketing campaigns, and training programs for farmers in hospitality management and customer service offered the best experience augmenting development.
These efforts increased the sector’s competitiveness and stimulated local economies by creating jobs and supporting small businesses. Future of agritourism and emerging trends are promising health outlooks for this landscape, generating profits for both corners.
Inadequate infrastructure and poor accessibility to rural areas can deter tourists' experience. Also, complex regulations and bureaucratic procedures can cause barriers for small-scale farmers. Balancing tourism activities with the sustainability of the agricultural ecosystem is vital. Thus, it poses an agritourism market challenge to many operators.
Additionally, another prime factor posing challenges in the growth of agritourism is farmers and rural communities often lack the skills needed to manage tourism activities.
The global agritourism market outlook showed a steady fall in its initial period. With USD 371.9 million in 2025, the industry has seen a peak. With a 3.6% CAGR from 2020 to 2025, the industry has generated very low income with the pandemic, and people were unaware of these activities. Also, government initiatives and promotions weren't very active back then, focusing on sustainability. Trend of organic farming also just started making growing opportunities for expansion.
Tourism was one of the worst-hit industries facing severe economic loss during the pandemic. But with the virus spreading fast in urban setups, where the population is densely high, motivated travelers in upcoming to opt for rural and nature tourism for refreshments.
This helps the industry to take a new turn, curating more opportunities and designing new setups to generate more tourist pools to have hotspots for nature clubs. Thus, with increasing interest, people arranging family reunions, gatherings, cooperate events, and leisure refreshments ignited the scope for agritourism globally.
With increasing emphasis on leisure time with nature, activities educating people about soil and water game, also a sense of rural culture to relax from the urban rush influenced market growth. Pollution-free environment, fresh foods, recreational activities, and other health benefits related to agritourism encourage people to opt for it actively.
The agritourism industry estimated a CAGR of 4.1% from 2025 to 2035. The government and many companies are focusing on agricultural campaigns and organizing events to boost awareness regarding agritourism among people. Focus on improvement in agroindustry; companies are creating awareness and interest among the population about the importance of sustainability. Also, advancements in social media and marketing strategies have generated big revenue in this landscape.
Tier 1 companies are well-positioned to attract a broad demographic, including eco-conscious travelers, families, and adventure seekers. They are successfully tapped into the rising demand for authentic and immersive farm experiences. They offer diverse accommodations and activities across various locations. Their expansion is focused on strategic partnerships with local farms, aggressive marketing campaigns, and a strong online presence.
This all makes the booking experience seamless for travelers. By continuously offering their services like incorporating luxury amenities and curated experiences, they make a top place in the global agritourism market. Farm Stay USA, Agri-Tourism World, Farmhouse Inns, and Harvest Hosts are tier-1 companies solidifying their dominance in the global industrial landscape.
Rural Bounty, Leaping Lamb Farm, Monteillet Fromagerie, Blue Hill Farm, and Spur Cross Ranch Conservation Area are tier 2 companies expanding in this sector. These companies, by leveraging their niche appeal and unique offerings, are developing fast. These businesses focus on providing personalized and specialized experiences that emphasize local culture and artisanal practices.
Tier 3 companies are growing by capitalizing on their local charm and dedicated customer base. These smaller, often family-run operators focus on delivering an authentic rural experience with a high degree of personal interaction and hospitality.
Tier 3 companies can differentiate themselves from larger competitors and attract travelers looking for genuine, off-the-beaten-path experiences. Some prominent tier 3 companies are Smithfield Farm Bed & Breakfast, Liberty Hill Farm & Inn, Blackberry Farm, McMillian Farm, and Peaceful River Farm.
Different activities have popularity in agritourism events. Still, overnight stays excel, providing a better experience and nearer nature's touch. Also, this industry has different tour traveler types like individual and group. Below given tables summarize value share and the data provided summarizes trends, growth opportunities, and also popularity of specific segments.
Overnight stays are often more comprehensive and immersive experiences that day trips cannot match. Visitors often seek to escape from urban environments and experience rural life in a more authentic and relaxed manner.
Overnight stay offers engagement with daily rhythms and lives with various farm activities post-evening. Participation in activities like milking cows, collecting eggs, harvesting crops, and enjoying the beauty and tranquility of the countryside is what the urbanized populace enjoys here.
| Segment | Overnight Stay (Activities) |
|---|---|
| Value Share (2025) | 26.5% |
Overnight stays have covered 26.5% of the value share for 2025. This extended exposure enhances the overall experience by creating a stronger emotional connection with the rural lifestyle and local culture. This also makes the visitor’s visit more memorable and meaningful.
Thus, it is considered and is popular activity form of the agritourism industry. Also, the packages offered by companies have feasible rates for 24-hour durations. With travel versatility and also relaxation, overstay stay is considered as safe and fascinating to visitors.
Group travelers experience structured and social experiences that enhance the enjoyment and educational aspects of agritourism activities. Group travel allows participants to share experiences, learn together, and engage in collaborative activities. This can particularly be appealing in a farm setting. Activities like educational tours, workshops, and hands-on farming, winemaking, cheese making, etc., are more enjoyable and effective when learning with a group.
| Segment | Group Travelers (Tour Type) |
|---|---|
| Value Share (2025) | 79.2% |
Group travelers have covered and are popular in the agritourism market with an outstanding value share of 79.2% for 2025. Operators can optimize resources and plan activities more efficiently for groups. This often results in higher occupancy rates and better utilization of facilities.
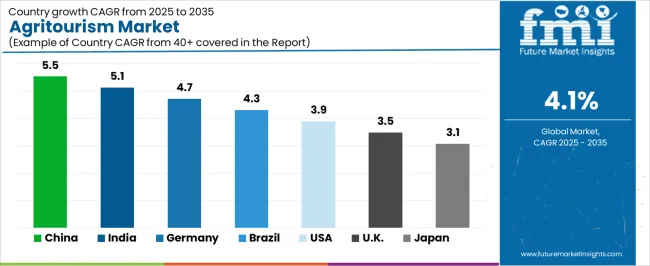
The below table comprises of CAGRs of different countries expanding in the agritourism market. Australia, with the highest value share and many ongoing projects enrolling women empowerment and increasing stability, has spurred the visibility and fame of this tourism there.
Also, many Asian countries with the presence of many lands presenting opportunities to expand have gained huge tourist pools with better outcomes. Data provided summarizes current trends, recent projects, and advancements in this sector.
| Countries | CAGR from 2025 to 2035 |
|---|---|
| Australia | 6.6% |
| India | 4.8% |
| China | 4.5% |
| Germany | 3.7% |
| United States | 2.5% |
The Australian government is taking a big take on encouraging agritourism activities in the country. Leveraging their strength and promoting sustainable and eco-friendly activities to convince interstate travelers to visit and get grounded with authentic experiences.
Also, a stop to increase the tourism activity of Australia, people are engaging tourists with food and wine experiences as gateways to many memorable experiences through agritourism visits.
Tasmania and South Australia are states competing most closely to offer this environment closure experience. Also, Western Australia takes advantage of associations with diverse landscapes, Indigenous culture, road trips, and stunning coastlines to strengthen agrotourism around these places.
For example, In April 2025, Assisi Aid Projects Australia announced the launch of a new short-term project called Jajal Wae Sustainable Agri-Tourism in partnership with Dreamdelion Indonesia.
This partnership enhanced and aimed at [empowering women in rural India to build their economic stability. Promoting gourmet escapes, food and wine trails, and coastal destinations, Australia is enrooting many opportunities and making big bucks with the availability of many resources to explore.
Presence of a large number of farms in the Asia-Pacific region presents many growth opportunities for agritourism farms. India, with its tradition of farming and huge grounds offering spaces for these activities, has spurred in agritourism market.
With many affluent, middle-class, and also cooperative populace attracted towards activities held in countryside regions, have increased spending on agritourism at a rapid pace.
India is estimated to register a CAGR of 6.6% from 2025 to 2035. Agritourism trend in India is gaining popularity, bringing benefits to both farmers and tourists. Agritourism is becoming a significant tourist development opportunity in India as people are shifting to urban cities and lose touch with where their food is grown.
For example, in September 2024, Kerala, a tourism-driven state in India, announced the launch of the Agri Tourism Network to build better farm tourism infrastructure and assist the growth of this sector in Kerala.
Prominent companies in the United States influence the promotion and growth of this sustainable activity.
Companies like Liberty Hill Farm, Harvest Travel International, and STAR Destinations show a big impact on the overall development of the agritourism market in the United States. The United States has thus shown steady-paced growth with an estimated CAGR of 2.5% through 2035.
In October 2025, the United State Department of Agriculture announced grant awards to strengthen local and regional food systems. Funds were distributed through Local Agriculture Market Programs, Farmers Markets, and Local Food Promotion Programs grant programs. Agrotourism is considered one of the project fields, along with other fields receiving funds for infrastructure development.
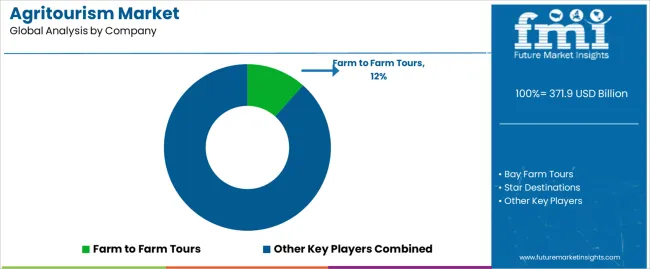
The industry is highly fragmented, with a large number of small and large key players existing in different regions. High fragmentation is due to varying technical definitions across different countries and regions.
The sector is expected to showcase increased consolidation with rising collaboration between agrotourism firms and a rising number of acquisitions and partnerships. Also, engaging people with soil is tsk of fun this day as every other individual is opting for relaxation, calm, and soothing activities. Engagement in these activities has facilitated the growth of this landscape globally.
Industry Update
Overnight stay, special events and festivals, off the farm, and recreation activities and events are categorized activities in the agritourism market.
The agritourism industry is bifurcated into group and individual travelers.
The segment is distributed to men, women, and kids.
The sector is subdivided into 15-25, 26-36, 36-45, 46-55, and 55 years and above age groups.
Online and offline are two booking channels included in this sector.
A regional analysis has been carried out in key countries of North America, Latin America, Asia Pacific, Middle East and Africa (MEA), and Europe.
The global agritourism market is estimated to be valued at USD 371.9 billion in 2025.
The market size for the agritourism market is projected to reach USD 555.7 billion by 2035.
The agritourism market is expected to grow at a 4.1% CAGR between 2025 and 2035.
The key product types in agritourism market are on-farm sales, outdoor recreation, entertainment, educational tourism, accommodations and others.
In terms of tour, group travelers segment to command 57.2% share in the agritourism market in 2025.


Our Research Products

The "Full Research Suite" delivers actionable market intel, deep dives on markets or technologies, so clients act faster, cut risk, and unlock growth.

The Leaderboard benchmarks and ranks top vendors, classifying them as Established Leaders, Leading Challengers, or Disruptors & Challengers.

Locates where complements amplify value and substitutes erode it, forecasting net impact by horizon

We deliver granular, decision-grade intel: market sizing, 5-year forecasts, pricing, adoption, usage, revenue, and operational KPIs—plus competitor tracking, regulation, and value chains—across 60 countries broadly.

Spot the shifts before they hit your P&L. We track inflection points, adoption curves, pricing moves, and ecosystem plays to show where demand is heading, why it is changing, and what to do next across high-growth markets and disruptive tech

Real-time reads of user behavior. We track shifting priorities, perceptions of today’s and next-gen services, and provider experience, then pace how fast tech moves from trial to adoption, blending buyer, consumer, and channel inputs with social signals (#WhySwitch, #UX).

Partner with our analyst team to build a custom report designed around your business priorities. From analysing market trends to assessing competitors or crafting bespoke datasets, we tailor insights to your needs.
Supplier Intelligence
Discovery & Profiling
Capacity & Footprint
Performance & Risk
Compliance & Governance
Commercial Readiness
Who Supplies Whom
Scorecards & Shortlists
Playbooks & Docs
Category Intelligence
Definition & Scope
Demand & Use Cases
Cost Drivers
Market Structure
Supply Chain Map
Trade & Policy
Operating Norms
Deliverables
Buyer Intelligence
Account Basics
Spend & Scope
Procurement Model
Vendor Requirements
Terms & Policies
Entry Strategy
Pain Points & Triggers
Outputs
Pricing Analysis
Benchmarks
Trends
Should-Cost
Indexation
Landed Cost
Commercial Terms
Deliverables
Brand Analysis
Positioning & Value Prop
Share & Presence
Customer Evidence
Go-to-Market
Digital & Reputation
Compliance & Trust
KPIs & Gaps
Outputs
Full Research Suite comprises of:
Market outlook & trends analysis
Interviews & case studies
Strategic recommendations
Vendor profiles & capabilities analysis
5-year forecasts
8 regions and 60+ country-level data splits
Market segment data splits
12 months of continuous data updates
DELIVERED AS:
PDF EXCEL ONLINE

Thank you!
You will receive an email from our Business Development Manager. Please be sure to check your SPAM/JUNK folder too.
Chat With
MaRIA