Alpha-lactalbumin Market Size, Share, and Forecast Outlook 2025 to 2035

The global alpha-lactalbumin market is projected to grow from USD 762.5 million in 2025 to USD 1,631.1 million by 2035, reflecting a CAGR of 7.9% over the forecast period. North American producers are focusing on sachet-based clinical nutrition and fortified drinks.

Quick Stats in Alpha-lactalbumin Market

  • Market Value (2025): USD 762.5 million
  • Forecast Value (2035): USD 1,631.1 million
  • Forecast CAGR: 7.9%
  • Top Application Segment: Infant Nutrition (65.2% market share in 2025)
  • Key Growth Country: India (8.9% CAGR)
Metric Value
Market Size (2025E) USD 762.5 million
Market Value (2035F) USD 1,631.1 million
CAGR (2025 to 2035) 7.9%

Filtration upgrades have raised yield consistency, supporting concentrated protein fractions with intact bioactivity. These formats are gaining traction in hospitals and outpatient therapy settings.

In Western Europe, low-protein infant formulas are being enabled through alpha-lactalbumin-rich concentrates that meet regulatory amino acid thresholds. Energy-efficient dry-blend systems are being adopted to control formulation costs while preserving product stability.

East Asian producers are transitioning toward recombinant and animal-free variants, especially for halal, allergy-sensitive, and vegan-certified formulations. Local authorities are facilitating commercial fermentation hubs to supply next-gen infant and adult medical nutrition formats.

Product transparency is being enhanced through packaging-integrated traceability. Brands are embedding digital batch logs showing herd origin, antibiotic screening, thermal history, and plant compliance. Retailers in Asia and Europe report lower return volumes and higher parent trust linked to these verification tools.

Pricing remains consistent. Food-grade alpha-lactalbumin averages USD 31-86 per kg, with clinical and assay-grade formats priced higher. Margin protection has been achieved through high-efficiency fractionation and long-term whey sourcing agreements.

In 2025, the alpha-lactalbumin market represents a specialized yet steadily growing segment across several broader parent markets. Within the global whey protein market, it contributes approximately 3-5%, given its role as a high-purity protein fraction used in premium formulations. In the dairy ingredients market, its share is around 1-2%, due to its selective extraction from whey.

In the infant nutrition market, alpha-lactalbumin holds a more prominent share of 6-8%, as it closely mimics human milk proteins and supports infant development. Within the functional food ingredients market, it makes up about 2-3%, driven by applications in health beverages and protein-enriched snacks. In the nutraceuticals market, it contributes roughly 1-2%, favored for its amino acid profile and bioactive properties.

Innovation in protein isolation techniques, particularly membrane filtration and low-heat processing, is helping maintain native protein structure and bioactivity. With consumers shifting toward targeted nutrition and clean-label products, manufacturers are prioritizing traceability and transparency. This has led to increased R&D investments and partnerships across dairy producers and nutraceutical brands, helping position alpha-lactalbumin as a cornerstone ingredient in premium nutritional applications.

Analyzing Alpha-lactalbumin Market by Top Investment Segments

The alpha-lactalbumin market is segmented by end users into the food and beverage industry, infant nutrition, ice-cream industry, dairy products, pharmaceutical industry, and others such as the nutraceutical industry. Regionally, the market is distributed across North America, Latin America, Western Europe, Eastern Europe, South Asia and Pacific, East Asia, and the Middle East and Africa.

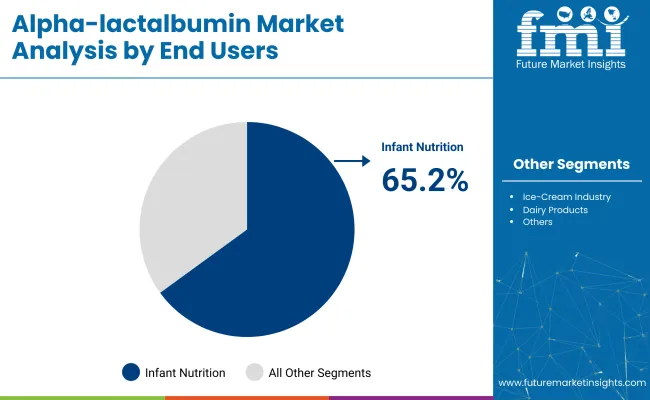
Infant nutrition is projected to dominate the application segment with a 65.2% market share by 2025, driven by increasing demand for premium protein ingredients in baby formula formulations.

Infant Nutrition to Lead the Application Segment with 65.2% Market Share

Infant nutrition is expected to command 65.2% of the alpha-lactalbumin market share by 2025. Demand for infant nutrition is higher in the alpha-lactalbumin market because alpha-lactalbumin closely replicates the primary whey protein found in human breast milk. This resemblance makes it a preferred ingredient in infant formulas aimed at improving protein quality while supporting digestibility, immune function, and cognitive development in newborns.
  • Infant nutrition formulators rely on alpha-lactalbumin to:
  • Lower total protein content while meeting essential amino acid requirements
  • Improve calcium absorption and reduce renal load in infants
  • Support regulatory compliance for amino-acid profile standards in premium formula blends

Alpha Lactalbumin Market By End Users

Top Alpha-lactalbumin Market Dynamics

Alpha-lactalbumin is used in infant formulas to replicate human milk protein composition, supporting brain development and sleep regulation. In sports and clinical nutrition, it enables muscle recovery, immune support, and dietary intervention in gastrointestinal disorders, cachexia, and metabolic diseases, with expanding applications in hospital nutrition protocols and post-operative care.

High Demand from Infant Formula and Early Life Nutrition

Alpha-lactalbumin demand remains concentrated in early-life formulations due to its biological similarity to human milk protein. Infant formula manufacturers are using it to improve amino acid profiles, reduce total protein load, and meet regulatory protein-quality thresholds.

Specialized formulas targeting low-birthweight and premature infants rely on alpha-lactalbumin to support neurodevelopment and gut health. Between 2020 and 2025, usage across hospital and retail infant formulas expanded by 31%, with neonatal units in Europe and East Asia reporting a shift toward formulations enriched with alpha-lactalbumin.

Tryptophan-rich blends have gained traction in sleep-regulating formulas for infants aged 0-6 months. Product registrations in over 40 countries now require compositional disclosure of alpha-lactalbumin content, reinforcing its role in premium newborn nutrition. Clinical buyers in neonatal care prefer formulas with 25-30% of total protein from alpha-lactalbumin to align with human milk benchmarks.

Growing Use in Sports Nutrition and Clinical Dietary Supplements

Alpha-lactalbumin is increasingly used in active and clinical nutrition formats for its digestibility and high leucine and tryptophan content. Sports nutrition brands have formulated recovery blends with alpha-lactalbumin for faster muscle repair and better amino acid uptake. Between 2021 and 2025, 18 new product SKUs featuring alpha-lactalbumin launched across the EU and North America targeting endurance athletes and post-operative recovery.

In clinical applications, it is preferred in low-lactose, hypoallergenic formulas for malnourished patients and those with gastrointestinal or metabolic conditions. Hospitals in Japan and Scandinavia have integrated alpha-lactalbumin-based drinks into nutrition protocols for cancer cachexia and inflammatory bowel disease. Liquid and powder formats with concentrated alpha-lactalbumin now represent a growing portion of therapeutic dietary product pipelines, with procurement volume rising in hospital nutrition tenders.
Analysis of Top Countries Innovating, Processing, and Commercializing Alpha-lactalbumin Globally

Country Wise Analysis Of Alpha Lactalbumin Market

Country CAGR (2025 to 2035)
India 8.9%
China 8.3%
Japan 7.2%
Germany 6.7%
United States 6.1%

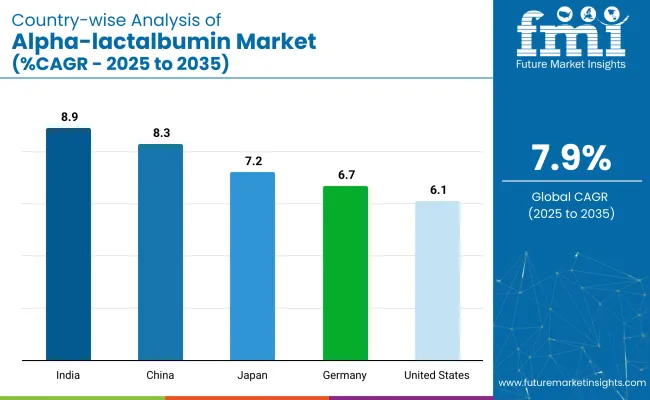
Global alpha-lactalbumin demand is projected to rise at a 6.9% CAGR from 2025 to 2035. Of the five profiled markets out of 40 covered, India leads at 8.9%, followed by China at 8.3% and Japan at 7.2%, while Germany posts 6.7% and the United States records 6.1%.

These rates translate to a growth premium of +29% for India, +20% for China, and +4% for Japan versus the baseline, whereas Germany and the United States trail by -3% and -12%, respectively. Divergence reflects local catalysts: fortification mandates in India, sports-nutrition boom in China, clean-label reformulations in Japan, export-grade whey processing constraints in Germany, and saturated high-value isolate demand in the United States.

  • India surpasses global CAGR by +2.0 percentage points.
  • China exceeds baseline by +1.4 points.
  • Japan maintains a marginal +0.3 point premium.
  • Germany lags by -0.2 points and the United States trails by -0.8 points.

India Alpha-lactalbumin Market Outlook

Demand for alpha-lactalbuminin India is projected to expand at 8.9% CAGR from 2025 to 2035, the fastest among leading economies. Growth is led by rising infant formula penetration and expanding nutraceutical brands targeting pediatric care. Local manufacturers are building whey isolation capacity to meet formula-grade protein standards. FSSAI-aligned purity norms are attracting partnerships with EU dairy processors for bioavailable protein enrichment.

  • Pediatric nutrition now accounts for over 61% of demand.
  • Whey purification capacity rose 3.5× from 2021 to 2024.
  • Regulatory support aids localized premium formula production.

China Alpha-lactalbumin Market Trends

The market in China is growing at 8.3% CAGR, driven by demand for traceable infant and elderly formulations. Post-COVID health prioritization has boosted use of alpha-lactalbumin in follow-on and medical formulas. Cross-border e-commerce platforms now account for 27% of sales, with imported European blends rich in alpha-lactalbumin favored by middle-income urban parents.

  • 27% of alpha-lactalbumin-enriched products sold via e-commerce.
  • Clinical and post-illness formulas drive 22% of segment growth.
  • Stringent CNCA guidelines push ingredient safety upgrades.

Japan Alpha-lactalbumin Market Performance

Japan is projected to grow at 7.2% CAGR, supported by its aging population and demand for allergen-free, digestible proteins. Over 41% of alpha-lactalbumin is used in nutrition products for seniors aged 65+. Local processors are investing in membrane microfiltration for high-purity dairy fractions. Regulatory norms require full amino acid disclosures on pediatric blends.

  • Elderly formulations account for 41% of local demand.
  • Imports of purified alpha-lactalbumin rose 36% from 2020-2024.
  • Functional recovery drinks with alpha-lactalbumin now occupy 18% of medical food shelf space.

Germany Alpha-lactalbumin Market Insights

Germany is forecast to grow at 6.7% CAGR, supported by bio-certified infant formula and rising sports recovery applications. Alpha-lactalbumin-enriched products are now integrated into over 30% of Stage-1 and Stage-2 infant formulations sold through pharmacies. Domestic firms are aligning with EU Regulation 609/2013 on amino acid composition in formula-grade dairy proteins.

  • 30% of pharmacy infant SKUs contain alpha-lactalbumin.
  • 12% growth in lactose-reduced medical nutrition blends post-2022.
  • Clean-label whey products with alpha-lactalbumin expanded by 19% YoY.

United States Alpha-lactalbumin Market Overview

The USA market is expanding at a 6.1% CAGR, led by adoption in clinical-grade, clean-label, and performance-oriented nutrition products. Ultrafiltration and ion-exchange are used in producing whey isolates with high alpha-lactalbumin content for both sports recovery and pediatric care. Brands now offer targeted blends for gut health, muscle support, and immune resilience.

  • 38% of sports powders in premium segment include alpha-lactalbumin.
  • 24% more alpha-lactalbumin-based feeds than in 2020.
  • Clinical formulations registered with FDA rose by 21% between 2021-2024.

Leading Alpha-lactalbumin Brands

The market is moderately consolidated, with a combination of global dairy conglomerates and specialized biochemical firms driving innovation and supply. Arla Foods Ingredients and Fonterra Co-operative Group Limited lead the market with their extensive dairy processing infrastructure and commitment to high-quality whey protein production. Nestlé S.A. and Agropur Cooperative also play a significant role, leveraging their nutritional expertise to meet rising demand in infant formula and clinical nutrition segments.

Specialty ingredient suppliers such as Milk Specialties Global and Hilmar Ingredients Inc. provide tailored alpha-lactalbumin products to food and nutraceutical manufacturers. Meanwhile, companies like Abcam plc, Merck KGaA, and VWR International focus on high-purity variants for research and pharmaceutical applications. XuchangShangke Chemical Co., Ltd. supports the market with cost-effective alternatives in emerging economies, contributing to expanding global reach.

Recent Alpha-lactalbumin Industry News

In May 2023, Arla Foods Ingredients announced the launch of a new alpha-lactalbumin-enriched infant formula ingredient, enhancing amino acid profile and digestibility for newborns.

Leading Players in Alpha-lactalbumin Industry

  • Agropur Cooperative
  • Arla Foods Ingredients
  • Nestlé S.A.
  • Abcam plc
  • Hilmar Ingredients Inc
  • Fonterra Co-operative Group Limited
  • Milk Specialties Global
  • VWR International, LLC
  • XuchangShangke Chemical Co., Ltd.
  • Merck KGaA

Report Coverage and Scope Summary

Report Attributes Details
Market Size (2025) USD 762.5 million
Projected Market Size (2035) USD 1,631.1 million
CAGR (2025 to 2035) 7.9%
Base Year for Estimation 2024
Historical Period 2020 to 2024
Projections Period 2025 to 2035
Quantitative Units USD million for market value
End Users Analyzed (Segment 1) Food & Beverage Industry, Infant Nutrition, Ice Cream Industry, Dairy Products, Pharmaceuticals, Nutraceuticals
Regions Covered North America, Latin America, Western Europe, Eastern Europe, South Asia & Pacific, East Asia, Middle East & Africa
Countries Covered United States, Canada, Germany, United Kingdom, France, Japan, China, India, South Korea, Brazil
Key Players Agropur Cooperative, Arla Foods Ingredients, Nestlé S.A., Abcam plc, Hilmar Ingredients Inc, Fonterra Co-operative Group Limited, Milk Specialties Global, VWR International, LLC, Xuchang Shangke Chemical Co., Ltd., Merck KGaA
Additional Attributes Dollar sales by end user segments, rising uptake in infant nutrition and dairy applications, expanding use in nutraceuticals, and growth in global lactose-free and functional protein markets.

Key Segments

By End Users:

The industry is segmented by end users into the food and beverage industry, infant nutrition, ice-cream industry, dairy products, pharmaceutical industry, and others such as the nutraceutical industry.

By Region:

Regionally, the market is distributed across North America, Latin America, Western Europe, Eastern Europe, South Asia and Pacific, East Asia, and the Middle East and Africa.

Table of Content

  1. Executive Summary
    • Global Market Outlook
    • Demand-side Trends
    • Supply-side Trends
    • Technology Roadmap Analysis
    • Analysis and Recommendations
  2. Market Overview
    • Market Coverage / Taxonomy
    • Market Definition / Scope / Limitations
  3. Market Background
    • Market Dynamics
      • Drivers
      • Restraints
      • Opportunity
      • Trends
    • Scenario Forecast
      • Demand in Optimistic Scenario
      • Demand in Likely Scenario
      • Demand in Conservative Scenario
    • Opportunity Map Analysis
    • Product Life Cycle Analysis
    • Supply Chain Analysis
      • Supply Side Participants and their Roles
        • Producers
        • Mid-Level Participants (Traders/ Agents/ Brokers)
        • Wholesalers and Distributors
      • Value Added and Value Created at Node in the Supply Chain
      • List of Raw Material Suppliers
      • List of Existing and Potential Buyer’s
    • Investment Feasibility Matrix
    • Value Chain Analysis
      • Profit Margin Analysis
      • Wholesalers and Distributors
      • Retailers
    • PESTLE and Porter’s Analysis
    • Regulatory Landscape
      • By Key Regions
      • By Key Countries
    • Regional Parent Market Outlook
    • Production and Consumption Statistics
    • Import and Export Statistics
  4. Global Market Analysis 2020-2024 and Forecast, 2025-2035
    • Historical Market Size Value (USD Million) & Volume (Metric tons) Analysis, 2020-2024
    • Current and Future Market Size Value (USD Million) & Volume (Metric tons) Projections, 2025-2035
      • Y-o-Y Growth Trend Analysis
      • Absolute $ Opportunity Analysis
  5. Global Market Pricing Analysis 2020-2024 and Forecast 2025-2035
  6. Global Market Analysis 2020-2024 and Forecast 2025-2035, By End Users
    • Introduction / Key Findings
    • Historical Market Size Value (USD Million) & Volume (Metric tons) Analysis By End Users, 2020-2024
    • Current and Future Market Size Value (USD Million) & Volume (Metric tons) Analysis and Forecast By End Users, 2025-2035
      • Food & Beverage Industry
      • Infant Nutrition
      • Ice Cream Industry
      • Dairy Products
      • Pharmaceuticals
      • Nutraceuticals
    • Y-o-Y Growth Trend Analysis By End Users, 2020-2024
    • Absolute $ Opportunity Analysis By End Users, 2025-2035
  7. Global Market Analysis 2020-2024 and Forecast 2025-2035, By Region
    • Introduction
    • Historical Market Size Value (USD Million) & Volume (Metric tons) Analysis By Region, 2020-2024
    • Current Market Size Value (USD Million) & Volume (Metric tons) Analysis and Forecast By Region, 2025-2035
      • North America
      • Latin America
      • Western Europe
      • Eastern Europe
      • East Asia
      • South Asia & Pacific
      • Middle East and Africa
    • Market Attractiveness Analysis By Region
  8. North America Market Analysis 2020-2024 and Forecast 2025-2035, By Country
    • Historical Market Size Value (USD Million) & Volume (Metric tons) Trend Analysis By Market Taxonomy, 2020-2024
    • Market Size Value (USD Million) & Volume (Metric tons) Forecast By Market Taxonomy, 2025-2035
      • By Country
        • USA
        • Canada
        • Mexico
      • By End Users
    • Market Attractiveness Analysis
      • By Country
      • By End Users
    • Key Takeaways
  9. Latin America Market Analysis 2020-2024 and Forecast 2025-2035, By Country
    • Historical Market Size Value (USD Million) & Volume (Metric tons) Trend Analysis By Market Taxonomy, 2020-2024
    • Market Size Value (USD Million) & Volume (Metric tons) Forecast By Market Taxonomy, 2025-2035
      • By Country
        • Brazil
        • Argentina
        • Rest of LATAM
      • By End Users
    • Market Attractiveness Analysis
      • By Country
      • By End Users
    • Key Takeaways
  10. Western Europe Market Analysis 2020-2024 and Forecast 2025-2035, By Country
    • Historical Market Size Value (USD Million) & Volume (Metric tons) Trend Analysis By Market Taxonomy, 2020-2024
    • Market Size Value (USD Million) & Volume (Metric tons) Forecast By Market Taxonomy, 2025-2035
      • By Country
        • Germany
        • Italy
        • France
        • UK
        • Spain
        • BENELUX
        • Nordic
        • Rest of W.Europe
      • By End Users
    • Market Attractiveness Analysis
      • By Country
      • By End Users
    • Key Takeaways
  11. Eastern Europe Market Analysis 2020-2024 and Forecast 2025-2035, By Country
    • Historical Market Size Value (USD Million) & Volume (Metric tons) Trend Analysis By Market Taxonomy, 2020-2024
    • Market Size Value (USD Million) & Volume (Metric tons) Forecast By Market Taxonomy, 2025-2035
      • By Country
        • Russia
        • Hungary
        • Poland
        • Balkan & Baltics
        • Rest of E. Europe
      • By End Users
    • Market Attractiveness Analysis
      • By Country
      • By End Users
    • Key Takeaways
  12. East Asia Market Analysis 2020-2024 and Forecast 2025-2035, By Country
    • Historical Market Size Value (USD Million) & Volume (Metric tons) Trend Analysis By Market Taxonomy, 2020-2024
    • Market Size Value (USD Million) & Volume (Metric tons) Forecast By Market Taxonomy, 2025-2035
      • By Country
        • China
        • Japan
        • South Korea
      • By End Users
    • Market Attractiveness Analysis
      • By Country
      • By End Users
    • Key Takeaways
  13. South Asia & Pacific Market Analysis 2020-2024 and Forecast 2025-2035, By Country
    • Historical Market Size Value (USD Million) & Volume (Metric tons) Trend Analysis By Market Taxonomy, 2020-2024
    • Market Size Value (USD Million) & Volume (Metric tons) Forecast By Market Taxonomy, 2025-2035
      • By Country
        • India
        • Australia & New Zealand
        • ASEAN
        • Rest of SAP
      • By End Users
    • Market Attractiveness Analysis
      • By Country
      • By End Users
    • Key Takeaways
  14. Middle East and Africa Market Analysis 2020-2024 and Forecast 2025-2035, By Country
    • Historical Market Size Value (USD Million) & Volume (Metric tons) Trend Analysis By Market Taxonomy, 2020-2024
    • Market Size Value (USD Million) & Volume (Metric tons) Forecast By Market Taxonomy, 2025-2035
      • By Country
        • GCC Countries
        • Northern Africa
        • South Africa
        • Turkiye
        • Rest of MEA
      • By End Users
    • Market Attractiveness Analysis
      • By Country
      • By End Users
    • Key Takeaways
  15. Key Countries Market Analysis
    • USA
      • Pricing Analysis
      • Market Share Analysis, 2024
        • By End Users
    • Canada
      • Pricing Analysis
      • Market Share Analysis, 2024
        • By End Users
    • Brazil
      • Pricing Analysis
      • Market Share Analysis, 2024
        • By End Users
    • Mexico
      • Pricing Analysis
      • Market Share Analysis, 2024
        • By End Users
    • Argentina
      • Pricing Analysis
      • Market Share Analysis, 2024
        • By End Users
  16. Market Structure Analysis
    • Competition Dashboard
    • Competition Benchmarking
    • Market Share Analysis of Top Players
      • By Regional
      • By End Users
  17. Competition Analysis
    • Competition Deep Dive
      • Agropur Cooperative
        • Overview
        • Product Portfolio
        • Profitability by Market Segments (Product/Age /Sales Channel/Region)
        • Sales Footprint
        • Strategy Overview
          • Marketing Strategy
          • Product Strategy
          • Channel Strategy
      • Arla Foods Ingredients
        • Overview
        • Product Portfolio
        • Profitability by Market Segments (Product/Age /Sales Channel/Region)
        • Sales Footprint
        • Strategy Overview
          • Marketing Strategy
          • Product Strategy
          • Channel Strategy
      • Nestlé S.A.
        • Overview
        • Product Portfolio
        • Profitability by Market Segments (Product/Age /Sales Channel/Region)
        • Sales Footprint
        • Strategy Overview
          • Marketing Strategy
          • Product Strategy
          • Channel Strategy
      • Abcam plc
        • Overview
        • Product Portfolio
        • Profitability by Market Segments (Product/Age /Sales Channel/Region)
        • Sales Footprint
        • Strategy Overview
          • Marketing Strategy
          • Product Strategy
          • Channel Strategy
      • Hilmar Ingredients Inc
        • Overview
        • Product Portfolio
        • Profitability by Market Segments (Product/Age /Sales Channel/Region)
        • Sales Footprint
        • Strategy Overview
          • Marketing Strategy
          • Product Strategy
          • Channel Strategy
      • Fonterra Co-operative Group Limited
        • Overview
        • Product Portfolio
        • Profitability by Market Segments (Product/Age /Sales Channel/Region)
        • Sales Footprint
        • Strategy Overview
          • Marketing Strategy
          • Product Strategy
          • Channel Strategy
      • Milk Specialties Global
        • Overview
        • Product Portfolio
        • Profitability by Market Segments (Product/Age /Sales Channel/Region)
        • Sales Footprint
        • Strategy Overview
          • Marketing Strategy
          • Product Strategy
          • Channel Strategy
      • VWR International, LLC
        • Overview
        • Product Portfolio
        • Profitability by Market Segments (Product/Age /Sales Channel/Region)
        • Sales Footprint
        • Strategy Overview
          • Marketing Strategy
          • Product Strategy
          • Channel Strategy
      • Xuchang Shangke Chemical Co., Ltd.
        • Overview
        • Product Portfolio
        • Profitability by Market Segments (Product/Age /Sales Channel/Region)
        • Sales Footprint
        • Strategy Overview
          • Marketing Strategy
          • Product Strategy
          • Channel Strategy
      • Merck KGaA
        • Overview
        • Product Portfolio
        • Profitability by Market Segments (Product/Age /Sales Channel/Region)
        • Sales Footprint
        • Strategy Overview
          • Marketing Strategy
          • Product Strategy
          • Channel Strategy
  18. Assumptions & Acronyms Used
  19. Research Methodology

List of Tables

  • Table 1: Global Market Value (USD Million) Forecast by Region, 2020-2035
  • Table 2: Global Market Volume (Metric tons) Forecast by Region, 2020-2035
  • Table 3: Global Market Value (USD Million) Forecast by End Users, 2020-2035
  • Table 4: Global Market Volume (Metric tons) Forecast by End Users, 2020-2035
  • Table 5: North America Market Value (USD Million) Forecast by Country, 2020-2035
  • Table 6: North America Market Volume (Metric tons) Forecast by Country, 2020-2035
  • Table 7: North America Market Value (USD Million) Forecast by End Users, 2020-2035
  • Table 8: North America Market Volume (Metric tons) Forecast by End Users, 2020-2035
  • Table 9: Latin America Market Value (USD Million) Forecast by Country, 2020-2035
  • Table 10: Latin America Market Volume (Metric tons) Forecast by Country, 2020-2035
  • Table 11: Latin America Market Value (USD Million) Forecast by End Users, 2020-2035
  • Table 12: Latin America Market Volume (Metric tons) Forecast by End Users, 2020-2035
  • Table 13: Western Europe Market Value (USD Million) Forecast by Country, 2020-2035
  • Table 14: Western Europe Market Volume (Metric tons) Forecast by Country, 2020-2035
  • Table 15: Western Europe Market Value (USD Million) Forecast by End Users, 2020-2035
  • Table 16: Western Europe Market Volume (Metric tons) Forecast by End Users, 2020-2035
  • Table 17: Eastern Europe Market Value (USD Million) Forecast by Country, 2020-2035
  • Table 18: Eastern Europe Market Volume (Metric tons) Forecast by Country, 2020-2035
  • Table 19: Eastern Europe Market Value (USD Million) Forecast by End Users, 2020-2035
  • Table 20: Eastern Europe Market Volume (Metric tons) Forecast by End Users, 2020-2035
  • Table 21: East Asia Market Value (USD Million) Forecast by Country, 2020-2035
  • Table 22: East Asia Market Volume (Metric tons) Forecast by Country, 2020-2035
  • Table 23: East Asia Market Value (USD Million) Forecast by End Users, 2020-2035
  • Table 24: East Asia Market Volume (Metric tons) Forecast by End Users, 2020-2035
  • Table 25: South Asia & Pacific Market Value (USD Million) Forecast by Country, 2020-2035
  • Table 26: South Asia & Pacific Market Volume (Metric tons) Forecast by Country, 2020-2035
  • Table 27: South Asia & Pacific Market Value (USD Million) Forecast by End Users, 2020-2035
  • Table 28: South Asia & Pacific Market Volume (Metric tons) Forecast by End Users, 2020-2035
  • Table 29: Middle East and Africa Market Value (USD Million) Forecast by Country, 2020-2035
  • Table 30: Middle East and Africa Market Volume (Metric tons) Forecast by Country, 2020-2035
  • Table 31: Middle East and Africa Market Value (USD Million) Forecast by End Users, 2020-2035
  • Table 32: Middle East and Africa Market Volume (Metric tons) Forecast by End Users, 2020-2035

List of Figures

  • Figure 1: Global Market Volume (Metric tons) Forecast 2020-2035
  • Figure 2: Global Market Pricing Analysis
  • Figure 3: Global Market Value (USD Million) Forecast 2020-2035
  • Figure 4: Global Market Value Share and BPS Analysis by End Users, 2025 and 2035
  • Figure 5: Global Market Y-o-Y Growth Comparison by End Users, 2025-2035
  • Figure 6: Global Market Attractiveness Analysis by End Users
  • Figure 7: Global Market Value (USD Million) Share and BPS Analysis by Region, 2025 and 2035
  • Figure 8: Global Market Y-o-Y Growth Comparison by Region, 2025-2035
  • Figure 9: Global Market Attractiveness Analysis by Region
  • Figure 10: North America Market Incremental $ Opportunity, 2025-2035
  • Figure 11: Latin America Market Incremental $ Opportunity, 2025-2035
  • Figure 12: Western Europe Market Incremental $ Opportunity, 2025-2035
  • Figure 13: Eastern Europe Market Incremental $ Opportunity, 2025-2035
  • Figure 14: East Asia Market Incremental $ Opportunity, 2025-2035
  • Figure 15: South Asia & Pacific Market Incremental $ Opportunity, 2025-2035
  • Figure 16: Middle East and Africa Market Incremental $ Opportunity, 2025-2035
  • Figure 17: North America Market Value Share and BPS Analysis by Country, 2025 and 2035
  • Figure 18: North America Market Value Share and BPS Analysis by End Users, 2025 and 2035
  • Figure 19: North America Market Y-o-Y Growth Comparison by End Users, 2025-2035
  • Figure 20: North America Market Attractiveness Analysis by End Users
  • Figure 21: Latin America Market Value Share and BPS Analysis by Country, 2025 and 2035
  • Figure 22: Latin America Market Value Share and BPS Analysis by End Users, 2025 and 2035
  • Figure 23: Latin America Market Y-o-Y Growth Comparison by End Users, 2025-2035
  • Figure 24: Latin America Market Attractiveness Analysis by End Users
  • Figure 25: Western Europe Market Value Share and BPS Analysis by Country, 2025 and 2035
  • Figure 26: Western Europe Market Value Share and BPS Analysis by End Users, 2025 and 2035
  • Figure 27: Western Europe Market Y-o-Y Growth Comparison by End Users, 2025-2035
  • Figure 28: Western Europe Market Attractiveness Analysis by End Users
  • Figure 29: Eastern Europe Market Value Share and BPS Analysis by Country, 2025 and 2035
  • Figure 30: Eastern Europe Market Value Share and BPS Analysis by End Users, 2025 and 2035
  • Figure 31: Eastern Europe Market Y-o-Y Growth Comparison by End Users, 2025-2035
  • Figure 32: Eastern Europe Market Attractiveness Analysis by End Users
  • Figure 33: East Asia Market Value Share and BPS Analysis by Country, 2025 and 2035
  • Figure 34: East Asia Market Value Share and BPS Analysis by End Users, 2025 and 2035
  • Figure 35: East Asia Market Y-o-Y Growth Comparison by End Users, 2025-2035
  • Figure 36: East Asia Market Attractiveness Analysis by End Users
  • Figure 37: South Asia & Pacific Market Value Share and BPS Analysis by Country, 2025 and 2035
  • Figure 38: South Asia & Pacific Market Value Share and BPS Analysis by End Users, 2025 and 2035
  • Figure 39: South Asia & Pacific Market Y-o-Y Growth Comparison by End Users, 2025-2035
  • Figure 40: South Asia & Pacific Market Attractiveness Analysis by End Users
  • Figure 41: Middle East and Africa Market Value Share and BPS Analysis by Country, 2025 and 2035
  • Figure 42: Middle East and Africa Market Value Share and BPS Analysis by End Users, 2025 and 2035
  • Figure 43: Middle East and Africa Market Y-o-Y Growth Comparison by End Users, 2025-2035
  • Figure 44: Middle East and Africa Market Attractiveness Analysis by End Users
  • Figure 45: Global Market - Tier Structure Analysis
  • Figure 46: Global Market - Company Share Analysis

Frequently Asked Questions

What is the estimated market size of the alpha-lactalbumin market in 2025?

The market size is projected to be USD 762.5 million in 2025.

What is the projected size of the alpha-lactalbumin market by 2035?

The global market is projected to reach USD 1,631.1 million by 2035.

What is the expected CAGR for the alpha-lactalbumin market from 2025 to 2035?

The market is expected to grow at a CAGR of 7.9% during the forecast period.

Which application segment dominates the alpha-lactalbumin market?

Infant nutrition is the leading application, accounting for 65.2% of the market share in 2025.

Which country is expected to see the fastest growth in the alpha-lactalbumin market?

India is forecast to grow at the highest CAGR of 8.9% from 2025 to 2035.

Future Market Insights

Alpha-lactalbumin Market