Ammunition Market Size and Share Forecast Outlook (2024 to 2034)

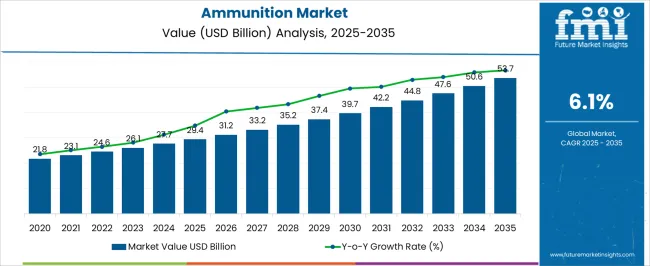
The ammunition market is projected to be valued at USD 27.7 billion by the end of 2024 and is expected to rise to USD 50.4 billion by 2034. The global ammunition market is expected to grow at a CAGR of 6.2% during the forecast period. The demand for ammunition is increasing due to rising geopolitical tensions, military modernization efforts, and a growing focus on national security.

Key Market Drivers

  • As geopolitical tensions and security concerns continue to rise worldwide, nations increasingly invest in ammunition to enhance their defense capabilities.
  • Ongoing efforts to modernize military weaponry globally contribute to the growth of the ammunition market.
  • The threat of terrorism and asymmetric warfare has led to a significant demand for specialized ammunition for counter-terrorism operations.
  • Growing defense budgets in various countries allow greater investment in ammunition, supporting technological advancements and procurement.
  • Escalating regional conflicts and geopolitical instability have created a need for stockpiling ammunition for strategic and defensive purposes.
  • The ever-evolving security challenges law enforcement agencies face have contributed to the increased demand for ammunition, driving the market growth.
  • Developing smarter and precision-guided munitions, among other technological advancements, attracts investments and drives market growth.
  • Collaborative efforts and military alliances among nations have fostered the exchange and procurement of ammunition, boosting the market.
Attributes Key Statistics
Ammunition Market Value (2024) USD 27.7 billion
Anticipated Market Value (2034) USD 50.4 billion
Estimated Growth (2024 to 2034) 6.2% CAGR

Consumption Trends in the Global Ammunition Sector

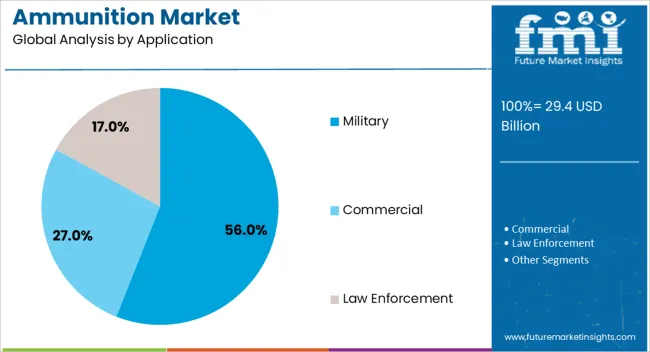
  • The ammunition market is experiencing growth owing to the rising demand fueled by geopolitical tensions, military modernization, and increasing defense budgets across the globe.
  • Governments and defense forces prefer technologically advanced and precision-guided ammunition, leading manufacturers to develop and market innovative ammunition solutions.
  • Advanced ammunition is gaining popularity among military and law enforcement agencies as they recognize the significance of staying technologically abreast for effective defense and security.
  • The popularity of specialized ammunition, such as smart munitions and precision-guided systems, is increasing due to their enhanced accuracy and efficiency in addressing modern security challenges.
  • The ammunition market is experiencing sustained growth, driven by global conflicts, counter-terrorism measures, and territorial disputes.
  • Sales and adoption of ammunition with advanced features and capabilities are increasing, influencing procurement decisions and leading to widespread adoption across different regions.
  • Ongoing military alliances and collaborative efforts contribute to exchanging ammunition technologies and strategies among nations, amplifying the market's popularity.

Key Restraints Impacting Ammunition Market Growth

The ammunition market is anticipated to surpass a valuation of USD 50.4 billion by 2034, expanding at a 6.2% CAGR. While the ammunition market is experiencing growth, several factors can adversely affect its development and expansion.

  • Strict national and international regulations on arms trade and ammunition procurement can create barriers, limiting market access and affecting sales.
  • Economic uncertainties and downturns can lead to defense budget cuts, impacting nations' purchasing power and ammunition market dynamics.
  • International efforts towards disarmament and arms reduction treaties may decrease demand for ammunition, affecting market growth.
  • Low utility in the prices of raw materials, such as metals and fuels, can increase production costs, putting pressure on profit margins for ammunition manufacturers.
  • Growing awareness of ammunition's environmental impact may lead to restrictions on certain types, pushing for more eco-friendly alternatives.
  • Rapid advancements in defense technologies may render certain conventional ammunition obsolete, requiring manufacturers to innovate and adapt constantly.
  • The growing emphasis on security measures may divert resources from traditional defense spending, impacting the ammunition market.
  • Public sentiments against armed conflicts and war can influence government decisions, potentially resulting in decreased defense budgets and ammunition procurement.

Ammunition Industry Analysis by Top Investment Segments

Versatility, Cost-effectiveness, and Compliance with International Regulations Drive Demand for Full Metal Jacket (FMJ) Ammunition

Attributes Details
Top Type Full Metal Jacket
CAGR (2024 to 2034) 23.4%

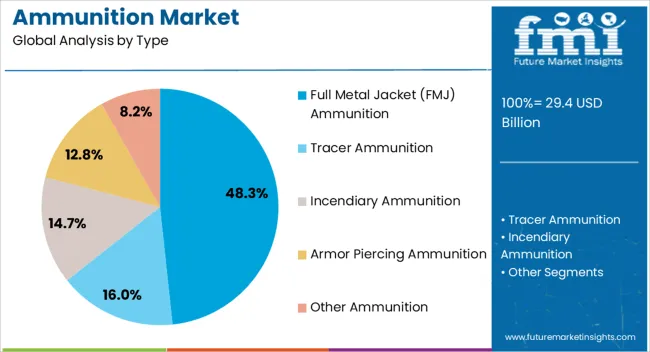
Based on the type, full metal jacket (FMJ) ammunition dominates the global ammunition market, expanding at a 6.0% CAGR through 2034. This rising popularity is attributed to the following reasons:

  • Full metal jacket ammunition features a lead core encapsulated in a metal jacket, which minimizes lead exposure and barrel fouling and enhances firearm reliability.
  • Full metal jacket (FMJ) ammunition rounds are also known for their stability in flight, consistent accuracy, and reliable feeding in various firearms. This makes them a preferred choice for mass production and consumption in the ammunition market.
  • While specialized ammunition exists for specific purposes, FMJ's versatility and compliance with regulations make it a go-to option for law enforcement, military, and civilian firearm enthusiasts.

Civilian, Military, and Law Enforcement Usage of Small Ammunition

Attributes Details
Top Ammunition Small Ammunition
CAGR (2024 to 2034) 5.8%

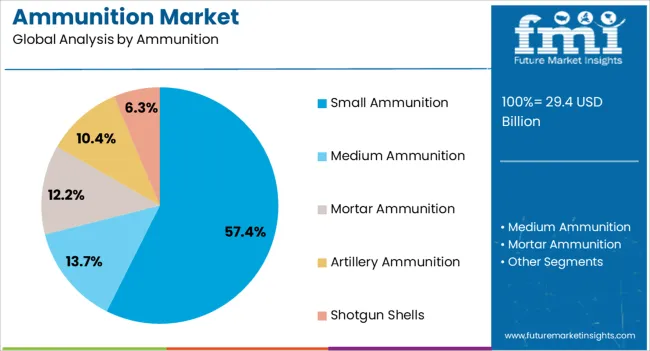
Based on ammunition, small ammunition dominates the market, expanding at a 5.8% CAGR. This rising popularity is attributed to the following reasons:

  • Small ammunition is extensively used for civilian purposes such as recreational shooting, hunting, and personal defense. This popularity contributes significantly to the demand for small ammunition because of its affordability and accessibility.
  • Small ammunition is a staple in military and law enforcement operations due to the standardization of NATO caliber rounds and the prevalence of rifles and handguns chambered for these calibers.
  • Moreover, the adaptability of small-caliber ammunition to various operational scenarios makes it the primary ammunition type used by armed forces.

Analysis of Top Countries Manufacturing and Exporting Ammunition
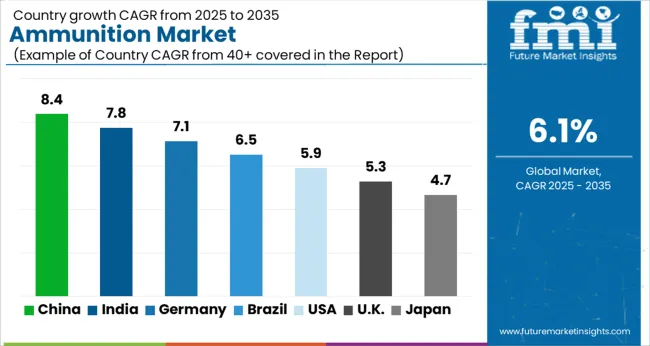
The section analyzes the ammunition market by country, including the United States, the United Kingdom, China, Japan, and South Korea. The table highlights the CAGR for each country, indicating the expected market growth in that country through 2034.

Countries CAGR (2024 to 2034)
United States 6.3%
United Kingdom 6.8%
China 6.6%
Japan 6.9%
South Korea 7.2%

Technologically Advanced Defense Sector Production in South Korea

South Korea is the leading Asian country in the ammunition market. The Korean ammunition market is expected to rise at a CAGR of 7.2% until 2034.

  • South Korea's presence in the ammunition market is characterized by its defense industry, which manufactures a range of small arms, ammunition, and artillery rounds, making it a prominent player in the global market.
  • South Korea's strategic position in East Asia and active participation in international peacekeeping efforts further contribute to its dominance in the ammunition market.

Japan's Focus on Precision Engineering and Strong Defense Commitment

Japan is another Asian country leading in the global ammunition market. The Japanese market is anticipated to register a CAGR of 6.9% through 2034.

  • Japanese defense industries produce high-quality small arms and ammunition, contributing to the global supply chain.
  • Japan’s strategic location in the Asia-Pacific region also positions it as a key player in the regional ammunition market.

Significant Military Spending in the United States Defense Industry

The United States dominates the ammunition market in the North American region. It is expected to exhibit an annual growth rate of 6.3% until 2034.

  • The United States’s advanced defense technologies and diverse product offerings make it a leader in the global ammunition market. It is also a major exporter of ammunition, supplying both domestic and international markets.

The United Kingdom’s Strong Defense Capabilities, Advanced Military Technologies, and Strategic Alliances

The United Kingdom ammunition market is predicted to register a CAGR of 6.8% through 2034.

  • As a key member of NATO, the United Kingdom plays a crucial role in standardization efforts, and its defense industry produces a variety of ammunition types.
  • The country's commitment to international security and peacekeeping operations further enhances its stand in the global ammunition market.

China’s Continuous Modernization Efforts and Strong Presence in the Global Arms Trade

China is another Asian country in the global ammunition market, which is anticipated to register a CAGR of 6.6% through 2034.

  • Chinese defense industries manufacture a wide range of ammunition, including small arms and artillery rounds, making it one of the world's leading ammunition producers.
  • China's expanding influence in international geopolitics also adds to its market dominance, as it caters to various nations seeking reliable and cost-effective ammunition.

Competitive Landscape of the Ammunition Market
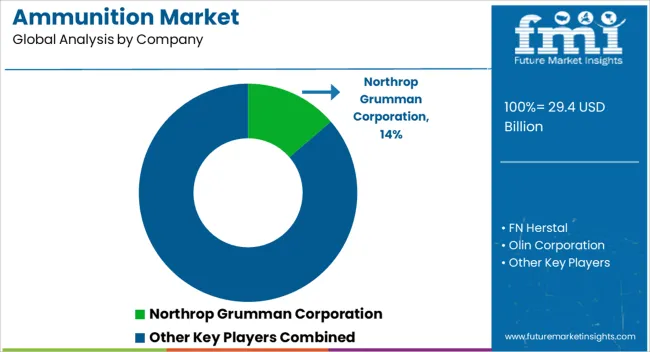
Key companies like Northrop Grumman Corporation, FN Herstal, Olin Corporation, General Dynamics Corporation, BAE Systems, Inc., and Rheinmetall Defense are implementing various strategies to expand their market presence and meet customers' evolving demands in the ammunition market. Companies are investing in R&D to introduce innovative technologies in ammunition manufacturing.

Leading ammunition manufacturers are actively pursuing opportunities in the global market. Companies engage in strategic mergers and acquisitions to strengthen their market position. Some companies are incorporating environmentally friendly practices in ammunition manufacturing.

Recent Developments

  • On January 23, 2024, NATO signed a 1.1-billion-euro contract to procure 155mm artillery ammunition, reinforcing the alliance's commitment to bolstering military capabilities and ensuring strategic preparedness.
  • On December 10, the United States accelerated ammunition sales to Israel, bypassing congressional review. The expedited shipment, reported by The New York Times, highlights the limited congressional oversight in this transaction.
  • On October 11, 2023, South Korea's leading arms manufacturer, Hanwha Aerospace, aims to enter the United States market after a significant arms deal with Poland. Eager to expand globally, they target supplying the United States military.

Leading Companies in the Global Ammunition Industry

  • Northrop Grumman Corporation
  • FN Herstal
  • Olin Corporation
  • General Dynamics Corporation
  • BAE Systems, Inc.
  • Rheinmetall Defense
  • Nexter KNDS Group
  • Hanwha Corporation
  • ST Engineering
  • Remington Arms Company LLC
  • Vista Outdoor Operations LLC

Top Segments Studied in the Ammunition Market Report

By Type:

  • Full Metal Jacket (FMJ) Ammunition
  • Tracer Ammunition
  • Incendiary Ammunition
  • Armor Piercing Ammunition
  • Other Ammunition

By Ammunition:

  • Small Ammunition
  • Medium Ammunition
  • Mortar Ammunition
  • Artillery Ammunition
  • Shotgun Shells

By Application:

  • Commercial
  • Military
  • Law Enforcement

By Region:

  • Asia Pacific
  • Europe
  • North America
  • Middle East & Africa
  • Latin America

Table of Content

  • 1. Executive Summary
  • 2. Market Overview
  • 3. Market Background
  • 4. Global Market Analysis 2019 to 2023 and Forecast, 2024 to 2034
  • 5. Global Market Analysis 2019 to 2023 and Forecast 2024 to 2034, By Type
    • 5.1. Full Metal Jacket (FMJ) Ammunition
    • 5.2. Tracer Ammunition
    • 5.3. Incendiary Ammunition
    • 5.4. Armour Piercing Ammunition
    • 5.5. Other
  • 6. Global Market Analysis 2019 to 2023 and Forecast 2024 to 2034, By Ammunition
    • 6.1. Small Ammunition
    • 6.2. Medium Ammunition
    • 6.3. Mortar Ammunition
    • 6.4. Artillery Ammunition
    • 6.5. Shotgun Shells
  • 7. Global Market Analysis 2019 to 2023 and Forecast 2024 to 2034, By Application
    • 7.1. Commercial
    • 7.2. Military
    • 7.3. Law Enforcement
  • 8. Global Market Analysis 2019 to 2023 and Forecast 2024 to 2034, By Region
    • 8.1. North America
    • 8.2. Latin America
    • 8.3. Western Europe
    • 8.4. Eastern Europe
    • 8.5. South Asia and Pacific
    • 8.6. East Asia
    • 8.7. Middle East and Africa
  • 9. North America Market Analysis 2019 to 2023 and Forecast 2024 to 2034, By Country
  • 10. Latin America Market Analysis 2019 to 2023 and Forecast 2024 to 2034, By Country
  • 11. Western Europe Market Analysis 2019 to 2023 and Forecast 2024 to 2034, By Country
  • 12. Eastern Europe Market Analysis 2019 to 2023 and Forecast 2024 to 2034, By Country
  • 13. South Asia and Pacific Market Analysis 2019 to 2023 and Forecast 2024 to 2034, By Country
  • 14. East Asia Market Analysis 2019 to 2023 and Forecast 2024 to 2034, By Country
  • 15. Middle East and Africa Market Analysis 2019 to 2023 and Forecast 2024 to 2034, By Country
  • 16. Key Countries Market Analysis
  • 17. Market Structure Analysis
  • 18. Competition Analysis
    • 18.1. Northrop Grumman Corporation
    • 18.2. FN Herstal
    • 18.3. Olin Corporation
    • 18.4. General Dynamics Corporation
    • 18.5. BAE Systems, Inc.
    • 18.6. Rheinmetall Defense
    • 18.7. Nexter KNDS Group
    • 18.8. Hanwha Corporation
    • 18.9. ST Engineering
    • 18.10. Remington Arms Company LLC
    • 18.11. Vista Outdoor Operations LLC
  • 19. Assumptions & Acronyms Used
  • 20. Research Methodology

List of Tables

Table 1: Global Market Value (US$ Million) Forecast by Region, 2019 to 2034

Table 2: Global Market Volume (Units) Forecast by Region, 2019 to 2034

Table 3: Global Market Value (US$ Million) Forecast by Type, 2019 to 2034

Table 4: Global Market Volume (Units) Forecast by Type, 2019 to 2034

Table 5: Global Market Value (US$ Million) Forecast by Ammunition, 2019 to 2034

Table 6: Global Market Volume (Units) Forecast by Ammunition, 2019 to 2034

Table 7: Global Market Value (US$ Million) Forecast by Application, 2019 to 2034

Table 8: Global Market Volume (Units) Forecast by Application, 2019 to 2034

Table 9: North America Market Value (US$ Million) Forecast by Country, 2019 to 2034

Table 10: North America Market Volume (Units) Forecast by Country, 2019 to 2034

Table 11: North America Market Value (US$ Million) Forecast by Type, 2019 to 2034

Table 12: North America Market Volume (Units) Forecast by Type, 2019 to 2034

Table 13: North America Market Value (US$ Million) Forecast by Ammunition, 2019 to 2034

Table 14: North America Market Volume (Units) Forecast by Ammunition, 2019 to 2034

Table 15: North America Market Value (US$ Million) Forecast by Application, 2019 to 2034

Table 16: North America Market Volume (Units) Forecast by Application, 2019 to 2034

Table 17: Latin America Market Value (US$ Million) Forecast by Country, 2019 to 2034

Table 18: Latin America Market Volume (Units) Forecast by Country, 2019 to 2034

Table 19: Latin America Market Value (US$ Million) Forecast by Type, 2019 to 2034

Table 20: Latin America Market Volume (Units) Forecast by Type, 2019 to 2034

Table 21: Latin America Market Value (US$ Million) Forecast by Ammunition, 2019 to 2034

Table 22: Latin America Market Volume (Units) Forecast by Ammunition, 2019 to 2034

Table 23: Latin America Market Value (US$ Million) Forecast by Application, 2019 to 2034

Table 24: Latin America Market Volume (Units) Forecast by Application, 2019 to 2034

Table 25: Western Europe Market Value (US$ Million) Forecast by Country, 2019 to 2034

Table 26: Western Europe Market Volume (Units) Forecast by Country, 2019 to 2034

Table 27: Western Europe Market Value (US$ Million) Forecast by Type, 2019 to 2034

Table 28: Western Europe Market Volume (Units) Forecast by Type, 2019 to 2034

Table 29: Western Europe Market Value (US$ Million) Forecast by Ammunition, 2019 to 2034

Table 30: Western Europe Market Volume (Units) Forecast by Ammunition, 2019 to 2034

Table 31: Western Europe Market Value (US$ Million) Forecast by Application, 2019 to 2034

Table 32: Western Europe Market Volume (Units) Forecast by Application, 2019 to 2034

Table 33: Eastern Europe Market Value (US$ Million) Forecast by Country, 2019 to 2034

Table 34: Eastern Europe Market Volume (Units) Forecast by Country, 2019 to 2034

Table 35: Eastern Europe Market Value (US$ Million) Forecast by Type, 2019 to 2034

Table 36: Eastern Europe Market Volume (Units) Forecast by Type, 2019 to 2034

Table 37: Eastern Europe Market Value (US$ Million) Forecast by Ammunition, 2019 to 2034

Table 38: Eastern Europe Market Volume (Units) Forecast by Ammunition, 2019 to 2034

Table 39: Eastern Europe Market Value (US$ Million) Forecast by Application, 2019 to 2034

Table 40: Eastern Europe Market Volume (Units) Forecast by Application, 2019 to 2034

Table 41: South Asia and Pacific Market Value (US$ Million) Forecast by Country, 2019 to 2034

Table 42: South Asia and Pacific Market Volume (Units) Forecast by Country, 2019 to 2034

Table 43: South Asia and Pacific Market Value (US$ Million) Forecast by Type, 2019 to 2034

Table 44: South Asia and Pacific Market Volume (Units) Forecast by Type, 2019 to 2034

Table 45: South Asia and Pacific Market Value (US$ Million) Forecast by Ammunition, 2019 to 2034

Table 46: South Asia and Pacific Market Volume (Units) Forecast by Ammunition, 2019 to 2034

Table 47: South Asia and Pacific Market Value (US$ Million) Forecast by Application, 2019 to 2034

Table 48: South Asia and Pacific Market Volume (Units) Forecast by Application, 2019 to 2034

Table 49: East Asia Market Value (US$ Million) Forecast by Country, 2019 to 2034

Table 50: East Asia Market Volume (Units) Forecast by Country, 2019 to 2034

Table 51: East Asia Market Value (US$ Million) Forecast by Type, 2019 to 2034

Table 52: East Asia Market Volume (Units) Forecast by Type, 2019 to 2034

Table 53: East Asia Market Value (US$ Million) Forecast by Ammunition, 2019 to 2034

Table 54: East Asia Market Volume (Units) Forecast by Ammunition, 2019 to 2034

Table 55: East Asia Market Value (US$ Million) Forecast by Application, 2019 to 2034

Table 56: East Asia Market Volume (Units) Forecast by Application, 2019 to 2034

Table 57: Middle East and Africa Market Value (US$ Million) Forecast by Country, 2019 to 2034

Table 58: Middle East and Africa Market Volume (Units) Forecast by Country, 2019 to 2034

Table 59: Middle East and Africa Market Value (US$ Million) Forecast by Type, 2019 to 2034

Table 60: Middle East and Africa Market Volume (Units) Forecast by Type, 2019 to 2034

Table 61: Middle East and Africa Market Value (US$ Million) Forecast by Ammunition, 2019 to 2034

Table 62: Middle East and Africa Market Volume (Units) Forecast by Ammunition, 2019 to 2034

Table 63: Middle East and Africa Market Value (US$ Million) Forecast by Application, 2019 to 2034

Table 64: Middle East and Africa Market Volume (Units) Forecast by Application, 2019 to 2034

List of Figures

Figure 1: Global Market Value (US$ Million) by Type, 2024 to 2034

Figure 2: Global Market Value (US$ Million) by Ammunition, 2024 to 2034

Figure 3: Global Market Value (US$ Million) by Application, 2024 to 2034

Figure 4: Global Market Value (US$ Million) by Region, 2024 to 2034

Figure 5: Global Market Value (US$ Million) Analysis by Region, 2019 to 2034

Figure 6: Global Market Volume (Units) Analysis by Region, 2019 to 2034

Figure 7: Global Market Value Share (%) and BPS Analysis by Region, 2024 to 2034

Figure 8: Global Market Y-o-Y Growth (%) Projections by Region, 2024 to 2034

Figure 9: Global Market Value (US$ Million) Analysis by Type, 2019 to 2034

Figure 10: Global Market Volume (Units) Analysis by Type, 2019 to 2034

Figure 11: Global Market Value Share (%) and BPS Analysis by Type, 2024 to 2034

Figure 12: Global Market Y-o-Y Growth (%) Projections by Type, 2024 to 2034

Figure 13: Global Market Value (US$ Million) Analysis by Ammunition, 2019 to 2034

Figure 14: Global Market Volume (Units) Analysis by Ammunition, 2019 to 2034

Figure 15: Global Market Value Share (%) and BPS Analysis by Ammunition, 2024 to 2034

Figure 16: Global Market Y-o-Y Growth (%) Projections by Ammunition, 2024 to 2034

Figure 17: Global Market Value (US$ Million) Analysis by Application, 2019 to 2034

Figure 18: Global Market Volume (Units) Analysis by Application, 2019 to 2034

Figure 19: Global Market Value Share (%) and BPS Analysis by Application, 2024 to 2034

Figure 20: Global Market Y-o-Y Growth (%) Projections by Application, 2024 to 2034

Figure 21: Global Market Attractiveness by Type, 2024 to 2034

Figure 22: Global Market Attractiveness by Ammunition, 2024 to 2034

Figure 23: Global Market Attractiveness by Application, 2024 to 2034

Figure 24: Global Market Attractiveness by Region, 2024 to 2034

Figure 25: North America Market Value (US$ Million) by Type, 2024 to 2034

Figure 26: North America Market Value (US$ Million) by Ammunition, 2024 to 2034

Figure 27: North America Market Value (US$ Million) by Application, 2024 to 2034

Figure 28: North America Market Value (US$ Million) by Country, 2024 to 2034

Figure 29: North America Market Value (US$ Million) Analysis by Country, 2019 to 2034

Figure 30: North America Market Volume (Units) Analysis by Country, 2019 to 2034

Figure 31: North America Market Value Share (%) and BPS Analysis by Country, 2024 to 2034

Figure 32: North America Market Y-o-Y Growth (%) Projections by Country, 2024 to 2034

Figure 33: North America Market Value (US$ Million) Analysis by Type, 2019 to 2034

Figure 34: North America Market Volume (Units) Analysis by Type, 2019 to 2034

Figure 35: North America Market Value Share (%) and BPS Analysis by Type, 2024 to 2034

Figure 36: North America Market Y-o-Y Growth (%) Projections by Type, 2024 to 2034

Figure 37: North America Market Value (US$ Million) Analysis by Ammunition, 2019 to 2034

Figure 38: North America Market Volume (Units) Analysis by Ammunition, 2019 to 2034

Figure 39: North America Market Value Share (%) and BPS Analysis by Ammunition, 2024 to 2034

Figure 40: North America Market Y-o-Y Growth (%) Projections by Ammunition, 2024 to 2034

Figure 41: North America Market Value (US$ Million) Analysis by Application, 2019 to 2034

Figure 42: North America Market Volume (Units) Analysis by Application, 2019 to 2034

Figure 43: North America Market Value Share (%) and BPS Analysis by Application, 2024 to 2034

Figure 44: North America Market Y-o-Y Growth (%) Projections by Application, 2024 to 2034

Figure 45: North America Market Attractiveness by Type, 2024 to 2034

Figure 46: North America Market Attractiveness by Ammunition, 2024 to 2034

Figure 47: North America Market Attractiveness by Application, 2024 to 2034

Figure 48: North America Market Attractiveness by Country, 2024 to 2034

Figure 49: Latin America Market Value (US$ Million) by Type, 2024 to 2034

Figure 50: Latin America Market Value (US$ Million) by Ammunition, 2024 to 2034

Figure 51: Latin America Market Value (US$ Million) by Application, 2024 to 2034

Figure 52: Latin America Market Value (US$ Million) by Country, 2024 to 2034

Figure 53: Latin America Market Value (US$ Million) Analysis by Country, 2019 to 2034

Figure 54: Latin America Market Volume (Units) Analysis by Country, 2019 to 2034

Figure 55: Latin America Market Value Share (%) and BPS Analysis by Country, 2024 to 2034

Figure 56: Latin America Market Y-o-Y Growth (%) Projections by Country, 2024 to 2034

Figure 57: Latin America Market Value (US$ Million) Analysis by Type, 2019 to 2034

Figure 58: Latin America Market Volume (Units) Analysis by Type, 2019 to 2034

Figure 59: Latin America Market Value Share (%) and BPS Analysis by Type, 2024 to 2034

Figure 60: Latin America Market Y-o-Y Growth (%) Projections by Type, 2024 to 2034

Figure 61: Latin America Market Value (US$ Million) Analysis by Ammunition, 2019 to 2034

Figure 62: Latin America Market Volume (Units) Analysis by Ammunition, 2019 to 2034

Figure 63: Latin America Market Value Share (%) and BPS Analysis by Ammunition, 2024 to 2034

Figure 64: Latin America Market Y-o-Y Growth (%) Projections by Ammunition, 2024 to 2034

Figure 65: Latin America Market Value (US$ Million) Analysis by Application, 2019 to 2034

Figure 66: Latin America Market Volume (Units) Analysis by Application, 2019 to 2034

Figure 67: Latin America Market Value Share (%) and BPS Analysis by Application, 2024 to 2034

Figure 68: Latin America Market Y-o-Y Growth (%) Projections by Application, 2024 to 2034

Figure 69: Latin America Market Attractiveness by Type, 2024 to 2034

Figure 70: Latin America Market Attractiveness by Ammunition, 2024 to 2034

Figure 71: Latin America Market Attractiveness by Application, 2024 to 2034

Figure 72: Latin America Market Attractiveness by Country, 2024 to 2034

Figure 73: Western Europe Market Value (US$ Million) by Type, 2024 to 2034

Figure 74: Western Europe Market Value (US$ Million) by Ammunition, 2024 to 2034

Figure 75: Western Europe Market Value (US$ Million) by Application, 2024 to 2034

Figure 76: Western Europe Market Value (US$ Million) by Country, 2024 to 2034

Figure 77: Western Europe Market Value (US$ Million) Analysis by Country, 2019 to 2034

Figure 78: Western Europe Market Volume (Units) Analysis by Country, 2019 to 2034

Figure 79: Western Europe Market Value Share (%) and BPS Analysis by Country, 2024 to 2034

Figure 80: Western Europe Market Y-o-Y Growth (%) Projections by Country, 2024 to 2034

Figure 81: Western Europe Market Value (US$ Million) Analysis by Type, 2019 to 2034

Figure 82: Western Europe Market Volume (Units) Analysis by Type, 2019 to 2034

Figure 83: Western Europe Market Value Share (%) and BPS Analysis by Type, 2024 to 2034

Figure 84: Western Europe Market Y-o-Y Growth (%) Projections by Type, 2024 to 2034

Figure 85: Western Europe Market Value (US$ Million) Analysis by Ammunition, 2019 to 2034

Figure 86: Western Europe Market Volume (Units) Analysis by Ammunition, 2019 to 2034

Figure 87: Western Europe Market Value Share (%) and BPS Analysis by Ammunition, 2024 to 2034

Figure 88: Western Europe Market Y-o-Y Growth (%) Projections by Ammunition, 2024 to 2034

Figure 89: Western Europe Market Value (US$ Million) Analysis by Application, 2019 to 2034

Figure 90: Western Europe Market Volume (Units) Analysis by Application, 2019 to 2034

Figure 91: Western Europe Market Value Share (%) and BPS Analysis by Application, 2024 to 2034

Figure 92: Western Europe Market Y-o-Y Growth (%) Projections by Application, 2024 to 2034

Figure 93: Western Europe Market Attractiveness by Type, 2024 to 2034

Figure 94: Western Europe Market Attractiveness by Ammunition, 2024 to 2034

Figure 95: Western Europe Market Attractiveness by Application, 2024 to 2034

Figure 96: Western Europe Market Attractiveness by Country, 2024 to 2034

Figure 97: Eastern Europe Market Value (US$ Million) by Type, 2024 to 2034

Figure 98: Eastern Europe Market Value (US$ Million) by Ammunition, 2024 to 2034

Figure 99: Eastern Europe Market Value (US$ Million) by Application, 2024 to 2034

Figure 100: Eastern Europe Market Value (US$ Million) by Country, 2024 to 2034

Figure 101: Eastern Europe Market Value (US$ Million) Analysis by Country, 2019 to 2034

Figure 102: Eastern Europe Market Volume (Units) Analysis by Country, 2019 to 2034

Figure 103: Eastern Europe Market Value Share (%) and BPS Analysis by Country, 2024 to 2034

Figure 104: Eastern Europe Market Y-o-Y Growth (%) Projections by Country, 2024 to 2034

Figure 105: Eastern Europe Market Value (US$ Million) Analysis by Type, 2019 to 2034

Figure 106: Eastern Europe Market Volume (Units) Analysis by Type, 2019 to 2034

Figure 107: Eastern Europe Market Value Share (%) and BPS Analysis by Type, 2024 to 2034

Figure 108: Eastern Europe Market Y-o-Y Growth (%) Projections by Type, 2024 to 2034

Figure 109: Eastern Europe Market Value (US$ Million) Analysis by Ammunition, 2019 to 2034

Figure 110: Eastern Europe Market Volume (Units) Analysis by Ammunition, 2019 to 2034

Figure 111: Eastern Europe Market Value Share (%) and BPS Analysis by Ammunition, 2024 to 2034

Figure 112: Eastern Europe Market Y-o-Y Growth (%) Projections by Ammunition, 2024 to 2034

Figure 113: Eastern Europe Market Value (US$ Million) Analysis by Application, 2019 to 2034

Figure 114: Eastern Europe Market Volume (Units) Analysis by Application, 2019 to 2034

Figure 115: Eastern Europe Market Value Share (%) and BPS Analysis by Application, 2024 to 2034

Figure 116: Eastern Europe Market Y-o-Y Growth (%) Projections by Application, 2024 to 2034

Figure 117: Eastern Europe Market Attractiveness by Type, 2024 to 2034

Figure 118: Eastern Europe Market Attractiveness by Ammunition, 2024 to 2034

Figure 119: Eastern Europe Market Attractiveness by Application, 2024 to 2034

Figure 120: Eastern Europe Market Attractiveness by Country, 2024 to 2034

Figure 121: South Asia and Pacific Market Value (US$ Million) by Type, 2024 to 2034

Figure 122: South Asia and Pacific Market Value (US$ Million) by Ammunition, 2024 to 2034

Figure 123: South Asia and Pacific Market Value (US$ Million) by Application, 2024 to 2034

Figure 124: South Asia and Pacific Market Value (US$ Million) by Country, 2024 to 2034

Figure 125: South Asia and Pacific Market Value (US$ Million) Analysis by Country, 2019 to 2034

Figure 126: South Asia and Pacific Market Volume (Units) Analysis by Country, 2019 to 2034

Figure 127: South Asia and Pacific Market Value Share (%) and BPS Analysis by Country, 2024 to 2034

Figure 128: South Asia and Pacific Market Y-o-Y Growth (%) Projections by Country, 2024 to 2034

Figure 129: South Asia and Pacific Market Value (US$ Million) Analysis by Type, 2019 to 2034

Figure 130: South Asia and Pacific Market Volume (Units) Analysis by Type, 2019 to 2034

Figure 131: South Asia and Pacific Market Value Share (%) and BPS Analysis by Type, 2024 to 2034

Figure 132: South Asia and Pacific Market Y-o-Y Growth (%) Projections by Type, 2024 to 2034

Figure 133: South Asia and Pacific Market Value (US$ Million) Analysis by Ammunition, 2019 to 2034

Figure 134: South Asia and Pacific Market Volume (Units) Analysis by Ammunition, 2019 to 2034

Figure 135: South Asia and Pacific Market Value Share (%) and BPS Analysis by Ammunition, 2024 to 2034

Figure 136: South Asia and Pacific Market Y-o-Y Growth (%) Projections by Ammunition, 2024 to 2034

Figure 137: South Asia and Pacific Market Value (US$ Million) Analysis by Application, 2019 to 2034

Figure 138: South Asia and Pacific Market Volume (Units) Analysis by Application, 2019 to 2034

Figure 139: South Asia and Pacific Market Value Share (%) and BPS Analysis by Application, 2024 to 2034

Figure 140: South Asia and Pacific Market Y-o-Y Growth (%) Projections by Application, 2024 to 2034

Figure 141: South Asia and Pacific Market Attractiveness by Type, 2024 to 2034

Figure 142: South Asia and Pacific Market Attractiveness by Ammunition, 2024 to 2034

Figure 143: South Asia and Pacific Market Attractiveness by Application, 2024 to 2034

Figure 144: South Asia and Pacific Market Attractiveness by Country, 2024 to 2034

Figure 145: East Asia Market Value (US$ Million) by Type, 2024 to 2034

Figure 146: East Asia Market Value (US$ Million) by Ammunition, 2024 to 2034

Figure 147: East Asia Market Value (US$ Million) by Application, 2024 to 2034

Figure 148: East Asia Market Value (US$ Million) by Country, 2024 to 2034

Figure 149: East Asia Market Value (US$ Million) Analysis by Country, 2019 to 2034

Figure 150: East Asia Market Volume (Units) Analysis by Country, 2019 to 2034

Figure 151: East Asia Market Value Share (%) and BPS Analysis by Country, 2024 to 2034

Figure 152: East Asia Market Y-o-Y Growth (%) Projections by Country, 2024 to 2034

Figure 153: East Asia Market Value (US$ Million) Analysis by Type, 2019 to 2034

Figure 154: East Asia Market Volume (Units) Analysis by Type, 2019 to 2034

Figure 155: East Asia Market Value Share (%) and BPS Analysis by Type, 2024 to 2034

Figure 156: East Asia Market Y-o-Y Growth (%) Projections by Type, 2024 to 2034

Figure 157: East Asia Market Value (US$ Million) Analysis by Ammunition, 2019 to 2034

Figure 158: East Asia Market Volume (Units) Analysis by Ammunition, 2019 to 2034

Figure 159: East Asia Market Value Share (%) and BPS Analysis by Ammunition, 2024 to 2034

Figure 160: East Asia Market Y-o-Y Growth (%) Projections by Ammunition, 2024 to 2034

Figure 161: East Asia Market Value (US$ Million) Analysis by Application, 2019 to 2034

Figure 162: East Asia Market Volume (Units) Analysis by Application, 2019 to 2034

Figure 163: East Asia Market Value Share (%) and BPS Analysis by Application, 2024 to 2034

Figure 164: East Asia Market Y-o-Y Growth (%) Projections by Application, 2024 to 2034

Figure 165: East Asia Market Attractiveness by Type, 2024 to 2034

Figure 166: East Asia Market Attractiveness by Ammunition, 2024 to 2034

Figure 167: East Asia Market Attractiveness by Application, 2024 to 2034

Figure 168: East Asia Market Attractiveness by Country, 2024 to 2034

Figure 169: Middle East and Africa Market Value (US$ Million) by Type, 2024 to 2034

Figure 170: Middle East and Africa Market Value (US$ Million) by Ammunition, 2024 to 2034

Figure 171: Middle East and Africa Market Value (US$ Million) by Application, 2024 to 2034

Figure 172: Middle East and Africa Market Value (US$ Million) by Country, 2024 to 2034

Figure 173: Middle East and Africa Market Value (US$ Million) Analysis by Country, 2019 to 2034

Figure 174: Middle East and Africa Market Volume (Units) Analysis by Country, 2019 to 2034

Figure 175: Middle East and Africa Market Value Share (%) and BPS Analysis by Country, 2024 to 2034

Figure 176: Middle East and Africa Market Y-o-Y Growth (%) Projections by Country, 2024 to 2034

Figure 177: Middle East and Africa Market Value (US$ Million) Analysis by Type, 2019 to 2034

Figure 178: Middle East and Africa Market Volume (Units) Analysis by Type, 2019 to 2034

Figure 179: Middle East and Africa Market Value Share (%) and BPS Analysis by Type, 2024 to 2034

Figure 180: Middle East and Africa Market Y-o-Y Growth (%) Projections by Type, 2024 to 2034

Figure 181: Middle East and Africa Market Value (US$ Million) Analysis by Ammunition, 2019 to 2034

Figure 182: Middle East and Africa Market Volume (Units) Analysis by Ammunition, 2019 to 2034

Figure 183: Middle East and Africa Market Value Share (%) and BPS Analysis by Ammunition, 2024 to 2034

Figure 184: Middle East and Africa Market Y-o-Y Growth (%) Projections by Ammunition, 2024 to 2034

Figure 185: Middle East and Africa Market Value (US$ Million) Analysis by Application, 2019 to 2034

Figure 186: Middle East and Africa Market Volume (Units) Analysis by Application, 2019 to 2034

Figure 187: Middle East and Africa Market Value Share (%) and BPS Analysis by Application, 2024 to 2034

Figure 188: Middle East and Africa Market Y-o-Y Growth (%) Projections by Application, 2024 to 2034

Figure 189: Middle East and Africa Market Attractiveness by Type, 2024 to 2034

Figure 190: Middle East and Africa Market Attractiveness by Ammunition, 2024 to 2034

Figure 191: Middle East and Africa Market Attractiveness by Application, 2024 to 2034

Figure 192: Middle East and Africa Market Attractiveness by Country, 2024 to 2034

Frequently Asked Questions

What is the Estimated Valuation of the Ammunition Market?

The ammunition market is predicted to be worth USD 27.7 billion by 2024.

What is the Sales Forecast for the Ammunition Market through 2034?

The ammunition market is expected to reach USD 50.4 billion by 2034.

At What Rate is the Ammunition Market Growing over the Forecast Period?

The ammunition market is growing at a CAGR of 6.2% from 2024 to 2034.

Which are the Major Companies in the Ammunition Market?

Some key players in the market are Northrop Grumman Corporation, FN Herstal, Olin Corporation, General Dynamics Corporation, BAE Systems, Inc., and Rheinmetall Defense.

Which is the Leading Product Type in the Market?

The full metal jacket segment is the leading type, expanding at a CAGR of 6.0% through 2034.

Future Market Insights

Ammunition Market