Anti-D Immunoglobulin Market Size, Share, and Forecast Outlook 2025 to 2035

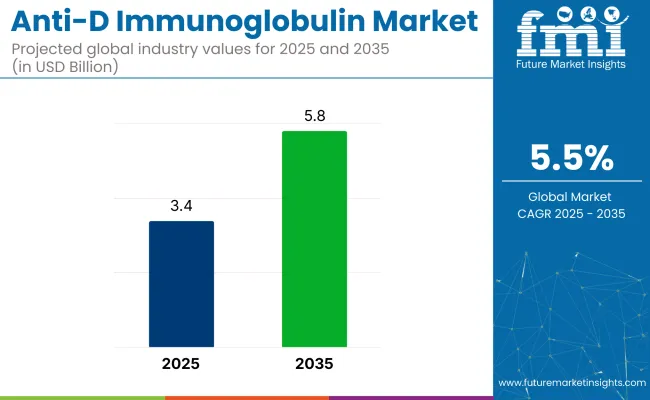
The global anti-D immunoglobulin market is forecasted to grow from USD 3.42 billion in 2025 to USD 5.85 billion by 2035, expanding at a CAGR of 5.53%.
Quick Stats for the Anti-D Immunoglobulin Market

  • Market Size (2025): USD 3.4 billion
  • Forecast Value (2035): USD 5.85 billion
  • Forecast CAGR (2025 to 2035): 5.53%
  • Leading Segment: Hospitals (75% share)
  • Key Growth Region: Asia Pacific (China, India)
  • Key Players: CSL Behring, Grifols, Octapharma, Kedrion Biopharma, and Bayer AG

Anti D Immunoglobulin Market

The industry is being shaped by a rising number of Rh-negative pregnancies, growing awareness of hemolytic disease of the fetus and newborn (HDFN), and routine implementation of Rh immunoprophylaxis in prenatal care. Healthcare systems across developed and emerging economies are reinforcing preventive measures to minimize alloimmunization-related complications, thereby boosting anti-D product demand.

In a recent statement, Amir London, CEO of Kamada Pharmaceuticals, highlighted the company's plans to expand its hyperimmune plasma collection capacity, saying, “We plan to significantly expand our hyperimmune plasma collection capacity by investing in B&PR’s center at Beaumont, Texas, and leveraging its FDA license to open additional centers in the USA” This strategic move aims to strengthen Kamada's position in the industry by enhancing plasma collection capabilities.

The industry holds a specialized share within its parent markets. Within the immunoglobulin market, it accounts for approximately 10-12%, as Anti-D is one of the key types of immunoglobulin used in specific medical treatments, such as preventing Rh incompatibility. In the biopharmaceuticals market, the share is around 1-2%, given that it is a niche product in the broader pharmaceutical industry.

Within the vaccines and immunotherapy market, its share is minimal, around 0.5%, as it is focused on a specific immunotherapy for Rh-negative pregnancies. In the blood products and plasma derivatives market, the medicine contributes about 5-7%, as it is derived from plasma but is less common compared to other blood products. In the healthcare and hospital supplies market, its share is around 3-4%, being used primarily in hospitals for maternal care.

The medicine plays a critical role in preventing Rh sensitization in Rh-negative mothers exposed to Rh-positive fetal red blood cells. Increasing clinical adherence to antenatal and postnatal prophylaxis protocols is bolstering product usage in hospitals and maternity clinics.

Analyzing Anti-D Immunoglobulin Market by Top Investment Segments

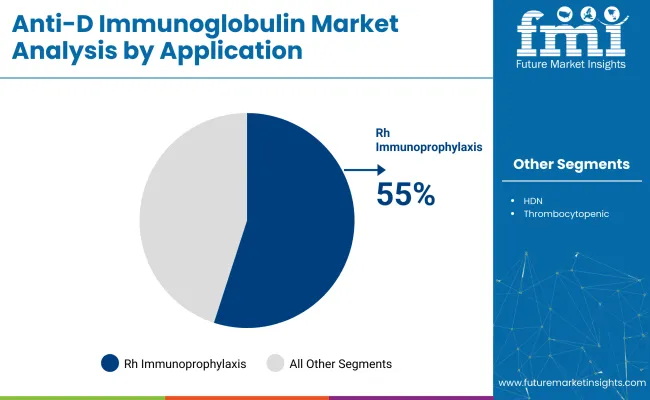
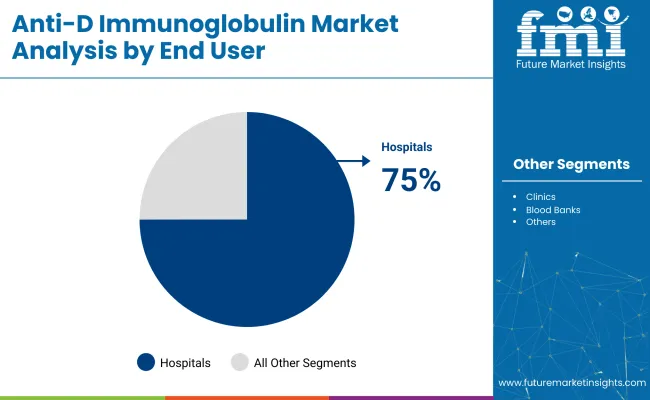
The global industry is projected to grow, with key segments including Rh immunoprophylaxis during pregnancy, intravenous anti-D immunoglobulin, and hospitals as the primary end-users. By 2025, Rh immunoprophylaxis is expected to capture 55%, hospitals will hold 75%, and intravenous formulations will lead the product type segment with 60%.

Rh immunoprophylaxis during pregnancy leads the application segment with 55% share in 2025

The Rh immunoprophylaxis during pregnancy application segment is expected to account for 55% of the industry share in 2025. This growth is driven by the widespread adoption of prophylactic anti-D programs, particularly for Rh-negative women. The routine administration of the medicine at 28 weeks of gestation and postpartum is standard practice in developed regions.

Awareness campaigns in emerging industries are increasing maternal screening rates and promoting Rh immunoprophylaxis as a core intervention for perinatal safety. Anti-D products such as Rhophylac by CSL Behring and RhoGAM by Kedrion Biopharma are widely used to prevent maternal alloimmunization and fetal complications.
  • Prophylactic anti-D programs targeting Rh-negative women
  • Routine administration in developed regions, growing awareness in emerging industries
  • Increased maternal screening and promotion by governments and NGOs

Anti D Immunoglobulin Market Analysis By Application

Hospitals dominate the end-user segment with 75% share in 2025

The hospital segment is projected to account for 75% of the industry by 2025. Hospitals are the primary setting for administering the medicine, particularly through antenatal clinics, labor wards, and emergency obstetric care units. Hospital-based systems are investing in integrated maternal health records and staff training to ensure adherence to Rh immunoprophylaxis protocols.

Manufacturers like BPL, Grifols, and Octapharma are providing intramuscular and intravenous formulations designed for immediate postnatal care. With centralized inventory management and regulatory oversight, hospitals remain the most trusted and reliable channel for safe and efficient anti-D immunoglobulin administration.
  • Primary setting for Rh immunoglobulin administration
  • Investment in maternal health records and staff training to ensure protocol adherence
  • Trusted channel for safe, regulated, and efficient anti-D immunoglobulin delivery

Anti D Immunoglobulin Market Analysis By End User

Intravenous anti-D immunoglobulin leads the product type segment with 60% share in 2025

Intravenous anti-D immunoglobulin is expected to capture 60% of the industry share in 2025, driven by its fast-acting and effective delivery, especially for postnatal care in hospital settings. This method’s ability to deliver immediate results makes it the preferred choice for preventing Rh incompatibility complications.

Leading manufacturers such as Grifols, CSL Behring, and Octapharma offer intravenous products administered immediately after delivery to reduce maternal alloimmunization. The rapid absorption and efficacy of intravenous anti-D immunoglobulin further contribute to its dominance in the industry.

  • Fast-acting and effective delivery preferred for postnatal care
  • Preferred choice for preventing Rh incompatibility complications
  • Quick absorption and efficacy in reducing maternal alloimmunization

Liquid formulation segment to hold 50% market share in 2025

Liquid formulations of the medicine are expected to dominate the dosage form segment, capturing 50% of the industry share in 2025. These ready-to-use formulations require no reconstitution, making them highly convenient for healthcare providers, especially in urgent care situations such as childbirth.

Liquid formulations also reduce preparation time, enhancing operational efficiency in hospital settings. Major manufacturers like Grifols and BPL have focused on developing liquid formulations to meet the growing demand for fast and reliable interventions in perinatal care.

  • Ready-to-use formulations that eliminate reconstitution
  • Essential for reducing preparation time in urgent care situations
  • Increasing demand for fast and reliable interventions in perinatal care

Top Anti-D Immunoglobulin Market Dynamics

The industry is growing due to increased prenatal screening and awareness of Rh incompatibility, improving maternal care and reducing HDN incidence. However, supply constraints, high production costs, and regulatory challenges hinder scaling, limiting access, especially in developing regions.

Growing Prenatal Screening and Rh Incompatibility Awareness Drive Anti-D Usage

The growing demand for the medicine is largely driven by expanding prenatal screening programs and increasing awareness of Rh incompatibility. Non-invasive fetal RhD genotyping allows for targeted administration, helping conserve scarce Anti-D supplies by only treating at-risk pregnancies.

Countries such as Denmark, Switzerland, and the Netherlands have adopted this practice, improving efficiency. In the Asia-Pacific region, where Rh-negative pregnancies are more common, public health campaigns and maternal health initiatives are fostering broader acceptance of Anti-D use, reducing the incidence of Hemolytic Disease of the Newborn (HDN) and positioning Anti-D as a key component of prenatal care.

  • Prenatal screening and RhD genotyping ensure targeted use of Anti-D, conserving limited supplies.
  • Increased maternal health awareness, especially in Asia-Pacific, promotes routine Anti-D use for Rh prophylaxis.
  • The medicine helps reduce the incidence of Hemolytic Disease of the Newborn (HDN) globally.

Supply Constraints, Production Costs, and Regulatory Oversight Limit Scaling

Despite rising demand, the industry faces challenges related to supply constraints, high production costs, and regulatory hurdles. The production of Anti-D relies on rare Rh-negative plasma donors and complex plasma fractionation, resulting in supply shortages and elevated prices. In the USA, the FDA and ACOG have issued shortage warnings as a few manufacturers struggle to meet demand.

Additionally, the high complexity of manufacturing, including viral inactivation and purification, limits capacity expansion. Strict regulations around biologics safety and donor screening, along with trade barriers, are further slowing the growth of newer recombinant or monoclonal Anti-D products.
  • The reliance on rare Rh-negative plasma donors and complex fractionation leads to supply shortages and high costs.
  • Manufacturing complexities, including viral inactivation and purification, limit production capacity expansion.
  • Stringent regulations and trade barriers restrict the growth of newer Anti-D formulations, including recombinant or monoclonal products.

Analyzing Top Countries Formulating, Distributing, and Supplying Anti-D Immunoglobulin

Country Wise Analysis Of Anti D Immunoglobulin Market Cagr 2025 To 2035

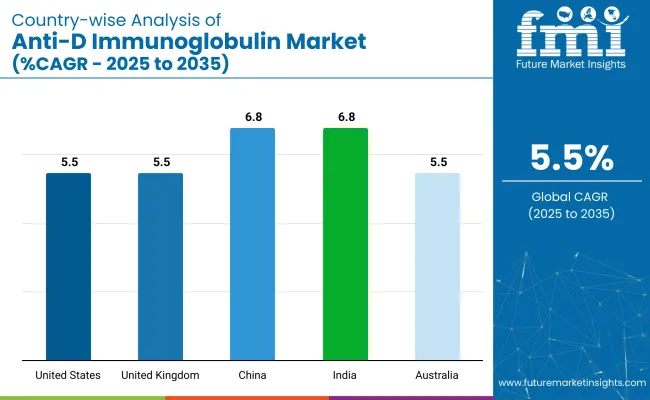
Countries CAGR (2025 to 2035)
United States 5.5%
United Kingdom 5.5%
China 6.8%
India 6.8%
Australia 5.5%

The global industry is projected to grow at a CAGR of 5.5% from 2025 to 2035. The United States, United Kingdom, and Australia, all with a CAGR of 5.5%, show steady growth, driven by increasing awareness and demand for the medicine, particularly in the treatment and prevention of Rh immunization during pregnancy. These developed industries benefit from well-established healthcare systems and a strong focus on maternal and child health.

In contrast, China and India, both with a CAGR of 6.8%, exhibit faster growth, fueled by rising healthcare access, improving medical infrastructure, and a growing awareness of maternal health needs. The demand for the medicine is expected to increase significantly in these emerging industries, driven by urbanization, rising income levels, and the expansion of healthcare services.

While developed industries show stable growth, China and India stand out as the fastest-growing industries, indicating the growing role of emerging economies in shaping the future of the industry.

The report covers in-depth analysis of 40+ countries; five top-performing OECD and BRICS countries are highlighted below.

Analysis of Anti-D Immunoglobulin Market in the United States

Sales of the medicine in the United States are set to record a CAGR of 5.5% through 2035. Demand has been anchored by near-universal Rh blood-group screening and mature obstetric protocols. RhoGAM, WinRho SDF, and HyperRHO are administered across hospital labor wards and outpatient maternal-fetal clinics.

CDC guidelines mandating prophylaxis at 28 weeks and postpartum have been rigorously followed. Medicare and commercial insurers have reimbursed prophylaxis without prior authorization, preserving high compliance. Refrigerated logistics routed through group-purchasing organizations have secured product integrity across states. The USA continues to command the largest revenue share in Rh(D) immune-globulin administration.

  • Medicaid postpartum extension has improved follow-up anti-D dosing compliance.
  • EHR prompts have reduced missed flags for Rh-negative deliveries.
  • Domestic plasma-fractionation upgrades have ensured tighter alignment of supply with HDN risk.

Future Outlook for Anti-D Immunoglobulin Market in the United Kingdom

Sales of the medicine in the United Kingdom are projected to grow at a CAGR of 5.5% through 2035. NHS-funded antenatal prophylaxis and unified guidelines from NICE and RCOG have driven strong compliance. Rhophylac has been supplied through the National Blood Service, enabling direct clinical access.

Midwife-led protocols at 28 and 34 weeks have standardised usage across public hospitals. Centralised procurement has kept NHS costs predictable amid rising patient volume. Strong integration with electronic maternity records has supported real-time flagging of Rh-negative patients, reducing missed doses. The UK remains a benchmark for Rh immunoprophylaxis delivery within nationalised health systems.

  • Low-risk patients now receive prophylaxis in midwife-led community clinics.
  • Rh-negative audit clusters have driven region-specific inventory planning.
  • Domestic plasma-sourcing pilots have targeted import substitution.

Demand Forecast for Anti-D Immunoglobulin Market in China

Demand in China is estimated to grow at a CAGR of 6.8% through 2035. Demographic shifts from two-child and three-child policies have enlarged the Rh-negative pregnancy cohort. Provincial hospitals have made Rh typing routine in the first trimester, accelerating early immunoprophylaxis.

Domestic manufacturers like Hualan Biological have expanded production under fast-track NMPA approval. Government price tenders have driven volume while capping retail pricing. Cold-chain logistics investments have extended reliable prophylaxis to inland regions. China has positioned itself as a major buyer and increasingly self-sufficient producer of Rh immune-globulin.

  • Voluntary Rh-negative registries have strengthened donor pools in coastal provinces.
  • Maternal-care apps now include Rh-prophylaxis educational modules.
  • Compliance dashboards have been embedded in tertiary hospital systems.

Analysis of Anti-D Immunoglobulin Market in India

The industry in India is set to record a CAGR of 6.8% through 2035. Institutional deliveries have risen due to Janani Suraksha Yojana and Ayushman Bharat, placing anti-D within routine antenatal care. Bharat Serums, Biological E, and Intas have expanded vial production and regional distribution.

Rh screening has been promoted through state public-health missions, even in tier-3 districts. Cold-chain integrity has improved through WHO-backed child and maternal logistics investments. Clinical training under FOGSI and targeted education campaigns have built awareness among practitioners. India is being repositioned as both a price-sensitive demand hub and emerging manufacturing base.

  • District-level procurement has unlocked better rural coverage.
  • Free Rh typing at mobile health camps has accelerated uptake.
  • Domestic plasma-sourcing goals are targeting 60%+ self-reliance by 2030.

Anti-D Immunoglobulin Market Growth Outlook in Australia

Sales of the medicine in Australia are forecasted to grow at a CAGR of 5.5% through 2035. The National Blood Authority has centralized purchasing and contracts with CSL Behring, supplying Rh(D) immunoglobulin-VF to public hospitals. Medicare covers administration at 28 and 34 weeks, driving consistent prophylaxis across all regions.

Compliance rates remain high due to professional training, guideline enforcement, and reliable transport. Regional health services follow uniform cold-chain protocols monitored via digital audits. Product wastage is low, and adherence to postpartum dosing remains stable. Australia has continued to exhibit a mature, high-coverage profile in Rh prophylaxis.
  • Government procurement aligns closely with CSL’s domestic production schedules.
  • Drone delivery initiatives serve isolated maternity clinics.
  • Social media outreach by midwives enhances patient literacy.

Leading Anti-D Immunoglobulin Suppliers

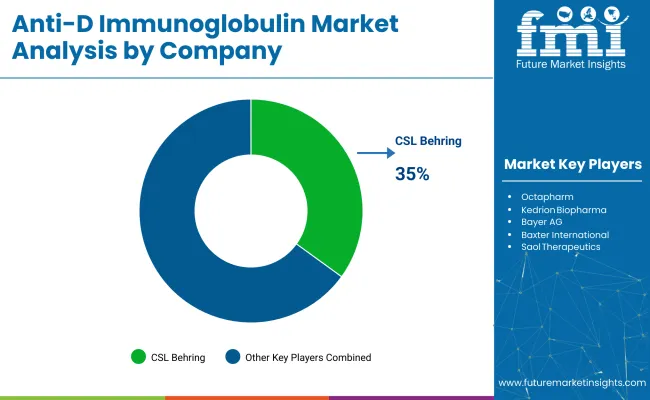
Anti D Immunoglobulin Market Analysis By Company

The global industry features a competitive landscape with dominant players, key players, and emerging players. Dominant players such as CSL Behring, Grifols, and Octapharma lead the industry with extensive product portfolios, strong R&D capabilities, and robust distribution networks across maternal and neonatal healthcare sectors.

Key players including Kedrion Biopharma, Bayer, and Bio Products Laboratory offer specialized formulations tailored to specific applications and regional industries. Emerging players, such as Saol Therapeutics, China Biologic Products, and BDI Pharma, focus on innovative technologies and cost-effective solutions, expanding their presence in the global industry.

Recent Anti-D Immunoglobulin Industry News

  • In February 2024, the FDA reported shortages of Rho(D) immune globulin, citing manufacturing issues and external factors affecting the USA anti-D plasma industry. Kedrion Biopharma confirmed that supply would remain allocated throughout most of 2024.
  • In April 2024, Kamada Pharmaceuticals announced limited availability of WinRho® SDF (300 mcg/vial) to help facilities manage their inventory during the shortage. This move provides more flexible options for healthcare providers.

Report Scope

Report Attributes Details
Industry Size in 2025 USD 3.4 billion
Industry Size in 2035 USD 5.8 billion
CAGR (2025 to 2035) 5.5%
Base Year for Estimation 2024
Historical Period 2020 to 2024
Projections Period 2025 to 2035
Quantitative Units USD billion for value and million units for volume
Product Type Segmentation Intramuscular Anti-D Immunoglobulin, Intravenous Anti-D Immunoglobulin
Application Segmentation Hemolytic Disease of the Newborn (HDN), Rh Immunoprophylaxis During Pregnancy, Management of Thrombocytopenic Patients
Route of Administration Segmentation Parenteral Administration, Intravenous Administration, Subcutaneous Administration
End-User Segmentation Hospitals, Clinics, Blood Banks, Research Laboratories
Dosage Form Segmentation Liquid Formulation, Lyophilized Powder Formulation, Ready-to-Use Formulation
Regions Covered North America, Europe, Asia-Pacific, Latin America, Middle East and Africa
Countries Covered United States, Canada, Mexico, Brazil, Argentina, Germany, France, United Kingdom, Italy, Spain, Netherlands, China, India, Japan, South Korea, Australia, New Zealand, GCC Countries, South Africa
Key Players Influencing the Industry Grifols, CSL Behring, Octapharma, Kedrion Biopharma, Bayer AG, Baxter International, Saol Therapeutics, Bio Products Laboratory, China Biologic Products, BDI Pharma
Additional Attributes Dollar sales by product type, application, and route of administration, increasing demand for immunoglobulin in Rh prophylaxis, growing adoption in neonatal care and immunization, regional variations in healthcare infrastructure for immunoglobulin distribution.

Key Players in Anti-D Immunoglobulin Market

  • Grifols
  • CSL Behring
  • Octapharma
  • Kedrion Biopharma
  • Bayer AG
  • Baxter International
  • Saol Therapeutics
  • Bio Products Laboratory
  • China Biologic Products
  • BDI Pharma

Anti-D Immunoglobulin Market Analyzed by Key Investment Segments

By Product Type:

The industry is segmented by product type into intramuscular anti-D immunoglobulin and intravenous anti-D immunoglobulin.

By Application:

Based on application, the industry includes hemolytic disease of the newborn (HDN), Rh immunoprophylaxis during pregnancy, and management of thrombocytopenic patients.

By Route of Administration:

By route of administration, the industry is segmented into parenteral administration, intravenous administration, and subcutaneous administration.

By End-User:

In terms of end users, the industry includes hospitals, clinics, blood banks, and research laboratories.

By Dosage Form:

Based on dosage form, the industry is categorized into liquid formulation, lyophilized powder formulation, and ready-to-use formulation.

By Region:

Geographically, the industry is analyzed across North America, Europe, Asia-Pacific, Latin America, and the Middle East and Africa.

Table of Content

  1. Executive Summary
    • Global Market Outlook
    • Demand-side Trends
    • Supply-side Trends
    • Technology Roadmap Analysis
    • Analysis and Recommendations
  2. Market Overview
    • Market Coverage / Taxonomy
    • Market Definition / Scope / Limitations
  3. Market Background
    • Market Dynamics
      • Drivers
      • Restraints
      • Opportunity
      • Trends
    • Scenario Forecast
      • Demand in Optimistic Scenario
      • Demand in Likely Scenario
      • Demand in Conservative Scenario
    • Opportunity Map Analysis
    • Product Life Cycle Analysis
    • Supply Chain Analysis
      • Supply Side Participants and their Roles
        • Producers
        • Mid-Level Participants (Traders/ Agents/ Brokers)
        • Wholesalers and Distributors
      • Value Added and Value Created at Node in the Supply Chain
      • List of Raw Material Suppliers
      • List of Existing and Potential Buyer’s
    • Investment Feasibility Matrix
    • Value Chain Analysis
      • Profit Margin Analysis
      • Wholesalers and Distributors
      • Retailers
    • PESTLE and Porter’s Analysis
    • Regulatory Landscape
      • By Key Regions
      • By Key Countries
    • Regional Parent Market Outlook
    • Production and Consumption Statistics
    • Import and Export Statistics
  4. Global Market Analysis 2020 to 2024 and Forecast, 2025 to 2035
    • Historical Market Size Value (USD Billion) & Volume (Million Units) Analysis, 2020 to 2024
    • Current and Future Market Size Value (USD Billion) & Volume (Million Units) Projections, 2025 to 2035
      • Y-o-Y Growth Trend Analysis
      • Absolute $ Opportunity Analysis
  5. Global Market Pricing Analysis 2020 to 2024 and Forecast 2025 to 2035
  6. Global Market Analysis 2020 to 2024 and Forecast 2025 to 2035, By Product Type
    • Introduction / Key Findings
    • Historical Market Size Value (USD Billion) & Volume (Million Units) Analysis By Product Type, 2020 to 2024
    • Current and Future Market Size Value (USD Billion) & Volume (Million Units) Analysis and Forecast By Product Type, 2025 to 2035
      • Intramuscular Anti-D Immunoglobulin
      • Intravenous Anti-D Immunoglobulin
    • Y-o-Y Growth Trend Analysis By Product Type, 2020 to 2024
    • Absolute $ Opportunity Analysis By Product Type, 2025 to 2035
  7. Global Market Analysis 2020 to 2024 and Forecast 2025 to 2035, By Application
    • Introduction / Key Findings
    • Historical Market Size Value (USD Billion) & Volume (Million Units) Analysis By Application, 2020 to 2024
    • Current and Future Market Size Value (USD Billion) & Volume (Million Units) Analysis and Forecast By Application, 2025 to 2035
      • Hemolytic Disease of the Newborn (HDN)
      • Rh Immunoprophylaxis During Pregnancy
      • Management of Thrombocytopenic Patients
    • Y-o-Y Growth Trend Analysis By Application, 2020 to 2024
    • Absolute $ Opportunity Analysis By Application, 2025 to 2035
  8. Global Market Analysis 2020 to 2024 and Forecast 2025 to 2035, By Route of Administration
    • Introduction / Key Findings
    • Historical Market Size Value (USD Billion) & Volume (Million Units) Analysis By Route of Administration, 2020 to 2024
    • Current and Future Market Size Value (USD Billion) & Volume (Million Units) Analysis and Forecast By Route of Administration, 2025 to 2035
      • Parenteral Administration
      • Intravenous Administration
      • Subcutaneous Administration
    • Y-o-Y Growth Trend Analysis By Route of Administration, 2020 to 2024
    • Absolute $ Opportunity Analysis By Route of Administration, 2025 to 2035
  9. Global Market Analysis 2020 to 2024 and Forecast 2025 to 2035, By End-User
    • Introduction / Key Findings
    • Historical Market Size Value (USD Billion) & Volume (Million Units) Analysis By End-User, 2020 to 2024
    • Current and Future Market Size Value (USD Billion) & Volume (Million Units) Analysis and Forecast By End-User, 2025 to 2035
      • Hospitals
      • Clinics
      • Blood Banks
      • Research Laboratories
    • Y-o-Y Growth Trend Analysis By End-User, 2020 to 2024
    • Absolute $ Opportunity Analysis By End-User, 2025 to 2035
  10. Global Market Analysis 2020 to 2024 and Forecast 2025 to 2035, By Dosage Form
    • Introduction / Key Findings
    • Historical Market Size Value (USD Billion) & Volume (Million Units) Analysis By Dosage Form, 2020 to 2024
    • Current and Future Market Size Value (USD Billion) & Volume (Million Units) Analysis and Forecast By Dosage Form, 2025 to 2035
      • Liquid Formulation
      • Lyophilized Powder Formulation
      • Ready-to-Use Formulation
    • Y-o-Y Growth Trend Analysis By Dosage Form, 2020 to 2024
    • Absolute $ Opportunity Analysis By Dosage Form, 2025 to 2035
  11. Global Market Analysis 2020 to 2024 and Forecast 2025 to 2035, By Region
    • Introduction
    • Historical Market Size Value (USD Billion) & Volume (Million Units) Analysis By Region, 2020 to 2024
    • Current Market Size Value (USD Billion) & Volume (Million Units) Analysis and Forecast By Region, 2025 to 2035
      • North America
      • Latin America
      • Western Europe
      • Eastern Europe
      • East Asia
      • South Asia & Pacific
      • Middle East and Africa
    • Market Attractiveness Analysis By Region
  12. North America Market Analysis 2020 to 2024 and Forecast 2025 to 2035, By Country
    • Historical Market Size Value (USD Billion) & Volume (Million Units) Trend Analysis By Market Taxonomy, 2020 to 2024
    • Market Size Value (USD Billion) & Volume (Million Units) Forecast By Market Taxonomy, 2025 to 2035
      • By Country
        • USA
        • Canada
        • Mexico
      • By Product Type
      • By Application
      • By Route of Administration
      • By End-User
      • By Dosage Form
    • Market Attractiveness Analysis
      • By Country
      • By Product Type
      • By Application
      • By Route of Administration
      • By End-User
      • By Dosage Form
    • Key Takeaways
  13. Latin America Market Analysis 2020 to 2024 and Forecast 2025 to 2035, By Country
    • Historical Market Size Value (USD Billion) & Volume (Million Units) Trend Analysis By Market Taxonomy, 2020 to 2024
    • Market Size Value (USD Billion) & Volume (Million Units) Forecast By Market Taxonomy, 2025 to 2035
      • By Country
        • Brazil
        • Argentina
        • Rest of LATAM
      • By Product Type
      • By Application
      • By Route of Administration
      • By End-User
      • By Dosage Form
    • Market Attractiveness Analysis
      • By Country
      • By Product Type
      • By Application
      • By Route of Administration
      • By End-User
      • By Dosage Form
    • Key Takeaways
  14. Western Europe Market Analysis 2020 to 2024 and Forecast 2025 to 2035, By Country
    • Historical Market Size Value (USD Billion) & Volume (Million Units) Trend Analysis By Market Taxonomy, 2020 to 2024
    • Market Size Value (USD Billion) & Volume (Million Units) Forecast By Market Taxonomy, 2025 to 2035
      • By Country
        • Germany
        • Italy
        • France
        • UK
        • Spain
        • BENELUX
        • Nordic
        • Rest of W.Europe
      • By Product Type
      • By Application
      • By Route of Administration
      • By End-User
      • By Dosage Form
    • Market Attractiveness Analysis
      • By Country
      • By Product Type
      • By Application
      • By Route of Administration
      • By End-User
      • By Dosage Form
    • Key Takeaways
  15. Eastern Europe Market Analysis 2020 to 2024 and Forecast 2025 to 2035, By Country
    • Historical Market Size Value (USD Billion) & Volume (Million Units) Trend Analysis By Market Taxonomy, 2020 to 2024
    • Market Size Value (USD Billion) & Volume (Million Units) Forecast By Market Taxonomy, 2025 to 2035
      • By Country
        • Russia
        • Hungary
        • Poland
        • Balkan & Baltics
        • Rest of E. Europe
      • By Product Type
      • By Application
      • By Route of Administration
      • By End-User
      • By Dosage Form
    • Market Attractiveness Analysis
      • By Country
      • By Product Type
      • By Application
      • By Route of Administration
      • By End-User
      • By Dosage Form
    • Key Takeaways
  16. East Asia Market Analysis 2020 to 2024 and Forecast 2025 to 2035, By Country
    • Historical Market Size Value (USD Billion) & Volume (Million Units) Trend Analysis By Market Taxonomy, 2020 to 2024
    • Market Size Value (USD Billion) & Volume (Million Units) Forecast By Market Taxonomy, 2025 to 2035
      • By Country
        • China
        • Japan
        • South Korea
      • By Product Type
      • By Application
      • By Route of Administration
      • By End-User
      • By Dosage Form
    • Market Attractiveness Analysis
      • By Country
      • By Product Type
      • By Application
      • By Route of Administration
      • By End-User
      • By Dosage Form
    • Key Takeaways
  17. South Asia & Pacific Market Analysis 2020 to 2024 and Forecast 2025 to 2035, By Country
    • Historical Market Size Value (USD Billion) & Volume (Million Units) Trend Analysis By Market Taxonomy, 2020 to 2024
    • Market Size Value (USD Billion) & Volume (Million Units) Forecast By Market Taxonomy, 2025 to 2035
      • By Country
        • India
        • Australia & New Zealand
        • ASEAN
        • Rest of SAP
      • By Product Type
      • By Application
      • By Route of Administration
      • By End-User
      • By Dosage Form
    • Market Attractiveness Analysis
      • By Country
      • By Product Type
      • By Application
      • By Route of Administration
      • By End-User
      • By Dosage Form
    • Key Takeaways
  18. Middle East and Africa Market Analysis 2020 to 2024 and Forecast 2025 to 2035, By Country
    • Historical Market Size Value (USD Billion) & Volume (Million Units) Trend Analysis By Market Taxonomy, 2020 to 2024
    • Market Size Value (USD Billion) & Volume (Million Units) Forecast By Market Taxonomy, 2025 to 2035
      • By Country
        • GCC Countries
        • Northern Africa
        • South Africa
        • Turkiye
        • Rest of MEA
      • By Product Type
      • By Application
      • By Route of Administration
      • By End-User
      • By Dosage Form
    • Market Attractiveness Analysis
      • By Country
      • By Product Type
      • By Application
      • By Route of Administration
      • By End-User
      • By Dosage Form
    • Key Takeaways
  19. Key Countries Market Analysis
    • USA
      • Pricing Analysis
      • Market Share Analysis, 2024
        • By Product Type
        • By Application
        • By Route of Administration
        • By End-User
        • By Dosage Form
    • Canada
      • Pricing Analysis
      • Market Share Analysis, 2024
        • By Product Type
        • By Application
        • By Route of Administration
        • By End-User
        • By Dosage Form
    • Brazil
      • Pricing Analysis
      • Market Share Analysis, 2024
        • By Product Type
        • By Application
        • By Route of Administration
        • By End-User
        • By Dosage Form
    • Mexico
      • Pricing Analysis
      • Market Share Analysis, 2024
        • By Product Type
        • By Application
        • By Route of Administration
        • By End-User
        • By Dosage Form
    • Argentina
      • Pricing Analysis
      • Market Share Analysis, 2024
        • By Product Type
        • By Application
        • By Route of Administration
        • By End-User
        • By Dosage Form
  20. Market Structure Analysis
    • Competition Dashboard
    • Competition Benchmarking
    • Market Share Analysis of Top Players
      • By Regional
      • By Product Type
      • By Application
      • By Route of Administration
      • By End-User
      • By Dosage Form
  21. Competition Analysis
    • Competition Deep Dive
      • Grifols
        • Overview
        • Product Portfolio
        • Profitability by Market Segments (Product/Age /Sales Channel/Region)
        • Sales Footprint
        • Strategy Overview
          • Marketing Strategy
          • Product Strategy
          • Channel Strategy
      • CSL Behring
        • Overview
        • Product Portfolio
        • Profitability by Market Segments (Product/Age /Sales Channel/Region)
        • Sales Footprint
        • Strategy Overview
          • Marketing Strategy
          • Product Strategy
          • Channel Strategy
      • Octapharma
        • Overview
        • Product Portfolio
        • Profitability by Market Segments (Product/Age /Sales Channel/Region)
        • Sales Footprint
        • Strategy Overview
          • Marketing Strategy
          • Product Strategy
          • Channel Strategy
      • Kedrion Biopharma
        • Overview
        • Product Portfolio
        • Profitability by Market Segments (Product/Age /Sales Channel/Region)
        • Sales Footprint
        • Strategy Overview
          • Marketing Strategy
          • Product Strategy
          • Channel Strategy
      • Bayer AG
        • Overview
        • Product Portfolio
        • Profitability by Market Segments (Product/Age /Sales Channel/Region)
        • Sales Footprint
        • Strategy Overview
          • Marketing Strategy
          • Product Strategy
          • Channel Strategy
      • Baxter International
        • Overview
        • Product Portfolio
        • Profitability by Market Segments (Product/Age /Sales Channel/Region)
        • Sales Footprint
        • Strategy Overview
          • Marketing Strategy
          • Product Strategy
          • Channel Strategy
      • Saol Therapeutics
        • Overview
        • Product Portfolio
        • Profitability by Market Segments (Product/Age /Sales Channel/Region)
        • Sales Footprint
        • Strategy Overview
          • Marketing Strategy
          • Product Strategy
          • Channel Strategy
      • Bio Products Laboratory
        • Overview
        • Product Portfolio
        • Profitability by Market Segments (Product/Age /Sales Channel/Region)
        • Sales Footprint
        • Strategy Overview
          • Marketing Strategy
          • Product Strategy
          • Channel Strategy
      • China Biologic Products
        • Overview
        • Product Portfolio
        • Profitability by Market Segments (Product/Age /Sales Channel/Region)
        • Sales Footprint
        • Strategy Overview
          • Marketing Strategy
          • Product Strategy
          • Channel Strategy
      • BDI Pharma
        • Overview
        • Product Portfolio
        • Profitability by Market Segments (Product/Age /Sales Channel/Region)
        • Sales Footprint
        • Strategy Overview
          • Marketing Strategy
          • Product Strategy
          • Channel Strategy
  22. Assumptions & Acronyms Used
  23. Research Methodology

List of Tables

  • Table 1: Global Market Value (USD Billion) Forecast by Region, 2020 to 2035
  • Table 2: Global Market Volume (Million Units) Forecast by Region, 2020 to 2035
  • Table 3: Global Market Value (USD Billion) Forecast by Product Type, 2020 to 2035
  • Table 4: Global Market Volume (Million Units) Forecast by Product Type, 2020 to 2035
  • Table 5: Global Market Value (USD Billion) Forecast by Application, 2020 to 2035
  • Table 6: Global Market Volume (Million Units) Forecast by Application, 2020 to 2035
  • Table 7: Global Market Value (USD Billion) Forecast by Route of Administration, 2020 to 2035
  • Table 8: Global Market Volume (Million Units) Forecast by Route of Administration, 2020 to 2035
  • Table 9: Global Market Value (USD Billion) Forecast by End-User, 2020 to 2035
  • Table 10: Global Market Volume (Million Units) Forecast by End-User, 2020 to 2035
  • Table 11: Global Market Value (USD Billion) Forecast by Dosage Form, 2020 to 2035
  • Table 12: Global Market Volume (Million Units) Forecast by Dosage Form, 2020 to 2035
  • Table 13: North America Market Value (USD Billion) Forecast by Country, 2020 to 2035
  • Table 14: North America Market Volume (Million Units) Forecast by Country, 2020 to 2035
  • Table 15: North America Market Value (USD Billion) Forecast by Product Type, 2020 to 2035
  • Table 16: North America Market Volume (Million Units) Forecast by Product Type, 2020 to 2035
  • Table 17: North America Market Value (USD Billion) Forecast by Application, 2020 to 2035
  • Table 18: North America Market Volume (Million Units) Forecast by Application, 2020 to 2035
  • Table 19: North America Market Value (USD Billion) Forecast by Route of Administration, 2020 to 2035
  • Table 20: North America Market Volume (Million Units) Forecast by Route of Administration, 2020 to 2035
  • Table 21: North America Market Value (USD Billion) Forecast by End-User, 2020 to 2035
  • Table 22: North America Market Volume (Million Units) Forecast by End-User, 2020 to 2035
  • Table 23: North America Market Value (USD Billion) Forecast by Dosage Form, 2020 to 2035
  • Table 24: North America Market Volume (Million Units) Forecast by Dosage Form, 2020 to 2035
  • Table 25: Latin America Market Value (USD Billion) Forecast by Country, 2020 to 2035
  • Table 26: Latin America Market Volume (Million Units) Forecast by Country, 2020 to 2035
  • Table 27: Latin America Market Value (USD Billion) Forecast by Product Type, 2020 to 2035
  • Table 28: Latin America Market Volume (Million Units) Forecast by Product Type, 2020 to 2035
  • Table 29: Latin America Market Value (USD Billion) Forecast by Application, 2020 to 2035
  • Table 30: Latin America Market Volume (Million Units) Forecast by Application, 2020 to 2035
  • Table 31: Latin America Market Value (USD Billion) Forecast by Route of Administration, 2020 to 2035
  • Table 32: Latin America Market Volume (Million Units) Forecast by Route of Administration, 2020 to 2035
  • Table 33: Latin America Market Value (USD Billion) Forecast by End-User, 2020 to 2035
  • Table 34: Latin America Market Volume (Million Units) Forecast by End-User, 2020 to 2035
  • Table 35: Latin America Market Value (USD Billion) Forecast by Dosage Form, 2020 to 2035
  • Table 36: Latin America Market Volume (Million Units) Forecast by Dosage Form, 2020 to 2035
  • Table 37: Western Europe Market Value (USD Billion) Forecast by Country, 2020 to 2035
  • Table 38: Western Europe Market Volume (Million Units) Forecast by Country, 2020 to 2035
  • Table 39: Western Europe Market Value (USD Billion) Forecast by Product Type, 2020 to 2035
  • Table 40: Western Europe Market Volume (Million Units) Forecast by Product Type, 2020 to 2035
  • Table 41: Western Europe Market Value (USD Billion) Forecast by Application, 2020 to 2035
  • Table 42: Western Europe Market Volume (Million Units) Forecast by Application, 2020 to 2035
  • Table 43: Western Europe Market Value (USD Billion) Forecast by Route of Administration, 2020 to 2035
  • Table 44: Western Europe Market Volume (Million Units) Forecast by Route of Administration, 2020 to 2035
  • Table 45: Western Europe Market Value (USD Billion) Forecast by End-User, 2020 to 2035
  • Table 46: Western Europe Market Volume (Million Units) Forecast by End-User, 2020 to 2035
  • Table 47: Western Europe Market Value (USD Billion) Forecast by Dosage Form, 2020 to 2035
  • Table 48: Western Europe Market Volume (Million Units) Forecast by Dosage Form, 2020 to 2035
  • Table 49: Eastern Europe Market Value (USD Billion) Forecast by Country, 2020 to 2035
  • Table 50: Eastern Europe Market Volume (Million Units) Forecast by Country, 2020 to 2035
  • Table 51: Eastern Europe Market Value (USD Billion) Forecast by Product Type, 2020 to 2035
  • Table 52: Eastern Europe Market Volume (Million Units) Forecast by Product Type, 2020 to 2035
  • Table 53: Eastern Europe Market Value (USD Billion) Forecast by Application, 2020 to 2035
  • Table 54: Eastern Europe Market Volume (Million Units) Forecast by Application, 2020 to 2035
  • Table 55: Eastern Europe Market Value (USD Billion) Forecast by Route of Administration, 2020 to 2035
  • Table 56: Eastern Europe Market Volume (Million Units) Forecast by Route of Administration, 2020 to 2035
  • Table 57: Eastern Europe Market Value (USD Billion) Forecast by End-User, 2020 to 2035
  • Table 58: Eastern Europe Market Volume (Million Units) Forecast by End-User, 2020 to 2035
  • Table 59: Eastern Europe Market Value (USD Billion) Forecast by Dosage Form, 2020 to 2035
  • Table 60: Eastern Europe Market Volume (Million Units) Forecast by Dosage Form, 2020 to 2035
  • Table 61: East Asia Market Value (USD Billion) Forecast by Country, 2020 to 2035
  • Table 62: East Asia Market Volume (Million Units) Forecast by Country, 2020 to 2035
  • Table 63: East Asia Market Value (USD Billion) Forecast by Product Type, 2020 to 2035
  • Table 64: East Asia Market Volume (Million Units) Forecast by Product Type, 2020 to 2035
  • Table 65: East Asia Market Value (USD Billion) Forecast by Application, 2020 to 2035
  • Table 66: East Asia Market Volume (Million Units) Forecast by Application, 2020 to 2035
  • Table 67: East Asia Market Value (USD Billion) Forecast by Route of Administration, 2020 to 2035
  • Table 68: East Asia Market Volume (Million Units) Forecast by Route of Administration, 2020 to 2035
  • Table 69: East Asia Market Value (USD Billion) Forecast by End-User, 2020 to 2035
  • Table 70: East Asia Market Volume (Million Units) Forecast by End-User, 2020 to 2035
  • Table 71: East Asia Market Value (USD Billion) Forecast by Dosage Form, 2020 to 2035
  • Table 72: East Asia Market Volume (Million Units) Forecast by Dosage Form, 2020 to 2035
  • Table 73: South Asia & Pacific Market Value (USD Billion) Forecast by Country, 2020 to 2035
  • Table 74: South Asia & Pacific Market Volume (Million Units) Forecast by Country, 2020 to 2035
  • Table 75: South Asia & Pacific Market Value (USD Billion) Forecast by Product Type, 2020 to 2035
  • Table 76: South Asia & Pacific Market Volume (Million Units) Forecast by Product Type, 2020 to 2035
  • Table 77: South Asia & Pacific Market Value (USD Billion) Forecast by Application, 2020 to 2035
  • Table 78: South Asia & Pacific Market Volume (Million Units) Forecast by Application, 2020 to 2035
  • Table 79: South Asia & Pacific Market Value (USD Billion) Forecast by Route of Administration, 2020 to 2035
  • Table 80: South Asia & Pacific Market Volume (Million Units) Forecast by Route of Administration, 2020 to 2035
  • Table 81: South Asia & Pacific Market Value (USD Billion) Forecast by End-User, 2020 to 2035
  • Table 82: South Asia & Pacific Market Volume (Million Units) Forecast by End-User, 2020 to 2035
  • Table 83: South Asia & Pacific Market Value (USD Billion) Forecast by Dosage Form, 2020 to 2035
  • Table 84: South Asia & Pacific Market Volume (Million Units) Forecast by Dosage Form, 2020 to 2035
  • Table 85: Middle East and Africa Market Value (USD Billion) Forecast by Country, 2020 to 2035
  • Table 86: Middle East and Africa Market Volume (Million Units) Forecast by Country, 2020 to 2035
  • Table 87: Middle East and Africa Market Value (USD Billion) Forecast by Product Type, 2020 to 2035
  • Table 88: Middle East and Africa Market Volume (Million Units) Forecast by Product Type, 2020 to 2035
  • Table 89: Middle East and Africa Market Value (USD Billion) Forecast by Application, 2020 to 2035
  • Table 90: Middle East and Africa Market Volume (Million Units) Forecast by Application, 2020 to 2035
  • Table 91: Middle East and Africa Market Value (USD Billion) Forecast by Route of Administration, 2020 to 2035
  • Table 92: Middle East and Africa Market Volume (Million Units) Forecast by Route of Administration, 2020 to 2035
  • Table 93: Middle East and Africa Market Value (USD Billion) Forecast by End-User, 2020 to 2035
  • Table 94: Middle East and Africa Market Volume (Million Units) Forecast by End-User, 2020 to 2035
  • Table 95: Middle East and Africa Market Value (USD Billion) Forecast by Dosage Form, 2020 to 2035
  • Table 96: Middle East and Africa Market Volume (Million Units) Forecast by Dosage Form, 2020 to 2035

List of Figures

  • Figure 1: Global Market Volume (Million Units) Forecast 2020 to 2035
  • Figure 2: Global Market Pricing Analysis
  • Figure 3: Global Market Value (USD Billion) Forecast 2020 to 2035
  • Figure 4: Global Market Value Share and BPS Analysis by Product Type, 2025 and 2035
  • Figure 5: Global Market Y-o-Y Growth Comparison by Product Type, 2025 to 2035
  • Figure 6: Global Market Attractiveness Analysis by Product Type
  • Figure 7: Global Market Value Share and BPS Analysis by Application, 2025 and 2035
  • Figure 8: Global Market Y-o-Y Growth Comparison by Application, 2025 to 2035
  • Figure 9: Global Market Attractiveness Analysis by Application
  • Figure 10: Global Market Value Share and BPS Analysis by Route of Administration, 2025 and 2035
  • Figure 11: Global Market Y-o-Y Growth Comparison by Route of Administration, 2025 to 2035
  • Figure 12: Global Market Attractiveness Analysis by Route of Administration
  • Figure 13: Global Market Value Share and BPS Analysis by End-User, 2025 and 2035
  • Figure 14: Global Market Y-o-Y Growth Comparison by End-User, 2025 to 2035
  • Figure 15: Global Market Attractiveness Analysis by End-User
  • Figure 16: Global Market Value Share and BPS Analysis by Dosage Form, 2025 and 2035
  • Figure 17: Global Market Y-o-Y Growth Comparison by Dosage Form, 2025 to 2035
  • Figure 18: Global Market Attractiveness Analysis by Dosage Form
  • Figure 19: Global Market Value (USD Billion) Share and BPS Analysis by Region, 2025 and 2035
  • Figure 20: Global Market Y-o-Y Growth Comparison by Region, 2025 to 2035
  • Figure 21: Global Market Attractiveness Analysis by Region
  • Figure 22: North America Market Incremental $ Opportunity, 2025 to 2035
  • Figure 23: Latin America Market Incremental $ Opportunity, 2025 to 2035
  • Figure 24: Western Europe Market Incremental $ Opportunity, 2025 to 2035
  • Figure 25: Eastern Europe Market Incremental $ Opportunity, 2025 to 2035
  • Figure 26: East Asia Market Incremental $ Opportunity, 2025 to 2035
  • Figure 27: South Asia & Pacific Market Incremental $ Opportunity, 2025 to 2035
  • Figure 28: Middle East and Africa Market Incremental $ Opportunity, 2025 to 2035
  • Figure 29: North America Market Value Share and BPS Analysis by Country, 2025 and 2035
  • Figure 30: North America Market Value Share and BPS Analysis by Product Type, 2025 and 2035
  • Figure 31: North America Market Y-o-Y Growth Comparison by Product Type, 2025 to 2035
  • Figure 32: North America Market Attractiveness Analysis by Product Type
  • Figure 33: North America Market Value Share and BPS Analysis by Application, 2025 and 2035
  • Figure 34: North America Market Y-o-Y Growth Comparison by Application, 2025 to 2035
  • Figure 35: North America Market Attractiveness Analysis by Application
  • Figure 36: North America Market Value Share and BPS Analysis by Route of Administration, 2025 and 2035
  • Figure 37: North America Market Y-o-Y Growth Comparison by Route of Administration, 2025 to 2035
  • Figure 38: North America Market Attractiveness Analysis by Route of Administration
  • Figure 39: North America Market Value Share and BPS Analysis by End-User, 2025 and 2035
  • Figure 40: North America Market Y-o-Y Growth Comparison by End-User, 2025 to 2035
  • Figure 41: North America Market Attractiveness Analysis by End-User
  • Figure 42: North America Market Value Share and BPS Analysis by Dosage Form, 2025 and 2035
  • Figure 43: North America Market Y-o-Y Growth Comparison by Dosage Form, 2025 to 2035
  • Figure 44: North America Market Attractiveness Analysis by Dosage Form
  • Figure 45: Latin America Market Value Share and BPS Analysis by Country, 2025 and 2035
  • Figure 46: Latin America Market Value Share and BPS Analysis by Product Type, 2025 and 2035
  • Figure 47: Latin America Market Y-o-Y Growth Comparison by Product Type, 2025 to 2035
  • Figure 48: Latin America Market Attractiveness Analysis by Product Type
  • Figure 49: Latin America Market Value Share and BPS Analysis by Application, 2025 and 2035
  • Figure 50: Latin America Market Y-o-Y Growth Comparison by Application, 2025 to 2035
  • Figure 51: Latin America Market Attractiveness Analysis by Application
  • Figure 52: Latin America Market Value Share and BPS Analysis by Route of Administration, 2025 and 2035
  • Figure 53: Latin America Market Y-o-Y Growth Comparison by Route of Administration, 2025 to 2035
  • Figure 54: Latin America Market Attractiveness Analysis by Route of Administration
  • Figure 55: Latin America Market Value Share and BPS Analysis by End-User, 2025 and 2035
  • Figure 56: Latin America Market Y-o-Y Growth Comparison by End-User, 2025 to 2035
  • Figure 57: Latin America Market Attractiveness Analysis by End-User
  • Figure 58: Latin America Market Value Share and BPS Analysis by Dosage Form, 2025 and 2035
  • Figure 59: Latin America Market Y-o-Y Growth Comparison by Dosage Form, 2025 to 2035
  • Figure 60: Latin America Market Attractiveness Analysis by Dosage Form
  • Figure 61: Western Europe Market Value Share and BPS Analysis by Country, 2025 and 2035
  • Figure 62: Western Europe Market Value Share and BPS Analysis by Product Type, 2025 and 2035
  • Figure 63: Western Europe Market Y-o-Y Growth Comparison by Product Type, 2025 to 2035
  • Figure 64: Western Europe Market Attractiveness Analysis by Product Type
  • Figure 65: Western Europe Market Value Share and BPS Analysis by Application, 2025 and 2035
  • Figure 66: Western Europe Market Y-o-Y Growth Comparison by Application, 2025 to 2035
  • Figure 67: Western Europe Market Attractiveness Analysis by Application
  • Figure 68: Western Europe Market Value Share and BPS Analysis by Route of Administration, 2025 and 2035
  • Figure 69: Western Europe Market Y-o-Y Growth Comparison by Route of Administration, 2025 to 2035
  • Figure 70: Western Europe Market Attractiveness Analysis by Route of Administration
  • Figure 71: Western Europe Market Value Share and BPS Analysis by End-User, 2025 and 2035
  • Figure 72: Western Europe Market Y-o-Y Growth Comparison by End-User, 2025 to 2035
  • Figure 73: Western Europe Market Attractiveness Analysis by End-User
  • Figure 74: Western Europe Market Value Share and BPS Analysis by Dosage Form, 2025 and 2035
  • Figure 75: Western Europe Market Y-o-Y Growth Comparison by Dosage Form, 2025 to 2035
  • Figure 76: Western Europe Market Attractiveness Analysis by Dosage Form
  • Figure 77: Eastern Europe Market Value Share and BPS Analysis by Country, 2025 and 2035
  • Figure 78: Eastern Europe Market Value Share and BPS Analysis by Product Type, 2025 and 2035
  • Figure 79: Eastern Europe Market Y-o-Y Growth Comparison by Product Type, 2025 to 2035
  • Figure 80: Eastern Europe Market Attractiveness Analysis by Product Type
  • Figure 81: Eastern Europe Market Value Share and BPS Analysis by Application, 2025 and 2035
  • Figure 82: Eastern Europe Market Y-o-Y Growth Comparison by Application, 2025 to 2035
  • Figure 83: Eastern Europe Market Attractiveness Analysis by Application
  • Figure 84: Eastern Europe Market Value Share and BPS Analysis by Route of Administration, 2025 and 2035
  • Figure 85: Eastern Europe Market Y-o-Y Growth Comparison by Route of Administration, 2025 to 2035
  • Figure 86: Eastern Europe Market Attractiveness Analysis by Route of Administration
  • Figure 87: Eastern Europe Market Value Share and BPS Analysis by End-User, 2025 and 2035
  • Figure 88: Eastern Europe Market Y-o-Y Growth Comparison by End-User, 2025 to 2035
  • Figure 89: Eastern Europe Market Attractiveness Analysis by End-User
  • Figure 90: Eastern Europe Market Value Share and BPS Analysis by Dosage Form, 2025 and 2035
  • Figure 91: Eastern Europe Market Y-o-Y Growth Comparison by Dosage Form, 2025 to 2035
  • Figure 92: Eastern Europe Market Attractiveness Analysis by Dosage Form
  • Figure 93: East Asia Market Value Share and BPS Analysis by Country, 2025 and 2035
  • Figure 94: East Asia Market Value Share and BPS Analysis by Product Type, 2025 and 2035
  • Figure 95: East Asia Market Y-o-Y Growth Comparison by Product Type, 2025 to 2035
  • Figure 96: East Asia Market Attractiveness Analysis by Product Type
  • Figure 97: East Asia Market Value Share and BPS Analysis by Application, 2025 and 2035
  • Figure 98: East Asia Market Y-o-Y Growth Comparison by Application, 2025 to 2035
  • Figure 99: East Asia Market Attractiveness Analysis by Application
  • Figure 100: East Asia Market Value Share and BPS Analysis by Route of Administration, 2025 and 2035
  • Figure 101: East Asia Market Y-o-Y Growth Comparison by Route of Administration, 2025 to 2035
  • Figure 102: East Asia Market Attractiveness Analysis by Route of Administration
  • Figure 103: East Asia Market Value Share and BPS Analysis by End-User, 2025 and 2035
  • Figure 104: East Asia Market Y-o-Y Growth Comparison by End-User, 2025 to 2035
  • Figure 105: East Asia Market Attractiveness Analysis by End-User
  • Figure 106: East Asia Market Value Share and BPS Analysis by Dosage Form, 2025 and 2035
  • Figure 107: East Asia Market Y-o-Y Growth Comparison by Dosage Form, 2025 to 2035
  • Figure 108: East Asia Market Attractiveness Analysis by Dosage Form
  • Figure 109: South Asia & Pacific Market Value Share and BPS Analysis by Country, 2025 and 2035
  • Figure 110: South Asia & Pacific Market Value Share and BPS Analysis by Product Type, 2025 and 2035
  • Figure 111: South Asia & Pacific Market Y-o-Y Growth Comparison by Product Type, 2025 to 2035
  • Figure 112: South Asia & Pacific Market Attractiveness Analysis by Product Type
  • Figure 113: South Asia & Pacific Market Value Share and BPS Analysis by Application, 2025 and 2035
  • Figure 114: South Asia & Pacific Market Y-o-Y Growth Comparison by Application, 2025 to 2035
  • Figure 115: South Asia & Pacific Market Attractiveness Analysis by Application
  • Figure 116: South Asia & Pacific Market Value Share and BPS Analysis by Route of Administration, 2025 and 2035
  • Figure 117: South Asia & Pacific Market Y-o-Y Growth Comparison by Route of Administration, 2025 to 2035
  • Figure 118: South Asia & Pacific Market Attractiveness Analysis by Route of Administration
  • Figure 119: South Asia & Pacific Market Value Share and BPS Analysis by End-User, 2025 and 2035
  • Figure 120: South Asia & Pacific Market Y-o-Y Growth Comparison by End-User, 2025 to 2035
  • Figure 121: South Asia & Pacific Market Attractiveness Analysis by End-User
  • Figure 122: South Asia & Pacific Market Value Share and BPS Analysis by Dosage Form, 2025 and 2035
  • Figure 123: South Asia & Pacific Market Y-o-Y Growth Comparison by Dosage Form, 2025 to 2035
  • Figure 124: South Asia & Pacific Market Attractiveness Analysis by Dosage Form
  • Figure 125: Middle East and Africa Market Value Share and BPS Analysis by Country, 2025 and 2035
  • Figure 126: Middle East and Africa Market Value Share and BPS Analysis by Product Type, 2025 and 2035
  • Figure 127: Middle East and Africa Market Y-o-Y Growth Comparison by Product Type, 2025 to 2035
  • Figure 128: Middle East and Africa Market Attractiveness Analysis by Product Type
  • Figure 129: Middle East and Africa Market Value Share and BPS Analysis by Application, 2025 and 2035
  • Figure 130: Middle East and Africa Market Y-o-Y Growth Comparison by Application, 2025 to 2035
  • Figure 131: Middle East and Africa Market Attractiveness Analysis by Application
  • Figure 132: Middle East and Africa Market Value Share and BPS Analysis by Route of Administration, 2025 and 2035
  • Figure 133: Middle East and Africa Market Y-o-Y Growth Comparison by Route of Administration, 2025 to 2035
  • Figure 134: Middle East and Africa Market Attractiveness Analysis by Route of Administration
  • Figure 135: Middle East and Africa Market Value Share and BPS Analysis by End-User, 2025 and 2035
  • Figure 136: Middle East and Africa Market Y-o-Y Growth Comparison by End-User, 2025 to 2035
  • Figure 137: Middle East and Africa Market Attractiveness Analysis by End-User
  • Figure 138: Middle East and Africa Market Value Share and BPS Analysis by Dosage Form, 2025 and 2035
  • Figure 139: Middle East and Africa Market Y-o-Y Growth Comparison by Dosage Form, 2025 to 2035
  • Figure 140: Middle East and Africa Market Attractiveness Analysis by Dosage Form
  • Figure 141: Global Market - Tier Structure Analysis
  • Figure 142: Global Market - Company Share Analysis

Frequently Asked Questions

What is the projected size of the anti-D immunoglobulin market by 2035?

The industry is projected to grow from USD 3.42 billion in 2025 to USD 5.85 billion by 2035, at a CAGR of 5.53% through 2035.

Which application leads the anti-D immunoglobulin market in 2025?

Rh immunoprophylaxis during pregnancy leads the industry with a 55% share in 2025.

Which end-user segment dominates the anti-D immunoglobulin market in 2025?

Hospitals dominate the end-user segment with a 75% industry share in 2025.

Which is the Fastest-growing anti-D immunoglobulin market globally?

China and India are the fastest-growing industries with a 6.8% CAGR.

Who leads the global anti-D immunoglobulin market?

CSL Behring is a leading player with 35% industry share in 2025.

Explore Similar Insights

Future Market Insights

Anti-D Immunoglobulin Market