Methodology

Anti-money Laundering Market Size and Share Forecast Outlook 2025 to 2035

The anti-money laundering market is estimated to be valued at USD 4.4 billion in 2025 and is projected to reach USD 22.7 billion by 2035, registering a compound annual growth rate (CAGR) of 17.8% over the forecast period.

The market represents a critical segment within the global financial technology and compliance industry, characterized by exceptional growth potential driven by increasingly stringent regulatory requirements, expanding digital financial services, and evolving financial crime sophistication worldwide. Unlike discretionary technology investments that organizations may defer during economic uncertainty, AML compliance represents mandatory regulatory expenditure that financial institutions, fintech companies, and other regulated entities must maintain to operate legally in any jurisdiction.

Market dynamics in this sector reveal unique operational characteristics where demand is primarily driven by regulatory mandate rather than competitive advantage, creating consistent growth patterns that are largely insulated from economic cycles and business discretionary spending decisions. Regulatory bodies including FATF, FinCEN, EU financial authorities, and national banking supervisors continuously expand AML requirements to address emerging threats including cryptocurrency transactions, cross-border payments, digital assets, and sophisticated layering techniques employed by criminal organizations. Technical requirements encompass real-time transaction monitoring, beneficial ownership verification, sanctions screening, politically exposed person identification, and suspicious activity reporting that must process millions of transactions daily while maintaining acceptable false positive rates.

The technological landscape encompasses diverse solution categories including transaction monitoring systems, customer due diligence platforms, sanctions screening tools, case management software, regulatory reporting systems, and artificial intelligence-powered analytics that can identify previously undetected money laundering patterns. Platform providers must integrate with existing core banking systems, payment processors, and regulatory reporting infrastructure while maintaining data security standards and audit trail capabilities required for regulatory examinations. These technical integration requirements create operational complexity where AML systems must accommodate diverse data formats, processing speeds, and regulatory reporting standards across different jurisdictions and financial service types.

The competitive landscape operates under different parameters compared to traditional technology markets due to the regulatory validation requirements, audit trail documentation, and proven effectiveness standards that AML solutions must demonstrate to gain acceptance among regulated financial institutions. Success depends not only on technical capabilities and cost competitiveness but also on regulatory expertise, implementation track records, and the ability to demonstrate measurable improvements in money laundering detection while reducing operational burden. Market differentiation requires sophisticated understanding of evolving money laundering techniques, regulatory interpretation guidance, and financial crime investigation methodologies that extend beyond conventional software development capabilities.
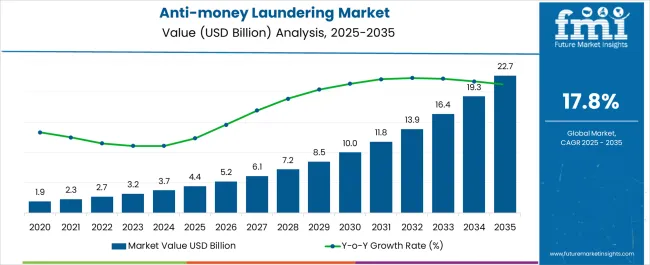
Quick Stats for Anti-money Laundering Market

  • Anti-money Laundering Market Industry Value (2025): USD 4.4 billion
  • Anti-money Laundering Market Forecast Value (2035): USD 22.7 billion
  • Anti-money Laundering Market Forecast CAGR: 17.8%
  • Leading Segment in Anti-money Laundering Market in 2025: Customer Identity Management (38.6%)
  • Key Growth Region in Anti-money Laundering Market: North America, Asia-Pacific, Europe
  • Top Players in Anti-money Laundering Market: ACI Worldwide Inc., BAE Systems plc, Nice Systems Ltd., FICO (Fair Isaac Corporation), SAS Institute Inc., Fiserv Inc., Dixtior, LexisNexis Risk Solutions, TransUnion LLC, Wolters Kluwer N.V., Temenos AG, Nelito Systems Pvt. Ltd., Tata Consultancy Services Ltd., Featurespace Ltd., Feedzai Inc., Finacus Solutions Pvt. Ltd., CaseWare RCM Inc., Comarch SA

Anti Money Laundering Market Market Value Analysis

Metric Value
Anti-money Laundering Market Estimated Value in (2025 E) USD 4.4 billion
Anti-money Laundering Market Forecast Value in (2035 F) USD 22.7 billion
Forecast CAGR (2025 to 2035) 17.8%

Rationale for Segmental Growth in the Anti Money Laundering Market

The anti money laundering market is expanding due to stricter regulatory frameworks, heightened financial crime risks, and the growing need for secure digital transaction monitoring. Financial institutions and enterprises are increasingly investing in advanced compliance solutions to prevent fraudulent activities and meet global regulatory standards.

The rise of digital banking, cross border payments, and online transactions has intensified the demand for robust systems that can identify suspicious behavior and mitigate risks in real time. Integration of artificial intelligence, machine learning, and big data analytics is enhancing detection accuracy and reducing false positives, strengthening trust in AML frameworks.

The outlook for the market remains positive as regulatory pressure, reputational risk management, and technological adoption continue to drive the transition toward more sophisticated compliance infrastructure.

Segmental Analysis

Insights into the Customer Identity Management Solution Segment

The customer identity management solution segment is projected to hold 38.60% of market revenue by 2025, making it the leading solution category. Its dominance is attributed to the growing necessity for accurate identity verification, customer due diligence, and real time onboarding processes in financial institutions.

Increasing digital transactions and the prevalence of remote banking have amplified the need for advanced identity management tools that ensure compliance and safeguard against fraudulent accounts. Furthermore, global regulatory frameworks emphasizing know your customer protocols have reinforced adoption.

The ability to integrate biometric authentication, risk scoring, and continuous monitoring has strengthened the role of this segment as a critical component in AML strategies.

Insights into the Professional Service Segment

The professional service segment is expected to account for 57.20% of total revenue within the service category by 2025, establishing itself as the dominant area. This leadership is driven by the reliance of enterprises on expert consultancy, system integration, and regulatory advisory services to effectively deploy AML frameworks.

Continuous regulatory updates and the complexity of compliance across jurisdictions have created a strong demand for specialized professional services. Additionally, organizations are leveraging external expertise to customize AML systems, optimize workflows, and train staff for efficient use.

This segment’s growth is further reinforced by its ability to reduce implementation risks and ensure alignment with international compliance standards.

Insights into the On Premise Deployment Model Segment

The on premise deployment model is projected to represent 46.30% of market revenue by 2025, making it the most significant deployment preference. Its prominence stems from the need for greater data security, control, and customization capabilities among large financial institutions.

Sensitive nature of customer data and regulatory requirements in highly regulated markets have reinforced the preference for on premise solutions. Enterprises with established IT infrastructure find this model advantageous for integration with legacy systems and tailoring to specific compliance needs.

Although cloud adoption is increasing, concerns around data privacy and control ensure that on premise deployment continues to dominate in critical financial environments.

Comparative Analysis of Historical 2020-2025 and Forecasted 2025-2035 AML Market Trends

The growing use of big data analytics by businesses enables them to conduct analyses that can identify trends and draw important conclusions from big data sets. It is predicted that using big data analytics may increase demand for anti-money laundering software.

For instance, Coinfirm and Sanction Scanner collaborated in November 2025 to offer compliance expertise and benefits in the blockchain with traditional finance ecosystems. Through this agreement, clients are likely to be able to track and inspect transactions handled by their businesses for both fiat currency and cryptocurrency.

Big Data analytics is the best tool for AML compliance because it can be tailored to enhance and automate numerous AML compliance processes. Big Data analytics also aids in risk reduction, fraud pattern detection, and the detection of data quality concerns that result in false positives.

Financial organizations can study the details of existing regulatory laws with the help of big data analytics tools. It aids in the analysis of client onboarding, transactional data, and the completion of regulatory authority obligations. Real-time risk or problem detection also aids in avoiding potential rule violations in front of supervisory authorities.

Demand for anti-money laundering (AML) is anticipated to rise at a phenomenal CAGR of 17.8% from 2025 to 2035.

Key Growth Opportunities for Anti-money Laundering (AML) Market Stakeholders

Growing Emphasis on Real-time Monitoring and Regulatory Technology is Providing the Market with Lucrative Prospects

To obtain a comprehensive overview of a customer's activities in real-time, real-time transaction monitoring examines client transactions and behavior by looking at both past and present customer data and interactions. Organizations can identify financial crimes early on or before they happen, thanks to the transaction monitoring feature of anti-money laundering software.

Financial institutions can identify possible instances of financial crime and take action to intervene and stop it from happening at that same moment by implementing real-time transaction monitoring in anti-money laundering.

RegTech (Regulatory Technology) provides banks and other financial institutions with access to sophisticated tools and procedures that automate data gathering, processing, and visualization. RegTech helps banks onboard consumers quickly, efficiently, and with less engagement from the customer.

In the upcoming years, there is likely to be a boom in demand for anti-money laundering software due to the advent of AI RegTech solutions in the financial sector.

Anti-money Laundering (AML) Industry Analysis by Category and Application Scope

Solutions are Anticipated to Expand Significantly at a CAGR of 17.5% through 2035

Several financial institutions frequently utilize AML solutions. There are a few external forces that have an impact on financial services. In order to identify the most significant issues relating to client identity or transactions, the solutions mix AI, machine learning, and big data.

This enables authorities to take the necessary action. Several sizable corporations provide banking institutions with AML solutions. Through the analysis of process modifications and the identification of any enhancements that may be required, these solutions are made to solve transaction monitoring, compliance management, and other issues to maintain smooth financial operations.

During the forecast period, these variables are expected to assist the segment's revenue growth.

By 2025, the BFSI Segment Generated USD 1 billion in Revenue

BFSI companies are among the most frequent users of AML solutions, which use affordable ML and AI methods to combat illegal activity. The risk of fraudulent financial operations has increased as a result of digitalization, automation, and online transactions. In 2024, there were 1.9 billion users of internet banking services globally.

Additionally, it is anticipated that during the projection period, demand for AML solutions and services is estimated to increase due to the growing requirement to detect and prevent illegal activities. Additionally, throughout the forecast period, revenue growth in the market is anticipated to be fueled by increased governance and internal control to comply with domestic and international statutory AML rules.
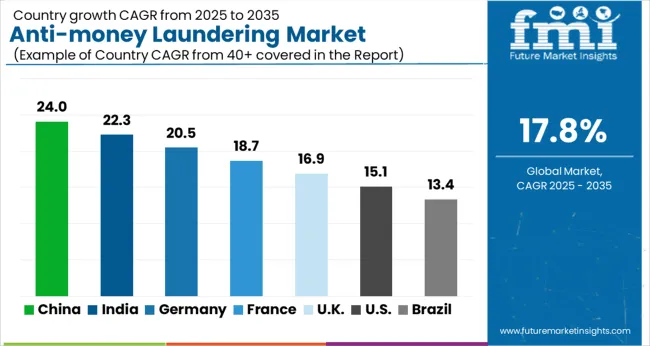
Regional Outlook and Growth Patterns in the Anti-money Laundering (AML) Market

Anti Money Laundering Market Cagr Analysis By Country

Geographically, North America had a Large Revenue Share in 2024 due to the Presence of Significant Players in the Region

As a result of numerous institutions in the region, anti-money laundering solutions are also anticipated to see considerable adoption in the future years. Additionally, it is projected that inorganic tactics to incorporate artificial intelligence among anti-money laundering providers may evolve, which is likely to accelerate the growth of the anti-money laundering sector in the area.

Specific anti-money laundering regulations set by the United States Congress under the Anti-Money Laundering Act of 2024 stimulate national preference for anti-money laundering, which is anticipated to boost regional market growth.
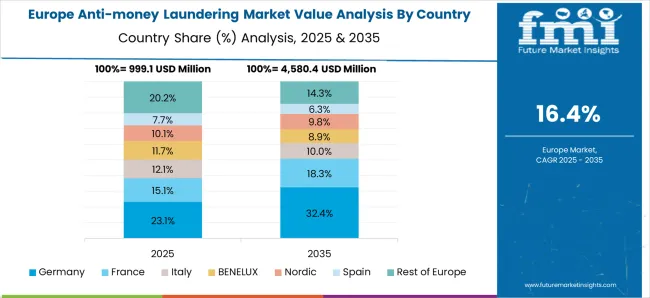
Europe is anticipated to be the Market with the Highest Potential

Anti Money Laundering Market Europe Country Market Share Analysis, 2025 & 2035

As a result of numerous institutions in the region, anti-money laundering solutions are also anticipated to see considerable adoption in the future years. Additionally, it is projected that inorganic tactics to incorporate artificial intelligence among anti-money laundering providers may evolve, which is likely to accelerate the growth of the anti-money laundering sector in the area.

Specific anti-money laundering regulations set by the United States Congress under the Anti-money Laundering Act of 2024 stimulate national preference for anti-money laundering, which is anticipated to boost the regional market growth.

Asia Pacific is anticipated to exhibit a Strong Revenue CAGR

Asia Pacific market's prominent revenue growth rate is linked to the region's expanding adoption of digital payment platforms in nations like China and India. The industry is anticipated to grow in revenue as a result of increased government support and regulations, such as those set forth by the intergovernmental Financial Action Task Force (FATF) to tighten anti-money laundering procedures.

For instance, the Prevention of Money Laundering Act, 2002 (PMLA) in India forbids money laundering and is anticipated to spur development in market income in the near future.

To accelerate market growth, businesses in the region are significantly incorporating technologies like AI, ML, and automation in their AML solutions. For instance, in March 2024, 3i Infotech Limited unveiled AMLOCK Analytics, a cutting-edge AML system outfitted with machine language and artificial intelligence (AI) (ML).

AMLOCK Analytics creates analyses and forecasts based on institution-specific historical data using a variety of statistical techniques and machine learning algorithms.

Strategic Alliances and M&A Activities in the Anti-money Laundering (AML) Industry

Due to the presence of numerous solution providers worldwide, including SAS Institute, NICE Ltd., Experian, BAE Systems, FICO, Refinitiv, and many others, the anti-money laundering (AML) market's competitive environment is moderately fragmented.

Additionally, several small and medium-sized businesses are entering the market and generating money, which is anticipated to support them in developing novel solutions. To increase their market position, the current market participants are also developing strategic alliances and collaborations.

  • In September 2024, FICO joined forces with the global consulting and IT firm MSG group. Through this cooperation, FICO's financial crime compliance and fraud products are supported and distributed throughout Europe, the Middle East, and Africa. Businesses utilizing FICO Siron Anti-Financial Crime Solutions aim to get financial crime compliance consulting services from MSG.
  • Experian released a new version of its fraud prevention technology in February 2024, aimed at companies that were struggling with a spike in several online accounts or strong demand for digital services.

Competitive Landscape of the Anti-money Laundering Market

The Anti-Money Laundering (AML) Market is expanding rapidly as financial institutions, fintech companies, and regulatory bodies strengthen compliance frameworks to combat illicit financial activities. Rising incidences of online fraud, cross-border money laundering, and digital payment risks are driving the need for advanced AML software integrated with AI, machine learning, and big data analytics. Leading solution providers such as ACI Worldwide Inc., FICO (Fair Isaac Corporation), and SAS Institute Inc. are at the forefront of this transformation, offering end-to-end AML suites that include transaction monitoring, sanctions screening, and real-time risk scoring.

BAE Systems plc, Nice Systems Ltd., and Featurespace Ltd. specialize in behavioral analytics and adaptive machine learning to detect complex fraud patterns across payment ecosystems. Fiserv Inc., Temenos AG, and Wolters Kluwer N.V. are embedding AML functionalities within core banking and risk management platforms, enhancing compliance efficiency for financial institutions of all sizes.

LexisNexis Risk Solutions, TransUnion LLC, and CaseWare RCM Inc. are advancing global data intelligence solutions, leveraging extensive identity verification networks and public records to improve customer due diligence (CDD) and Know Your Customer (KYC) processes. Emerging players such as Feedzai Inc., Dixtior, and Finacus Solutions Pvt. Ltd. are introducing cloud-native and AI-driven AML systems tailored for digital banks, neobanks, and payment service providers. Nelito Systems Pvt. Ltd. and Comarch SA contribute by developing modular AML compliance software for regional banks and cooperative financial institutions, emphasizing automation and cost efficiency.

Leading Players in the Anti-money Laundering (AML) Market – Overview and Positioning

  • ACI Worldwide Inc.
  • BAE Systems plc
  • Nice Systems Ltd.
  • FICO (Fair Isaac Corporation)
  • SAS Institute Inc.
  • Fiserv Inc.
  • Dixtior
  • LexisNexis Risk Solutions
  • TransUnion LLC
  • Wolters Kluwer N.V.
  • Temenos AG
  • Nelito Systems Pvt. Ltd.
  • Tata Consultancy Services Ltd. (TCS)
  • Featurespace Ltd.
  • Feedzai Inc.
  • Finacus Solutions Pvt. Ltd.
  • CaseWare RCM Inc.
  • Comarch SA

Scope and Coverage of the Anti-money Laundering (AML) Market Report

Attribute Details
Growth Rate CAGR of 17.8% from 2025 to 2035
Base Year of Estimation 2025
Historical Data 2020 to 2025
Forecast Period 2025 to 2035
Quantitative Units Revenue in USD billion and Volume in Units and F-CAGR from 2025 to 2035
Report Coverage Revenue Forecast, Volume Forecast, Company Ranking, Competitive Landscape, growth factors, Trends, and Pricing Analysis
Key Segments Covered Component, Deployment Model, Organization Size, Application, Region
Regions Covered North America; Latin America; Europe; East Asia; South Asia; The Middle East & Africa; Oceania
Key Countries Profiled Unite States, Canada, Brazil, Mexico, Germany, Italy, France, United Kingdom, Spain, Russia, China, Japan, India, GCC Countries, Australia
Key Companies Profiled ACI Worldwide Inc., BAE Systems plc, Nice Systems Ltd., FICO (Fair Isaac Corporation), SAS Institute Inc., Fiserv Inc., Dixtior, LexisNexis Risk Solutions, TransUnion LLC, Wolters Kluwer N.V., Temenos AG, Nelito Systems Pvt. Ltd., Tata Consultancy Services Ltd., Featurespace Ltd., Feedzai Inc., Finacus Solutions Pvt. Ltd., CaseWare RCM Inc., Comarch SA
Customization & Pricing Available upon Request

Key Segments Covered in the Anti-money Laundering (AML) Market Analysis

By Solution:

  • Customer Identity Management
  • Compliance Management
  • Currency Transaction Reporting
  • Transaction Monitoring

By Service:

  • Professional Service
  • Managed Service

By Deployment Model:

  • On-premise
  • Cloud

By Organization Size:

  • Large Enterprises
  • SMEs

By Application:

  • BFSI
  • IT & Telecom
  • Government & Public Sector
  • Healthcare
  • Retail
  • Transportation & Logistics

By Region:

  • North America
  • Latin America
  • Western Europe
  • Eastern Europe
  • Asia Pacific excluding Japan (APEJ)
  • Japan
  • The Middle East & Africa (MEA)

Frequently Asked Questions

How big is the anti-money laundering market in 2025?

The global anti-money laundering market is estimated to be valued at USD 4.4 billion in 2025.

What will be the size of anti-money laundering market in 2035?

The market size for the anti-money laundering market is projected to reach USD 22.7 billion by 2035.

How much will be the anti-money laundering market growth between 2025 and 2035?

The anti-money laundering market is expected to grow at a 17.8% CAGR between 2025 and 2035.

What are the key product types in the anti-money laundering market?

The key product types in anti-money laundering market are customer identity management, compliance management, currency transaction reporting and transaction monitoring.

Which service segment to contribute significant share in the anti-money laundering market in 2025?

In terms of service, professional service segment to command 57.2% share in the anti-money laundering market in 2025.

Table of Content

  1. Executive Summary
    • Global Market Outlook
    • Demand-side Trends
    • Supply-side Trends
    • Technology Roadmap Analysis
    • Analysis and Recommendations
  2. Market Overview
    • Market Coverage / Taxonomy
    • Market Definition / Scope / Limitations
  3. Market Background
    • Market Dynamics
      • Drivers
      • Restraints
      • Opportunity
      • Trends
    • Scenario Forecast
      • Demand in Optimistic Scenario
      • Demand in Likely Scenario
      • Demand in Conservative Scenario
    • Opportunity Map Analysis
    • Product Life Cycle Analysis
    • Supply Chain Analysis
    • Investment Feasibility Matrix
    • Value Chain Analysis
    • PESTLE and Porter’s Analysis
    • Regulatory Landscape
    • Regional Parent Market Outlook
    • Production and Consumption Statistics
    • Import and Export Statistics
  4. Global Market Analysis 2020 to 2024 and Forecast, 2025 to 2035
    • Historical Market Size Value (USD Million) Analysis, 2020 to 2024
    • Current and Future Market Size Value (USD Million) Projections, 2025 to 2035
      • Y-o-Y Growth Trend Analysis
      • Absolute $ Opportunity Analysis
  5. Global Market Pricing Analysis 2020 to 2024 and Forecast 2025 to 2035
  6. Global Market Analysis 2020 to 2024 and Forecast 2025 to 2035, By Solution
    • Introduction / Key Findings
    • Historical Market Size Value (USD Million) Analysis By Solution , 2020 to 2024
    • Current and Future Market Size Value (USD Million) Analysis and Forecast By Solution , 2025 to 2035
      • Customer Identity Management
      • Compliance Management
      • Currency Transaction Reporting
      • Transaction Monitoring
    • Y-o-Y Growth Trend Analysis By Solution , 2020 to 2024
    • Absolute $ Opportunity Analysis By Solution , 2025 to 2035
  7. Global Market Analysis 2020 to 2024 and Forecast 2025 to 2035, By Service
    • Introduction / Key Findings
    • Historical Market Size Value (USD Million) Analysis By Service, 2020 to 2024
    • Current and Future Market Size Value (USD Million) Analysis and Forecast By Service, 2025 to 2035
      • Professional Service
      • Managed Service
    • Y-o-Y Growth Trend Analysis By Service, 2020 to 2024
    • Absolute $ Opportunity Analysis By Service, 2025 to 2035
  8. Global Market Analysis 2020 to 2024 and Forecast 2025 to 2035, By Deployment Model
    • Introduction / Key Findings
    • Historical Market Size Value (USD Million) Analysis By Deployment Model, 2020 to 2024
    • Current and Future Market Size Value (USD Million) Analysis and Forecast By Deployment Model, 2025 to 2035
      • On-premise
      • Cloud
    • Y-o-Y Growth Trend Analysis By Deployment Model, 2020 to 2024
    • Absolute $ Opportunity Analysis By Deployment Model, 2025 to 2035
  9. Global Market Analysis 2020 to 2024 and Forecast 2025 to 2035, By Organization Size
    • Introduction / Key Findings
    • Historical Market Size Value (USD Million) Analysis By Organization Size, 2020 to 2024
    • Current and Future Market Size Value (USD Million) Analysis and Forecast By Organization Size, 2025 to 2035
      • Large Enterprises
      • SMEs
    • Y-o-Y Growth Trend Analysis By Organization Size, 2020 to 2024
    • Absolute $ Opportunity Analysis By Organization Size, 2025 to 2035
  10. Global Market Analysis 2020 to 2024 and Forecast 2025 to 2035, By Application
    • Introduction / Key Findings
    • Historical Market Size Value (USD Million) Analysis By Application, 2020 to 2024
    • Current and Future Market Size Value (USD Million) Analysis and Forecast By Application, 2025 to 2035
      • BFSI
      • IT & Telecom
      • Government & Public Sector
      • Healthcare
      • Retail
      • Transportation & Logistics
    • Y-o-Y Growth Trend Analysis By Application, 2020 to 2024
    • Absolute $ Opportunity Analysis By Application, 2025 to 2035
  11. Global Market Analysis 2020 to 2024 and Forecast 2025 to 2035, By Region
    • Introduction
    • Historical Market Size Value (USD Million) Analysis By Region, 2020 to 2024
    • Current Market Size Value (USD Million) Analysis and Forecast By Region, 2025 to 2035
      • North America
      • Latin America
      • Western Europe
      • Eastern Europe
      • East Asia
      • South Asia and Pacific
      • Middle East & Africa
    • Market Attractiveness Analysis By Region
  12. North America Market Analysis 2020 to 2024 and Forecast 2025 to 2035, By Country
    • Historical Market Size Value (USD Million) Trend Analysis By Market Taxonomy, 2020 to 2024
    • Market Size Value (USD Million) Forecast By Market Taxonomy, 2025 to 2035
      • By Country
        • USA
        • Canada
        • Mexico
      • By Solution
      • By Service
      • By Deployment Model
      • By Organization Size
      • By Application
    • Market Attractiveness Analysis
      • By Country
      • By Solution
      • By Service
      • By Deployment Model
      • By Organization Size
      • By Application
    • Key Takeaways
  13. Latin America Market Analysis 2020 to 2024 and Forecast 2025 to 2035, By Country
    • Historical Market Size Value (USD Million) Trend Analysis By Market Taxonomy, 2020 to 2024
    • Market Size Value (USD Million) Forecast By Market Taxonomy, 2025 to 2035
      • By Country
        • Brazil
        • Chile
        • Rest of Latin America
      • By Solution
      • By Service
      • By Deployment Model
      • By Organization Size
      • By Application
    • Market Attractiveness Analysis
      • By Country
      • By Solution
      • By Service
      • By Deployment Model
      • By Organization Size
      • By Application
    • Key Takeaways
  14. Western Europe Market Analysis 2020 to 2024 and Forecast 2025 to 2035, By Country
    • Historical Market Size Value (USD Million) Trend Analysis By Market Taxonomy, 2020 to 2024
    • Market Size Value (USD Million) Forecast By Market Taxonomy, 2025 to 2035
      • By Country
        • Germany
        • UK
        • Italy
        • Spain
        • France
        • Nordic
        • BENELUX
        • Rest of Western Europe
      • By Solution
      • By Service
      • By Deployment Model
      • By Organization Size
      • By Application
    • Market Attractiveness Analysis
      • By Country
      • By Solution
      • By Service
      • By Deployment Model
      • By Organization Size
      • By Application
    • Key Takeaways
  15. Eastern Europe Market Analysis 2020 to 2024 and Forecast 2025 to 2035, By Country
    • Historical Market Size Value (USD Million) Trend Analysis By Market Taxonomy, 2020 to 2024
    • Market Size Value (USD Million) Forecast By Market Taxonomy, 2025 to 2035
      • By Country
        • Russia
        • Poland
        • Hungary
        • Balkan & Baltic
        • Rest of Eastern Europe
      • By Solution
      • By Service
      • By Deployment Model
      • By Organization Size
      • By Application
    • Market Attractiveness Analysis
      • By Country
      • By Solution
      • By Service
      • By Deployment Model
      • By Organization Size
      • By Application
    • Key Takeaways
  16. East Asia Market Analysis 2020 to 2024 and Forecast 2025 to 2035, By Country
    • Historical Market Size Value (USD Million) Trend Analysis By Market Taxonomy, 2020 to 2024
    • Market Size Value (USD Million) Forecast By Market Taxonomy, 2025 to 2035
      • By Country
        • China
        • Japan
        • South Korea
      • By Solution
      • By Service
      • By Deployment Model
      • By Organization Size
      • By Application
    • Market Attractiveness Analysis
      • By Country
      • By Solution
      • By Service
      • By Deployment Model
      • By Organization Size
      • By Application
    • Key Takeaways
  17. South Asia and Pacific Market Analysis 2020 to 2024 and Forecast 2025 to 2035, By Country
    • Historical Market Size Value (USD Million) Trend Analysis By Market Taxonomy, 2020 to 2024
    • Market Size Value (USD Million) Forecast By Market Taxonomy, 2025 to 2035
      • By Country
        • India
        • ASEAN
        • Australia & New Zealand
        • Rest of South Asia and Pacific
      • By Solution
      • By Service
      • By Deployment Model
      • By Organization Size
      • By Application
    • Market Attractiveness Analysis
      • By Country
      • By Solution
      • By Service
      • By Deployment Model
      • By Organization Size
      • By Application
    • Key Takeaways
  18. Middle East & Africa Market Analysis 2020 to 2024 and Forecast 2025 to 2035, By Country
    • Historical Market Size Value (USD Million) Trend Analysis By Market Taxonomy, 2020 to 2024
    • Market Size Value (USD Million) Forecast By Market Taxonomy, 2025 to 2035
      • By Country
        • Kingdom of Saudi Arabia
        • Other GCC Countries
        • Turkiye
        • South Africa
        • Other African Union
        • Rest of Middle East & Africa
      • By Solution
      • By Service
      • By Deployment Model
      • By Organization Size
      • By Application
    • Market Attractiveness Analysis
      • By Country
      • By Solution
      • By Service
      • By Deployment Model
      • By Organization Size
      • By Application
    • Key Takeaways
  19. Key Countries Market Analysis
    • USA
      • Pricing Analysis
      • Market Share Analysis, 2024
        • By Solution
        • By Service
        • By Deployment Model
        • By Organization Size
        • By Application
    • Canada
      • Pricing Analysis
      • Market Share Analysis, 2024
        • By Solution
        • By Service
        • By Deployment Model
        • By Organization Size
        • By Application
    • Mexico
      • Pricing Analysis
      • Market Share Analysis, 2024
        • By Solution
        • By Service
        • By Deployment Model
        • By Organization Size
        • By Application
    • Brazil
      • Pricing Analysis
      • Market Share Analysis, 2024
        • By Solution
        • By Service
        • By Deployment Model
        • By Organization Size
        • By Application
    • Chile
      • Pricing Analysis
      • Market Share Analysis, 2024
        • By Solution
        • By Service
        • By Deployment Model
        • By Organization Size
        • By Application
    • Germany
      • Pricing Analysis
      • Market Share Analysis, 2024
        • By Solution
        • By Service
        • By Deployment Model
        • By Organization Size
        • By Application
    • UK
      • Pricing Analysis
      • Market Share Analysis, 2024
        • By Solution
        • By Service
        • By Deployment Model
        • By Organization Size
        • By Application
    • Italy
      • Pricing Analysis
      • Market Share Analysis, 2024
        • By Solution
        • By Service
        • By Deployment Model
        • By Organization Size
        • By Application
    • Spain
      • Pricing Analysis
      • Market Share Analysis, 2024
        • By Solution
        • By Service
        • By Deployment Model
        • By Organization Size
        • By Application
    • France
      • Pricing Analysis
      • Market Share Analysis, 2024
        • By Solution
        • By Service
        • By Deployment Model
        • By Organization Size
        • By Application
    • India
      • Pricing Analysis
      • Market Share Analysis, 2024
        • By Solution
        • By Service
        • By Deployment Model
        • By Organization Size
        • By Application
    • ASEAN
      • Pricing Analysis
      • Market Share Analysis, 2024
        • By Solution
        • By Service
        • By Deployment Model
        • By Organization Size
        • By Application
    • Australia & New Zealand
      • Pricing Analysis
      • Market Share Analysis, 2024
        • By Solution
        • By Service
        • By Deployment Model
        • By Organization Size
        • By Application
    • China
      • Pricing Analysis
      • Market Share Analysis, 2024
        • By Solution
        • By Service
        • By Deployment Model
        • By Organization Size
        • By Application
    • Japan
      • Pricing Analysis
      • Market Share Analysis, 2024
        • By Solution
        • By Service
        • By Deployment Model
        • By Organization Size
        • By Application
    • South Korea
      • Pricing Analysis
      • Market Share Analysis, 2024
        • By Solution
        • By Service
        • By Deployment Model
        • By Organization Size
        • By Application
    • Russia
      • Pricing Analysis
      • Market Share Analysis, 2024
        • By Solution
        • By Service
        • By Deployment Model
        • By Organization Size
        • By Application
    • Poland
      • Pricing Analysis
      • Market Share Analysis, 2024
        • By Solution
        • By Service
        • By Deployment Model
        • By Organization Size
        • By Application
    • Hungary
      • Pricing Analysis
      • Market Share Analysis, 2024
        • By Solution
        • By Service
        • By Deployment Model
        • By Organization Size
        • By Application
    • Kingdom of Saudi Arabia
      • Pricing Analysis
      • Market Share Analysis, 2024
        • By Solution
        • By Service
        • By Deployment Model
        • By Organization Size
        • By Application
    • Turkiye
      • Pricing Analysis
      • Market Share Analysis, 2024
        • By Solution
        • By Service
        • By Deployment Model
        • By Organization Size
        • By Application
    • South Africa
      • Pricing Analysis
      • Market Share Analysis, 2024
        • By Solution
        • By Service
        • By Deployment Model
        • By Organization Size
        • By Application
  20. Market Structure Analysis
    • Competition Dashboard
    • Competition Benchmarking
    • Market Share Analysis of Top Players
      • By Regional
      • By Solution
      • By Service
      • By Deployment Model
      • By Organization Size
      • By Application
  21. Competition Analysis
    • Competition Deep Dive
      • ACI Worldwide Inc.
        • Overview
        • Product Portfolio
        • Profitability by Market Segments (Product/Age /Sales Channel/Region)
        • Sales Footprint
        • Strategy Overview
          • Marketing Strategy
          • Product Strategy
          • Channel Strategy
      • BAE Systems plc
      • Nice Systems Ltd.
      • Fair Isaac Corporation (FICO)
      • SAS Institute Inc.
      • Fiserv Inc.
      • Dixtior
      • LexisNexis Risk Solutions
      • TransUnion LLC
      • Wolter’s Kluwer Limited
      • Temenos AG
      • Nelito Systems Ltd.
      • Tata Consultancy Services Ltd.
      • Featurespace Limited
      • Feedzai Inc.
      • Finacus Solutions Private Limited
      • CaseWare RCM
      • Comarch SA
  22. Assumptions & Acronyms Used
  23. Research Methodology

List of Tables

  • Table 1: Global Market Value (USD Million) Forecast by Region, 2020-2035
  • Table 2: Global Market Value (USD Million) Forecast by Solution , 2020-2035
  • Table 3: Global Market Value (USD Million) Forecast by Service, 2020-2035
  • Table 4: Global Market Value (USD Million) Forecast by Deployment Model, 2020-2035
  • Table 5: Global Market Value (USD Million) Forecast by Organization Size, 2020-2035
  • Table 6: Global Market Value (USD Million) Forecast by Application, 2020-2035
  • Table 7: North America Market Value (USD Million) Forecast by Country, 2020-2035
  • Table 8: North America Market Value (USD Million) Forecast by Solution , 2020-2035
  • Table 9: North America Market Value (USD Million) Forecast by Service, 2020-2035
  • Table 10: North America Market Value (USD Million) Forecast by Deployment Model, 2020-2035
  • Table 11: North America Market Value (USD Million) Forecast by Organization Size, 2020-2035
  • Table 12: North America Market Value (USD Million) Forecast by Application, 2020-2035
  • Table 13: Latin America Market Value (USD Million) Forecast by Country, 2020-2035
  • Table 14: Latin America Market Value (USD Million) Forecast by Solution , 2020-2035
  • Table 15: Latin America Market Value (USD Million) Forecast by Service, 2020-2035
  • Table 16: Latin America Market Value (USD Million) Forecast by Deployment Model, 2020-2035
  • Table 17: Latin America Market Value (USD Million) Forecast by Organization Size, 2020-2035
  • Table 18: Latin America Market Value (USD Million) Forecast by Application, 2020-2035
  • Table 19: Western Europe Market Value (USD Million) Forecast by Country, 2020-2035
  • Table 20: Western Europe Market Value (USD Million) Forecast by Solution , 2020-2035
  • Table 21: Western Europe Market Value (USD Million) Forecast by Service, 2020-2035
  • Table 22: Western Europe Market Value (USD Million) Forecast by Deployment Model, 2020-2035
  • Table 23: Western Europe Market Value (USD Million) Forecast by Organization Size, 2020-2035
  • Table 24: Western Europe Market Value (USD Million) Forecast by Application, 2020-2035
  • Table 25: Eastern Europe Market Value (USD Million) Forecast by Country, 2020-2035
  • Table 26: Eastern Europe Market Value (USD Million) Forecast by Solution , 2020-2035
  • Table 27: Eastern Europe Market Value (USD Million) Forecast by Service, 2020-2035
  • Table 28: Eastern Europe Market Value (USD Million) Forecast by Deployment Model, 2020-2035
  • Table 29: Eastern Europe Market Value (USD Million) Forecast by Organization Size, 2020-2035
  • Table 30: Eastern Europe Market Value (USD Million) Forecast by Application, 2020-2035
  • Table 31: East Asia Market Value (USD Million) Forecast by Country, 2020-2035
  • Table 32: East Asia Market Value (USD Million) Forecast by Solution , 2020-2035
  • Table 33: East Asia Market Value (USD Million) Forecast by Service, 2020-2035
  • Table 34: East Asia Market Value (USD Million) Forecast by Deployment Model, 2020-2035
  • Table 35: East Asia Market Value (USD Million) Forecast by Organization Size, 2020-2035
  • Table 36: East Asia Market Value (USD Million) Forecast by Application, 2020-2035
  • Table 37: South Asia and Pacific Market Value (USD Million) Forecast by Country, 2020-2035
  • Table 38: South Asia and Pacific Market Value (USD Million) Forecast by Solution , 2020-2035
  • Table 39: South Asia and Pacific Market Value (USD Million) Forecast by Service, 2020-2035
  • Table 40: South Asia and Pacific Market Value (USD Million) Forecast by Deployment Model, 2020-2035
  • Table 41: South Asia and Pacific Market Value (USD Million) Forecast by Organization Size, 2020-2035
  • Table 42: South Asia and Pacific Market Value (USD Million) Forecast by Application, 2020-2035
  • Table 43: Middle East & Africa Market Value (USD Million) Forecast by Country, 2020-2035
  • Table 44: Middle East & Africa Market Value (USD Million) Forecast by Solution , 2020-2035
  • Table 45: Middle East & Africa Market Value (USD Million) Forecast by Service, 2020-2035
  • Table 46: Middle East & Africa Market Value (USD Million) Forecast by Deployment Model, 2020-2035
  • Table 47: Middle East & Africa Market Value (USD Million) Forecast by Organization Size, 2020-2035
  • Table 48: Middle East & Africa Market Value (USD Million) Forecast by Application, 2020-2035

List of Figures

  • Figure 1: Global Market Pricing Analysis
  • Figure 2: Global Market Value (USD Million) Forecast 2020-2035
  • Figure 3: Global Market Value (USD Million) Share and BPS Analysis by Region, 2025 and 2035
  • Figure 4: Global Market Y-o-Y Growth Comparison by Region, 2025-2035
  • Figure 5: Global Market Attractiveness Analysis by Region
  • Figure 6: North America Market Incremental Dollar Opportunity, 2025-2035
  • Figure 7: Latin America Market Incremental Dollar Opportunity, 2025-2035
  • Figure 8: Western Europe Market Incremental Dollar Opportunity, 2025-2035
  • Figure 9: Eastern Europe Market Incremental Dollar Opportunity, 2025-2035
  • Figure 10: East Asia Market Incremental Dollar Opportunity, 2025-2035
  • Figure 11: South Asia and Pacific Market Incremental Dollar Opportunity, 2025-2035
  • Figure 12: Middle East & Africa Market Incremental Dollar Opportunity, 2025-2035
  • Figure 13: North America Market Value Share and BPS Analysis by Country, 2025 and 2035
  • Figure 14: Latin America Market Value Share and BPS Analysis by Country, 2025 and 2035
  • Figure 15: Western Europe Market Value Share and BPS Analysis by Country, 2025 and 2035
  • Figure 16: Eastern Europe Market Value Share and BPS Analysis by Country, 2025 and 2035
  • Figure 17: East Asia Market Value Share and BPS Analysis by Country, 2025 and 2035
  • Figure 18: South Asia and Pacific Market Value Share and BPS Analysis by Country, 2025 and 2035
  • Figure 19: Middle East & Africa Market Value Share and BPS Analysis by Country, 2025 and 2035
  • Figure 20: Global Market - Tier Structure Analysis
  • Figure 21: Global Market - Company Share Analysis
Dashboard
Dashboard
Dashboard
Dashboard
Dashboard
Dashboard

Our Research Products

Full Research Suite

The "Full Research Suite" delivers actionable market intel, deep dives on markets or technologies, so clients act faster, cut risk, and unlock growth.

Competitor Leaderboard Report

The Leaderboard benchmarks and ranks top vendors, classifying them as Established Leaders, Leading Challengers, or Disruptors & Challengers.

Future Leaders Index

Locates where complements amplify value and substitutes erode it, forecasting net impact by horizon

Market Data & Forecasts

We deliver granular, decision-grade intel: market sizing, 5-year forecasts, pricing, adoption, usage, revenue, and operational KPIs—plus competitor tracking, regulation, and value chains—across 60 countries broadly.

Market Focus Report

Spot the shifts before they hit your P&L. We track inflection points, adoption curves, pricing moves, and ecosystem plays to show where demand is heading, why it is changing, and what to do next across high-growth markets and disruptive tech

Survey Report

Real-time reads of user behavior. We track shifting priorities, perceptions of today’s and next-gen services, and provider experience, then pace how fast tech moves from trial to adoption, blending buyer, consumer, and channel inputs with social signals (#WhySwitch, #UX).

Bespoke Reports

Partner with our analyst team to build a custom report designed around your business priorities. From analysing market trends to assessing competitors or crafting bespoke datasets, we tailor insights to your needs.

Supplier Intelligence

Discovery & Profiling

Capacity & Footprint

Performance & Risk

Compliance & Governance

Commercial Readiness

Who Supplies Whom

Scorecards & Shortlists

Playbooks & Docs

Category Intelligence

Definition & Scope

Demand & Use Cases

Cost Drivers

Market Structure

Supply Chain Map

Trade & Policy

Operating Norms

Deliverables

Buyer Intelligence

Account Basics

Spend & Scope

Procurement Model

Vendor Requirements

Terms & Policies

Entry Strategy

Pain Points & Triggers

Outputs

Pricing Analysis

Benchmarks

Trends

Should-Cost

Indexation

Landed Cost

Commercial Terms

Deliverables

Brand Analysis

Positioning & Value Prop

Share & Presence

Customer Evidence

Go-to-Market

Digital & Reputation

Compliance & Trust

KPIs & Gaps

Outputs

Full Research Suite comprises of:

Market outlook & trends analysis

Market outlook & trends analysis

Interviews & case studies

Interviews & case studies

Strategic recommendations

Strategic recommendations

Vendor profiles & capabilities analysis

Vendor profiles & capabilities analysis

5-year forecasts

5-year forecasts

8 regions and 60+ country-level data splits

8 regions and 60+ country-level data splits

Market segment data splits

Market segment data splits

12 months of continuous data updates

12 months of continuous data updates

DELIVERED AS:

PDF EXCEL ONLINE

Full Research Suite


$5000

$7500

$10000

Buy Report Now
Similar Industry Reports

Similar Industry Reports

Anti-Money Laundering (AML) Software Solution Market

Anti-Money Laundering (AML) Software Solution Market

Future Market Insights

Anti-money Laundering Market

Chat With MaRIA

Chat With

MaRIA

Hi There, I am MaRIA, Your Market Research Intelligence Assistant. How may I help you?