Antisense Oligonucleotides Market Size and Share Forecast Outlook 2025 to 2035

The Antisense Oligonucleotides Market is estimated to be valued at USD 3.3 billion in 2025 and is projected to reach USD 6.1 billion by 2035, registering a compound annual growth rate (CAGR) of 6.3% over the forecast period.
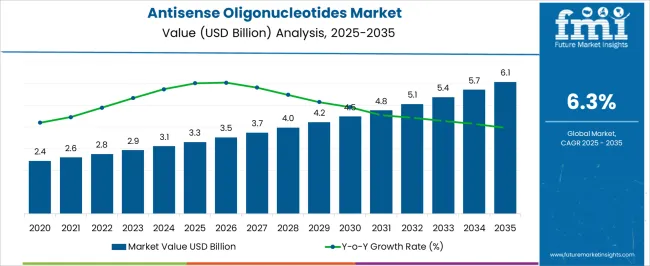
Quick Stats for Antisense Oligonucleotides Market

  • Antisense Oligonucleotides Market Industry Value (2025): USD 3.3 billion
  • Antisense Oligonucleotides Market Forecast Value (2035): USD 6.1 billion
  • Antisense Oligonucleotides Market Forecast CAGR: 6.3%
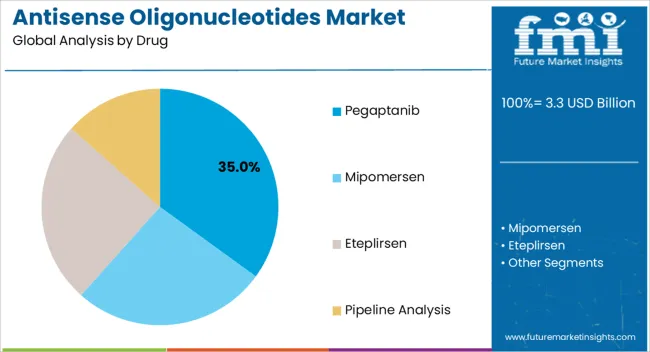
  • Leading Segment in Antisense Oligonucleotides Market in 2025: Pegaptanib (35.0%)
  • Key Growth Region in Antisense Oligonucleotides Market: North America, Asia-Pacific, Europe
  • Top Key Players in Antisense Oligonucleotides Market: Ionis Pharmaceuticals, Inc., Sarepta Therapeutics, Biogen, Alnylam Pharmaceuticals, Inc., Antisense Therapeutics Limited, Isarna Therapeutics GmbH, Arrowhead Pharmaceuticals, Inc., Atlantic Pharmaceuticals, Inc., Enzon Pharmaceuticals, Inc., Bio-Path Holdings, Inc., Gene Signal International SA, GlaxoSmithKline plc, Geron Corporation, Grades, ICO Therapeutics, Aptose Biosciences, Marina Biotech, miRagen Therapeutics, Inc., Synlogic, Inc., OncoGenex Pharmaceuticals Inc., Pharmaxis Ltd, Regulus Therapeutics Inc., Rexahn Pharmaceuticals, Inc., RXi Pharmaceuticals

Antisense Oligonucleotides Market Market Value Analysis

Metric Value
Antisense Oligonucleotides Market Estimated Value in (2025 E) USD 3.3 billion
Antisense Oligonucleotides Market Forecast Value in (2035 F) USD 6.1 billion
Forecast CAGR (2025 to 2035) 6.3%

Rationale for Segmental Growth in the Antisense Oligonucleotides Market

The Antisense Oligonucleotides market is experiencing steady growth due to its ability to specifically modulate gene expression, offering targeted therapeutic approaches for genetic and acquired diseases. The current market scenario reflects increasing adoption in ocular, neurological, and rare genetic disorders, with emphasis on precision medicine and personalized treatment regimens. The market is being shaped by the development of chemically modified oligonucleotides that enhance stability, reduce off-target effects, and improve cellular uptake.

Expanding investment in biotechnology research and rising awareness about gene-targeted therapies are further supporting the market's growth. The increasing prevalence of ocular diseases and genetic disorders is driving clinical and commercial interest in antisense therapeutics. Future growth opportunities are anticipated in applications beyond traditional therapeutic indications, including oncology, metabolic disorders, and research-focused applications.

The potential for improved patient outcomes through highly specific molecular interventions is positioning antisense oligonucleotides as a critical component in modern therapeutic pipelines Continuous innovation in delivery technologies and regulatory support for orphan drugs are expected to sustain growth over the next decade.
Segmental Analysis

Insights into the Pegaptanib Drug Segment

Antisense Oligonucleotides Market Analysis By Drug

The Pegaptanib drug segment is projected to hold 35.00% of the Antisense Oligonucleotides market revenue in 2025, establishing it as the leading drug type. This prominence is attributed to its proven efficacy in treating ocular diseases through targeted inhibition of vascular endothelial growth factor pathways, reducing abnormal blood vessel growth and fluid accumulation.

The growth of this segment has been driven by increasing adoption in age-related macular degeneration treatment and other retinal disorders, supported by long-term clinical data demonstrating safety and effectiveness. The segment’s leading position is also facilitated by established manufacturing and distribution networks, which enable rapid access to patients globally.

Additionally, the ability to integrate Pegaptanib into broader therapeutic protocols without significant alteration of existing care pathways has contributed to widespread utilization As regulatory approvals expand and the patient population with ocular disorders continues to grow, the Pegaptanib segment is expected to maintain leadership, driven by its well-characterized pharmacological profile and clinical reliability.
Insights into the Ocular Diseases Indication Segment

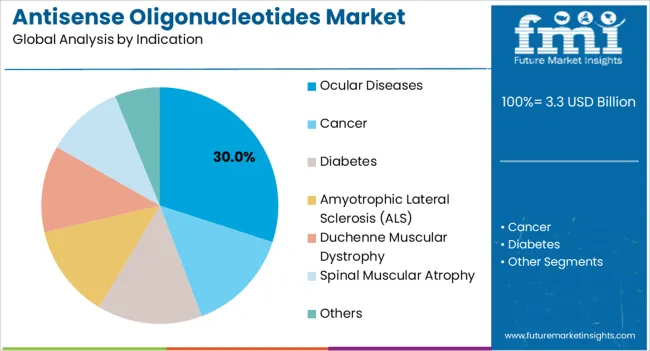
Antisense Oligonucleotides Market Analysis By Indication

The ocular diseases indication segment is expected to account for 30.00% of the Antisense Oligonucleotides market revenue in 2025, making it the leading therapeutic application. The growth in this segment is being driven by increasing prevalence of conditions such as age-related macular degeneration, diabetic retinopathy, and retinal vascular disorders, which require targeted molecular therapies for effective management. The segment benefits from advancements in delivery systems that enhance retinal penetration and reduce systemic exposure.

Additionally, healthcare providers are increasingly prioritizing therapies that can provide sustained efficacy with minimal side effects, favoring antisense oligonucleotides. The availability of well-established clinical data supporting efficacy and safety has facilitated wider adoption among ophthalmologists.

Moreover, the rising aging population and growing awareness about vision preservation are contributing to sustained demand in this indication As research progresses and new antisense molecules targeting ocular diseases enter development pipelines, this segment is expected to continue leading the market due to its high clinical relevance and significant unmet medical needs.
Insights into the Basic Research Application Segment

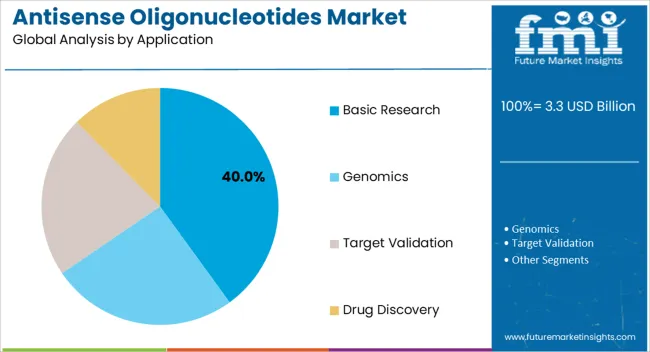
Antisense Oligonucleotides Market Analysis By Application

The basic research application segment is anticipated to hold 40.00% of the Antisense Oligonucleotides market revenue in 2025, reflecting its dominant role in scientific discovery and preclinical investigations. Growth in this segment is driven by the increasing use of antisense oligonucleotides as tools to selectively knock down gene expression, enabling functional genomics studies and mechanistic investigations. The flexibility of these molecules allows researchers to explore a wide range of gene targets across multiple disease areas, supporting innovation in therapeutic discovery.

Investment in biotechnology laboratories and academic research institutions has expanded demand for antisense oligonucleotides in experimental settings. Additionally, the availability of high-fidelity synthesis techniques and chemically modified oligonucleotides has enhanced reliability, reproducibility, and efficiency in basic research applications.

The segment also benefits from integration into broader molecular biology workflows, facilitating rapid adoption and consistent results As genomics and molecular biology research continue to grow, the basic research segment is expected to maintain its market leadership, providing foundational knowledge that drives subsequent clinical and therapeutic applications.

What Factors are Shaping the Antisense Oligonucleotides Industry?

A strong pipeline of antisense oligonucleotides and increased focus on a large number of product approvals and commercialization are likely to expand the global antisense oligonucleotides sector size.

Moreover, significant advances in the field of antisense oligonucleotides at a therapeutic or clinical level are further contributing to the growth of the global market.

However, the global antisense oligonucleotides business is grappling with numerous challenges related to the diversity of oligonucleotides, delivery, and regulatory complexity.

Despite several advancements at clinical levels, the delivery of active oligonucleotides to the actual site within target cells is still one of the key challenges hindering the growth of the global antisense oligonucleotides sector. In addition to this, developing a new set of unique regulatory guidelines is also expected to hamper the market statistics.

Regional Analysis

Countries Market Share (2025)
United States 58%
Germany 3.3%
Japan 2.9%

Why is North America Expected to Dominate the Antisense Oligonucleotides Industry?

North America clearly dominates the global antisense oligonucleotides industry due to a strong product pipeline and an increasing number of FDA approvals in the region, contributing to the region’s market share of 60.9% in 2025.

For instance, the international biotechnology company Biogen Inc.'s Nusinersen, sold as Spinraza, received FDA approval in the USA in 2020. Health infrastructures and an increase in the use of oligonucleotides in the development of innovative pharmacological therapies are additional factors driving market expansion.
What are the Growth Prospects for the Europe Antisense Oligonucleotides Business?

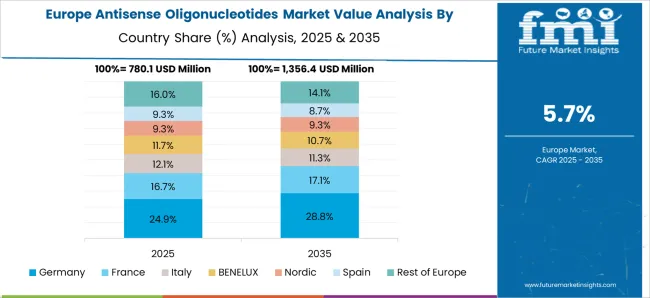
Antisense Oligonucleotides Market Europe Country Market Share Analysis, 2025 & 2035

In 2025, the Europe antisense oligonucleotides sector captured a share of 14.3%. In order to improve their product portfolio for antisense oligonucleotides, key players in Europe are concentrating on strategic mergers and acquisitions, in turn spurring the market growth in Europe.

For instance, in 2014, the multinational pharmaceutical and biopharmaceutical company AstraZeneca Plc. merged with the pharmaceutical firm Ionis Pharmaceuticals. Additionally, it is anticipated that a strong pipeline of important companies aids the market growth to some level.

How is the Start-up Ecosystem in the Antisense Oligonucleotides Industry?

While many organizations are working on RNA-based treatments and vaccines, including well-known companies like Pfizer, BioNtech, Moderna, etc., a few biotech start-ups are also emerging, shaping the market trends.

Examples:

  • RNA-targeting biopharmaceuticals are being created by the USA-based start-up Arrakis Therapeutics.

The company's tiny molecule medications bind to targets that were previously believed to be unreachable as well as those that were confirmed using genetic and pharmacological techniques.

These medications use multiple ways to either decrease RNA translation or splicing. Drugs for oncology, dyslipidemia, and uncommon disorders are in the startup's development.

  • Antisense RNA therapies are created by the Spanish start-up ARTHEx Biotech for hereditary illnesses.

The company's top therapeutic candidate for type 1 myotonic dystrophy is an anti-microRNA (DM1). The start-up's anti-miRs are shown to suppress microRNAs that repress MBNL1/2 genes in DM1 in muscle biopsies of patients.

How Strong Is the Competition in the Antisense Oligonucleotides Business?

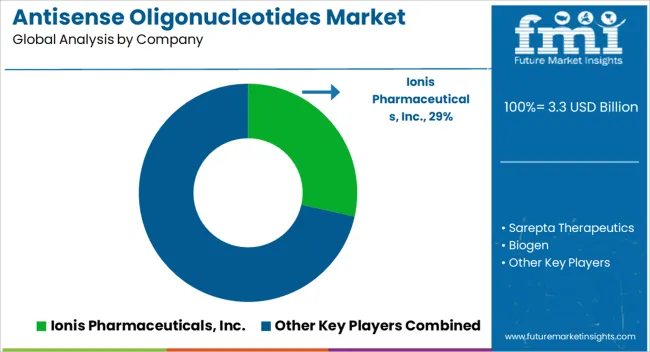
The market for antisense oligonucleotides is fairly consolidated, with a few competitors gaining a significant growing share. The market participants for antisense oligonucleotides are heavily invested in research and development. These activities assist the participants in developing novel formulations that are advantageous to the user.

A couple of recent developments are:

  • AmpTec, a renowned German company that specializes in mRNA contract development and manufacture, was purchased by MilliporeSigma (USA) (CDMO).

The agreement improves MilliporeSigma's capacity to produce and develop mRNA for its clients' usage in Covid-19 and numerous other diseases-related vaccines, therapies, and diagnostics.
  • oPools- oligo pools, a collection of 350-nucleotide-long, high-quality DNA oligonucleotides, was introduced by Integrated DNA Technology (USA).

Key player

Antisense Oligonucleotides Market Analysis By Company

  • Ionis Pharmaceuticals, Inc.
  • Sarepta Therapeutics
  • Biogen
  • Alnylam Pharmaceuticals, Inc.
  • Antisense Therapeutics Limited
  • Isarna Therapeutics GmbH
  • Arrowhead Pharmaceuticals, Inc.
  • Atlantic Pharmaceuticals, Inc.
  • Enzon Pharmaceuticals, Inc.
  • Bio-Path Holdings, Inc.
  • Gene Signal International SA
  • GlaxoSmithKline plc
  • Geron Corporation
  • Grades
  • ICO Therapeutics
  • Aptose Biosciences
  • Marina Biotech
  • miRagen Therapeutics, Inc.
  • Synlogic, Inc.
  • OncoGenex Pharmaceuticals Inc.
  • Pharmaxis Ltd, Regulus Therapeutics Inc.
  • Rexahn Pharmaceuticals, Inc.
  • RXi Pharmaceuticals

Key Segments

By Drug:

  • Approved Drugs
  • Pegaptanib
  • Mipomersen
  • Eteplirsen
  • Pipeline Analysis

By Indication:

  • Ocular Diseases
  • Cancer
  • Diabetes
  • Amyotrophic Lateral Sclerosis (ALS)
  • Duchenne Muscular Dystrophy
  • Spinal Muscular Atrophy
  • Others

By Application:

  • Basic Research
  • Genomics
  • Target Validation
  • Drug Discovery

By Region:

  • North America
  • Latin America
  • Asia Pacific
  • The Middle East and Africa
  • Europe

Table of Content

  1. Executive Summary
    • Global Market Outlook
    • Demand-side Trends
    • Supply-side Trends
    • Technology Roadmap Analysis
    • Analysis and Recommendations
  2. Market Overview
    • Market Coverage / Taxonomy
    • Market Definition / Scope / Limitations
  3. Market Background
    • Market Dynamics
      • Drivers
      • Restraints
      • Opportunity
      • Trends
    • Scenario Forecast
      • Demand in Optimistic Scenario
      • Demand in Likely Scenario
      • Demand in Conservative Scenario
    • Opportunity Map Analysis
    • Product Life Cycle Analysis
    • Supply Chain Analysis
    • Investment Feasibility Matrix
    • Value Chain Analysis
    • PESTLE and Porter’s Analysis
    • Regulatory Landscape
    • Regional Parent Market Outlook
    • Production and Consumption Statistics
    • Import and Export Statistics
  4. Global Market Analysis 2020 to 2024 and Forecast, 2025 to 2035
    • Historical Market Size Value (USD Million) Analysis, 2020 to 2024
    • Current and Future Market Size Value (USD Million) Projections, 2025 to 2035
      • Y-o-Y Growth Trend Analysis
      • Absolute $ Opportunity Analysis
  5. Global Market Pricing Analysis 2020 to 2024 and Forecast 2025 to 2035
  6. Global Market Analysis 2020 to 2024 and Forecast 2025 to 2035, By Drug
    • Introduction / Key Findings
    • Historical Market Size Value (USD Million) Analysis By Drug , 2020 to 2024
    • Current and Future Market Size Value (USD Million) Analysis and Forecast By Drug , 2025 to 2035
      • Pegaptanib
      • Mipomersen
      • Eteplirsen
      • Pipeline Analysis
    • Y-o-Y Growth Trend Analysis By Drug , 2020 to 2024
    • Absolute $ Opportunity Analysis By Drug , 2025 to 2035
  7. Global Market Analysis 2020 to 2024 and Forecast 2025 to 2035, By Indication
    • Introduction / Key Findings
    • Historical Market Size Value (USD Million) Analysis By Indication, 2020 to 2024
    • Current and Future Market Size Value (USD Million) Analysis and Forecast By Indication, 2025 to 2035
      • Ocular Diseases
      • Cancer
      • Diabetes
      • Amyotrophic Lateral Sclerosis (ALS)
      • Duchenne Muscular Dystrophy
      • Spinal Muscular Atrophy
      • Others
    • Y-o-Y Growth Trend Analysis By Indication, 2020 to 2024
    • Absolute $ Opportunity Analysis By Indication, 2025 to 2035
  8. Global Market Analysis 2020 to 2024 and Forecast 2025 to 2035, By Application
    • Introduction / Key Findings
    • Historical Market Size Value (USD Million) Analysis By Application, 2020 to 2024
    • Current and Future Market Size Value (USD Million) Analysis and Forecast By Application, 2025 to 2035
      • Basic Research
      • Genomics
      • Target Validation
      • Drug Discovery
    • Y-o-Y Growth Trend Analysis By Application, 2020 to 2024
    • Absolute $ Opportunity Analysis By Application, 2025 to 2035
  9. Global Market Analysis 2020 to 2024 and Forecast 2025 to 2035, By Region
    • Introduction
    • Historical Market Size Value (USD Million) Analysis By Region, 2020 to 2024
    • Current Market Size Value (USD Million) Analysis and Forecast By Region, 2025 to 2035
      • North America
      • Latin America
      • Western Europe
      • Eastern Europe
      • East Asia
      • South Asia and Pacific
      • Middle East & Africa
    • Market Attractiveness Analysis By Region
  10. North America Market Analysis 2020 to 2024 and Forecast 2025 to 2035, By Country
    • Historical Market Size Value (USD Million) Trend Analysis By Market Taxonomy, 2020 to 2024
    • Market Size Value (USD Million) Forecast By Market Taxonomy, 2025 to 2035
      • By Country
        • USA
        • Canada
        • Mexico
      • By Drug
      • By Indication
      • By Application
    • Market Attractiveness Analysis
      • By Country
      • By Drug
      • By Indication
      • By Application
    • Key Takeaways
  11. Latin America Market Analysis 2020 to 2024 and Forecast 2025 to 2035, By Country
    • Historical Market Size Value (USD Million) Trend Analysis By Market Taxonomy, 2020 to 2024
    • Market Size Value (USD Million) Forecast By Market Taxonomy, 2025 to 2035
      • By Country
        • Brazil
        • Chile
        • Rest of Latin America
      • By Drug
      • By Indication
      • By Application
    • Market Attractiveness Analysis
      • By Country
      • By Drug
      • By Indication
      • By Application
    • Key Takeaways
  12. Western Europe Market Analysis 2020 to 2024 and Forecast 2025 to 2035, By Country
    • Historical Market Size Value (USD Million) Trend Analysis By Market Taxonomy, 2020 to 2024
    • Market Size Value (USD Million) Forecast By Market Taxonomy, 2025 to 2035
      • By Country
        • Germany
        • UK
        • Italy
        • Spain
        • France
        • Nordic
        • BENELUX
        • Rest of Western Europe
      • By Drug
      • By Indication
      • By Application
    • Market Attractiveness Analysis
      • By Country
      • By Drug
      • By Indication
      • By Application
    • Key Takeaways
  13. Eastern Europe Market Analysis 2020 to 2024 and Forecast 2025 to 2035, By Country
    • Historical Market Size Value (USD Million) Trend Analysis By Market Taxonomy, 2020 to 2024
    • Market Size Value (USD Million) Forecast By Market Taxonomy, 2025 to 2035
      • By Country
        • Russia
        • Poland
        • Hungary
        • Balkan & Baltic
        • Rest of Eastern Europe
      • By Drug
      • By Indication
      • By Application
    • Market Attractiveness Analysis
      • By Country
      • By Drug
      • By Indication
      • By Application
    • Key Takeaways
  14. East Asia Market Analysis 2020 to 2024 and Forecast 2025 to 2035, By Country
    • Historical Market Size Value (USD Million) Trend Analysis By Market Taxonomy, 2020 to 2024
    • Market Size Value (USD Million) Forecast By Market Taxonomy, 2025 to 2035
      • By Country
        • China
        • Japan
        • South Korea
      • By Drug
      • By Indication
      • By Application
    • Market Attractiveness Analysis
      • By Country
      • By Drug
      • By Indication
      • By Application
    • Key Takeaways
  15. South Asia and Pacific Market Analysis 2020 to 2024 and Forecast 2025 to 2035, By Country
    • Historical Market Size Value (USD Million) Trend Analysis By Market Taxonomy, 2020 to 2024
    • Market Size Value (USD Million) Forecast By Market Taxonomy, 2025 to 2035
      • By Country
        • India
        • ASEAN
        • Australia & New Zealand
        • Rest of South Asia and Pacific
      • By Drug
      • By Indication
      • By Application
    • Market Attractiveness Analysis
      • By Country
      • By Drug
      • By Indication
      • By Application
    • Key Takeaways
  16. Middle East & Africa Market Analysis 2020 to 2024 and Forecast 2025 to 2035, By Country
    • Historical Market Size Value (USD Million) Trend Analysis By Market Taxonomy, 2020 to 2024
    • Market Size Value (USD Million) Forecast By Market Taxonomy, 2025 to 2035
      • By Country
        • Kingdom of Saudi Arabia
        • Other GCC Countries
        • Turkiye
        • South Africa
        • Other African Union
        • Rest of Middle East & Africa
      • By Drug
      • By Indication
      • By Application
    • Market Attractiveness Analysis
      • By Country
      • By Drug
      • By Indication
      • By Application
    • Key Takeaways
  17. Key Countries Market Analysis
    • USA
      • Pricing Analysis
      • Market Share Analysis, 2024
        • By Drug
        • By Indication
        • By Application
    • Canada
      • Pricing Analysis
      • Market Share Analysis, 2024
        • By Drug
        • By Indication
        • By Application
    • Mexico
      • Pricing Analysis
      • Market Share Analysis, 2024
        • By Drug
        • By Indication
        • By Application
    • Brazil
      • Pricing Analysis
      • Market Share Analysis, 2024
        • By Drug
        • By Indication
        • By Application
    • Chile
      • Pricing Analysis
      • Market Share Analysis, 2024
        • By Drug
        • By Indication
        • By Application
    • Germany
      • Pricing Analysis
      • Market Share Analysis, 2024
        • By Drug
        • By Indication
        • By Application
    • UK
      • Pricing Analysis
      • Market Share Analysis, 2024
        • By Drug
        • By Indication
        • By Application
    • Italy
      • Pricing Analysis
      • Market Share Analysis, 2024
        • By Drug
        • By Indication
        • By Application
    • Spain
      • Pricing Analysis
      • Market Share Analysis, 2024
        • By Drug
        • By Indication
        • By Application
    • France
      • Pricing Analysis
      • Market Share Analysis, 2024
        • By Drug
        • By Indication
        • By Application
    • India
      • Pricing Analysis
      • Market Share Analysis, 2024
        • By Drug
        • By Indication
        • By Application
    • ASEAN
      • Pricing Analysis
      • Market Share Analysis, 2024
        • By Drug
        • By Indication
        • By Application
    • Australia & New Zealand
      • Pricing Analysis
      • Market Share Analysis, 2024
        • By Drug
        • By Indication
        • By Application
    • China
      • Pricing Analysis
      • Market Share Analysis, 2024
        • By Drug
        • By Indication
        • By Application
    • Japan
      • Pricing Analysis
      • Market Share Analysis, 2024
        • By Drug
        • By Indication
        • By Application
    • South Korea
      • Pricing Analysis
      • Market Share Analysis, 2024
        • By Drug
        • By Indication
        • By Application
    • Russia
      • Pricing Analysis
      • Market Share Analysis, 2024
        • By Drug
        • By Indication
        • By Application
    • Poland
      • Pricing Analysis
      • Market Share Analysis, 2024
        • By Drug
        • By Indication
        • By Application
    • Hungary
      • Pricing Analysis
      • Market Share Analysis, 2024
        • By Drug
        • By Indication
        • By Application
    • Kingdom of Saudi Arabia
      • Pricing Analysis
      • Market Share Analysis, 2024
        • By Drug
        • By Indication
        • By Application
    • Turkiye
      • Pricing Analysis
      • Market Share Analysis, 2024
        • By Drug
        • By Indication
        • By Application
    • South Africa
      • Pricing Analysis
      • Market Share Analysis, 2024
        • By Drug
        • By Indication
        • By Application
  18. Market Structure Analysis
    • Competition Dashboard
    • Competition Benchmarking
    • Market Share Analysis of Top Players
      • By Regional
      • By Drug
      • By Indication
      • By Application
  19. Competition Analysis
    • Competition Deep Dive
      • Ionis Pharmaceuticals, Inc.
        • Overview
        • Product Portfolio
        • Profitability by Market Segments (Product/Age /Sales Channel/Region)
        • Sales Footprint
        • Strategy Overview
          • Marketing Strategy
          • Product Strategy
          • Channel Strategy
      • Sarepta Therapeutics
      • Biogen
      • Alnylam Pharmaceuticals, Inc.
      • Antisense Therapeutics Limited
      • Isarna Therapeutics GmbH
      • Arrowhead Pharmaceuticals, Inc.
      • Atlantic Pharmaceuticals, Inc.
      • Enzon Pharmaceuticals, Inc.
      • Bio-Path Holdings, Inc.
      • Gene Signal International SA
      • GlaxoSmithKline plc
      • Geron Corporation
      • Grades
      • ICO Therapeutics
      • Aptose Biosciences
      • Marina Biotech
      • miRagen Therapeutics, Inc.
      • Synlogic, Inc.
      • OncoGenex Pharmaceuticals Inc.
  20. Assumptions & Acronyms Used
  21. Research Methodology

List of Tables

  • Table 1: Global Market Value (USD Million) Forecast by Region, 2020 to 2035
  • Table 2: Global Market Value (USD Million) Forecast by Drug , 2020 to 2035
  • Table 3: Global Market Value (USD Million) Forecast by Indication, 2020 to 2035
  • Table 4: Global Market Value (USD Million) Forecast by Application, 2020 to 2035
  • Table 5: North America Market Value (USD Million) Forecast by Country, 2020 to 2035
  • Table 6: North America Market Value (USD Million) Forecast by Drug , 2020 to 2035
  • Table 7: North America Market Value (USD Million) Forecast by Indication, 2020 to 2035
  • Table 8: North America Market Value (USD Million) Forecast by Application, 2020 to 2035
  • Table 9: Latin America Market Value (USD Million) Forecast by Country, 2020 to 2035
  • Table 10: Latin America Market Value (USD Million) Forecast by Drug , 2020 to 2035
  • Table 11: Latin America Market Value (USD Million) Forecast by Indication, 2020 to 2035
  • Table 12: Latin America Market Value (USD Million) Forecast by Application, 2020 to 2035
  • Table 13: Western Europe Market Value (USD Million) Forecast by Country, 2020 to 2035
  • Table 14: Western Europe Market Value (USD Million) Forecast by Drug , 2020 to 2035
  • Table 15: Western Europe Market Value (USD Million) Forecast by Indication, 2020 to 2035
  • Table 16: Western Europe Market Value (USD Million) Forecast by Application, 2020 to 2035
  • Table 17: Eastern Europe Market Value (USD Million) Forecast by Country, 2020 to 2035
  • Table 18: Eastern Europe Market Value (USD Million) Forecast by Drug , 2020 to 2035
  • Table 19: Eastern Europe Market Value (USD Million) Forecast by Indication, 2020 to 2035
  • Table 20: Eastern Europe Market Value (USD Million) Forecast by Application, 2020 to 2035
  • Table 21: East Asia Market Value (USD Million) Forecast by Country, 2020 to 2035
  • Table 22: East Asia Market Value (USD Million) Forecast by Drug , 2020 to 2035
  • Table 23: East Asia Market Value (USD Million) Forecast by Indication, 2020 to 2035
  • Table 24: East Asia Market Value (USD Million) Forecast by Application, 2020 to 2035
  • Table 25: South Asia and Pacific Market Value (USD Million) Forecast by Country, 2020 to 2035
  • Table 26: South Asia and Pacific Market Value (USD Million) Forecast by Drug , 2020 to 2035
  • Table 27: South Asia and Pacific Market Value (USD Million) Forecast by Indication, 2020 to 2035
  • Table 28: South Asia and Pacific Market Value (USD Million) Forecast by Application, 2020 to 2035
  • Table 29: Middle East & Africa Market Value (USD Million) Forecast by Country, 2020 to 2035
  • Table 30: Middle East & Africa Market Value (USD Million) Forecast by Drug , 2020 to 2035
  • Table 31: Middle East & Africa Market Value (USD Million) Forecast by Indication, 2020 to 2035
  • Table 32: Middle East & Africa Market Value (USD Million) Forecast by Application, 2020 to 2035

List of Figures

  • Figure 1: Global Market Pricing Analysis
  • Figure 2: Global Market Value (USD Million) Forecast 2020-2035
  • Figure 3: Global Market Value Share and BPS Analysis by Drug , 2025 and 2035
  • Figure 4: Global Market Y-o-Y Growth Comparison by Drug , 2025-2035
  • Figure 5: Global Market Attractiveness Analysis by Drug
  • Figure 6: Global Market Value Share and BPS Analysis by Indication, 2025 and 2035
  • Figure 7: Global Market Y-o-Y Growth Comparison by Indication, 2025-2035
  • Figure 8: Global Market Attractiveness Analysis by Indication
  • Figure 9: Global Market Value Share and BPS Analysis by Application, 2025 and 2035
  • Figure 10: Global Market Y-o-Y Growth Comparison by Application, 2025-2035
  • Figure 11: Global Market Attractiveness Analysis by Application
  • Figure 12: Global Market Value (USD Million) Share and BPS Analysis by Region, 2025 and 2035
  • Figure 13: Global Market Y-o-Y Growth Comparison by Region, 2025-2035
  • Figure 14: Global Market Attractiveness Analysis by Region
  • Figure 15: North America Market Incremental Dollar Opportunity, 2025-2035
  • Figure 16: Latin America Market Incremental Dollar Opportunity, 2025-2035
  • Figure 17: Western Europe Market Incremental Dollar Opportunity, 2025-2035
  • Figure 18: Eastern Europe Market Incremental Dollar Opportunity, 2025-2035
  • Figure 19: East Asia Market Incremental Dollar Opportunity, 2025-2035
  • Figure 20: South Asia and Pacific Market Incremental Dollar Opportunity, 2025-2035
  • Figure 21: Middle East & Africa Market Incremental Dollar Opportunity, 2025-2035
  • Figure 22: North America Market Value Share and BPS Analysis by Country, 2025 and 2035
  • Figure 23: North America Market Value Share and BPS Analysis by Drug , 2025 and 2035
  • Figure 24: North America Market Y-o-Y Growth Comparison by Drug , 2025-2035
  • Figure 25: North America Market Attractiveness Analysis by Drug
  • Figure 26: North America Market Value Share and BPS Analysis by Indication, 2025 and 2035
  • Figure 27: North America Market Y-o-Y Growth Comparison by Indication, 2025-2035
  • Figure 28: North America Market Attractiveness Analysis by Indication
  • Figure 29: North America Market Value Share and BPS Analysis by Application, 2025 and 2035
  • Figure 30: North America Market Y-o-Y Growth Comparison by Application, 2025-2035
  • Figure 31: North America Market Attractiveness Analysis by Application
  • Figure 32: Latin America Market Value Share and BPS Analysis by Country, 2025 and 2035
  • Figure 33: Latin America Market Value Share and BPS Analysis by Drug , 2025 and 2035
  • Figure 34: Latin America Market Y-o-Y Growth Comparison by Drug , 2025-2035
  • Figure 35: Latin America Market Attractiveness Analysis by Drug
  • Figure 36: Latin America Market Value Share and BPS Analysis by Indication, 2025 and 2035
  • Figure 37: Latin America Market Y-o-Y Growth Comparison by Indication, 2025-2035
  • Figure 38: Latin America Market Attractiveness Analysis by Indication
  • Figure 39: Latin America Market Value Share and BPS Analysis by Application, 2025 and 2035
  • Figure 40: Latin America Market Y-o-Y Growth Comparison by Application, 2025-2035
  • Figure 41: Latin America Market Attractiveness Analysis by Application
  • Figure 42: Western Europe Market Value Share and BPS Analysis by Country, 2025 and 2035
  • Figure 43: Western Europe Market Value Share and BPS Analysis by Drug , 2025 and 2035
  • Figure 44: Western Europe Market Y-o-Y Growth Comparison by Drug , 2025-2035
  • Figure 45: Western Europe Market Attractiveness Analysis by Drug
  • Figure 46: Western Europe Market Value Share and BPS Analysis by Indication, 2025 and 2035
  • Figure 47: Western Europe Market Y-o-Y Growth Comparison by Indication, 2025-2035
  • Figure 48: Western Europe Market Attractiveness Analysis by Indication
  • Figure 49: Western Europe Market Value Share and BPS Analysis by Application, 2025 and 2035
  • Figure 50: Western Europe Market Y-o-Y Growth Comparison by Application, 2025-2035
  • Figure 51: Western Europe Market Attractiveness Analysis by Application
  • Figure 52: Eastern Europe Market Value Share and BPS Analysis by Country, 2025 and 2035
  • Figure 53: Eastern Europe Market Value Share and BPS Analysis by Drug , 2025 and 2035
  • Figure 54: Eastern Europe Market Y-o-Y Growth Comparison by Drug , 2025-2035
  • Figure 55: Eastern Europe Market Attractiveness Analysis by Drug
  • Figure 56: Eastern Europe Market Value Share and BPS Analysis by Indication, 2025 and 2035
  • Figure 57: Eastern Europe Market Y-o-Y Growth Comparison by Indication, 2025-2035
  • Figure 58: Eastern Europe Market Attractiveness Analysis by Indication
  • Figure 59: Eastern Europe Market Value Share and BPS Analysis by Application, 2025 and 2035
  • Figure 60: Eastern Europe Market Y-o-Y Growth Comparison by Application, 2025-2035
  • Figure 61: Eastern Europe Market Attractiveness Analysis by Application
  • Figure 62: East Asia Market Value Share and BPS Analysis by Country, 2025 and 2035
  • Figure 63: East Asia Market Value Share and BPS Analysis by Drug , 2025 and 2035
  • Figure 64: East Asia Market Y-o-Y Growth Comparison by Drug , 2025-2035
  • Figure 65: East Asia Market Attractiveness Analysis by Drug
  • Figure 66: East Asia Market Value Share and BPS Analysis by Indication, 2025 and 2035
  • Figure 67: East Asia Market Y-o-Y Growth Comparison by Indication, 2025-2035
  • Figure 68: East Asia Market Attractiveness Analysis by Indication
  • Figure 69: East Asia Market Value Share and BPS Analysis by Application, 2025 and 2035
  • Figure 70: East Asia Market Y-o-Y Growth Comparison by Application, 2025-2035
  • Figure 71: East Asia Market Attractiveness Analysis by Application
  • Figure 72: South Asia and Pacific Market Value Share and BPS Analysis by Country, 2025 and 2035
  • Figure 73: South Asia and Pacific Market Value Share and BPS Analysis by Drug , 2025 and 2035
  • Figure 74: South Asia and Pacific Market Y-o-Y Growth Comparison by Drug , 2025-2035
  • Figure 75: South Asia and Pacific Market Attractiveness Analysis by Drug
  • Figure 76: South Asia and Pacific Market Value Share and BPS Analysis by Indication, 2025 and 2035
  • Figure 77: South Asia and Pacific Market Y-o-Y Growth Comparison by Indication, 2025-2035
  • Figure 78: South Asia and Pacific Market Attractiveness Analysis by Indication
  • Figure 79: South Asia and Pacific Market Value Share and BPS Analysis by Application, 2025 and 2035
  • Figure 80: South Asia and Pacific Market Y-o-Y Growth Comparison by Application, 2025-2035
  • Figure 81: South Asia and Pacific Market Attractiveness Analysis by Application
  • Figure 82: Middle East & Africa Market Value Share and BPS Analysis by Country, 2025 and 2035
  • Figure 83: Middle East & Africa Market Value Share and BPS Analysis by Drug , 2025 and 2035
  • Figure 84: Middle East & Africa Market Y-o-Y Growth Comparison by Drug , 2025-2035
  • Figure 85: Middle East & Africa Market Attractiveness Analysis by Drug
  • Figure 86: Middle East & Africa Market Value Share and BPS Analysis by Indication, 2025 and 2035
  • Figure 87: Middle East & Africa Market Y-o-Y Growth Comparison by Indication, 2025-2035
  • Figure 88: Middle East & Africa Market Attractiveness Analysis by Indication
  • Figure 89: Middle East & Africa Market Value Share and BPS Analysis by Application, 2025 and 2035
  • Figure 90: Middle East & Africa Market Y-o-Y Growth Comparison by Application, 2025-2035
  • Figure 91: Middle East & Africa Market Attractiveness Analysis by Application
  • Figure 92: Global Market - Tier Structure Analysis
  • Figure 93: Global Market - Company Share Analysis

Frequently Asked Questions

How big is the antisense oligonucleotides market in 2025?

The global antisense oligonucleotides market is estimated to be valued at USD 3.3 billion in 2025.

What will be the size of antisense oligonucleotides market in 2035?

The market size for the antisense oligonucleotides market is projected to reach USD 6.1 billion by 2035.

How much will be the antisense oligonucleotides market growth between 2025 and 2035?

The antisense oligonucleotides market is expected to grow at a 6.3% CAGR between 2025 and 2035.

What are the key product types in the antisense oligonucleotides market?

The key product types in antisense oligonucleotides market are pegaptanib, mipomersen, eteplirsen and pipeline analysis.

Which indication segment to contribute significant share in the antisense oligonucleotides market in 2025?

In terms of indication, ocular diseases segment to command 30.0% share in the antisense oligonucleotides market in 2025.

Future Market Insights

Antisense Oligonucleotides Market

Chat With MaRIA

Chat With

MaRIA

Hi There, I am MaRIA, Your Market Research Intelligence Assistant. How may I help you?