Aquaponics Market Size, Share, and Forecast Outlook 2025 to 2035

The aquaponics market is forecasted to reach USD 1.8 billion in 2025 and is projected to grow steadily to USD 3.9 billion by 2035, registering a CAGR of 8.1% over the assessment period. This expansion is being shaped by growing interest in chemical-free and locally grown produce, particularly in water-scarce zones.
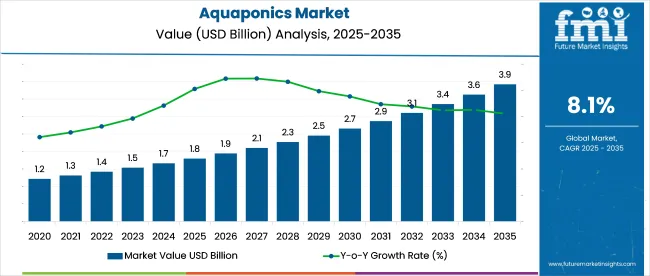
Quick Stats of Aquaponics Market

  • Market Value (2025): USD 1.8 billion
  • Forecast Value (2035): USD 3.9 billion
  • Forecast CAGR (2025 to 2035): 8.1%
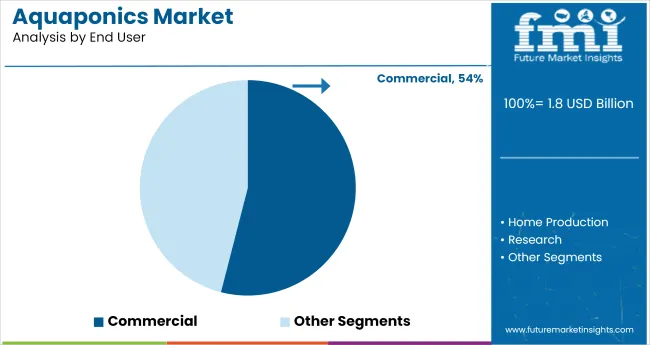
  • Leading Segment in 2025: Commercial (54% share)
  • Key Growth Region: Asia Pacific (China is the fastest growing market with 8.2% CAGR)
  • Key Players: Pentair Aquatic Eco-Systems, Nelson and Pade, Inc., Aquaponics USA, Greenlife Aquaponics, The Aquaponic Source, Endless Food Systems, Japan Aquaponics, Stuppy Greenhouse, Symbiotic Aquaponic, Practical Aquaponics.

Aquaponics Market Market

Attribute Values
Estimated Industry Size (2025E) USD 1.8 billion
Projected Industry Value (2035F) USD 3.9 billion
CAGR (2025 to 2035) 8.1%

Government bodies, non-profits, and agriculture-focused research institutes have been encouraging aquaponic systems as part of broader food security strategies, especially in regions with limited arable land or water constraints.

Rising health consciousness, combined with a distrust of industrial agriculture practices, has further reinforced the appeal of closed-loop production systems that integrate fish farming with hydroponic plant cultivation. As supply chains face periodic disruptions and concerns mount over pesticide residues, the system offers both traceability and reduced environmental exposure, making it a viable choice for health-focused and environmentally-aware consumers.

The market registers a niche share across its parent industries in 2025, representing 1% of the global hydroponics market and about 2.4% of the broader aquaculture market. Within the controlled environment agriculture (CEA) space, they contributed roughly 5.6%, owing to its integrated nature, combining plant and fish production. Its share in the organic food market remains below 1%, constrained by certification complexities and scale limitations.

In agriculture technologies, this represents close to 4.2%, driven by its closed-loop water and nutrient efficiency appeal. Despite modest penetration, it continues to attract interest for its multi-yield potential and adaptability in land-constrained regions, positioning it as a growing subsegment across these overlapping parent markets.

The consumption of systems remained largely concentrated in experimental setups, niche organic communities, and research-driven initiatives from 2020 to 2025. Although awareness about the product increased during this period, particularly following the food supply shocks triggered by COVID-19, commercial-scale adoption remained limited.

The capital costs for system setup, lack of widespread technical expertise, and regulatory ambiguity in many countries acted as significant barriers. Adoption was strongest in regions with state-led incentive schemes or university-backed pilot projects.

Most systems during this period were small to medium-sized installations, often oriented around leafy greens, herbs, and home-grown fish, with limited reach into mainstream food retail or foodservice channels. Nonetheless, this early phase served to educate a segment of producers andfarmers, who began to exploreproductsas a supplement to traditional agriculture.

Analyzing Aquaponics Market by Top Investment Segments

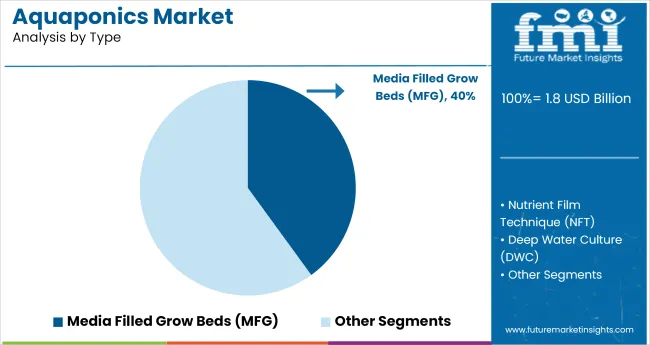
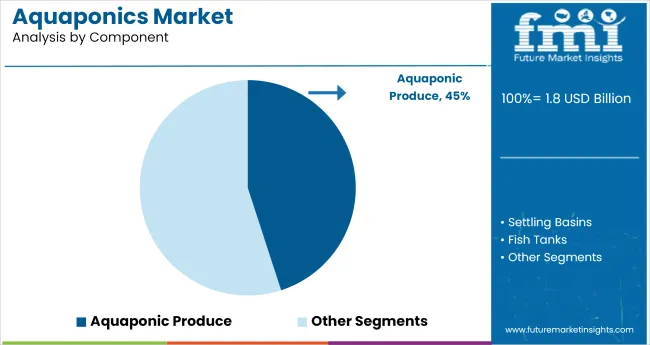
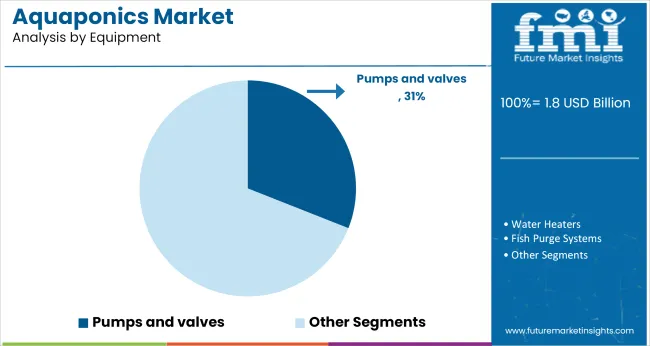
Media-filled grow beds, aquaponic produce, pumps and valves, vegetables, and commercial end users lead their respective segments in 2025 due to ease of use, reliable yields, essential system functions, and strong retail demand. Their dominance reflects scalability, consumer preference for pesticide-free food, and system efficiency across commercial setups.
Media-Filled Grow Beds Driving System Preference in Aquaponics

Aquaponics Market Analysis By Type

Media-filled grow beds (MFG) have emerged as the leading segment within aquaponic systems, accounting for 40% of the market share in 2025. Their dominance is largely attributed to the simplicity of setup, low technical requirements, and versatility across both residential and commercial use cases.
  • Unlike deep water culture or nutrient film techniques, MFG systems support a wider variety of crops, including leafy greens, herbs, and root vegetables, without the need for complex nutrient dosing.
  • The solid media used in these systems, typically clay pebbles or gravel, facilitates mechanical and biological filtration in one unit, reducing the need for additional components.
  • Dual function makes MFG systems especially attractive to small-scale farmers and educational institutions, where ease of maintenance and flexibility are critical adoption factors.

Aquaponic Produce Segment Leads Due to Consumer and Retail Demand

Aquaponics Market Analysis By Component

Aquaponic produce holds the leading position among components, capturing 45% of the market share in 2025, driven by growing demand for chemical-free vegetables and fish.
  • Consumers are increasingly prioritizing food grown without synthetic fertilizers or pesticides, pushing supermarkets and restaurants to source directly from aquaponic farms.
  • Lettuce, kale, spinach, tilapia, and trout are commonly grown due to their compatibility with recirculating systems and short harvest cycles.
  • Operators are optimizing yields through sensor-based nutrient control and automation, making aquaponic produce more viable for a consistent supply.

Pumps and Valves Segment Leads Aquaponics Equipment Market

Aquaponics Market Analysis By Equipment

Pumps and valves represent the leading equipment segment in the market, holding an estimated 31% share in 2025. Their dominance stems from their essential role in maintaining continuous water flow between fish tanks and plant grow beds, which is central to the closed-loop nature of aquaponic systems.
  • Pumps facilitate the recirculation of nutrient-rich water, ensuring efficient nutrient transfer and oxygenation.
  • Valves regulate water pressure and flow direction, supporting customizable setups for different system types, including media-filled grow beds and deep water culture systems.
  • Commercial farms, educational setups, and even home kits prioritize this equipment category due to its direct influence on productivity, making it the backbone of aquaponic infrastructure across scales.

Vegetables Segment Dominates Aquaponics Applications

Aquaponics Market Analysis By Application

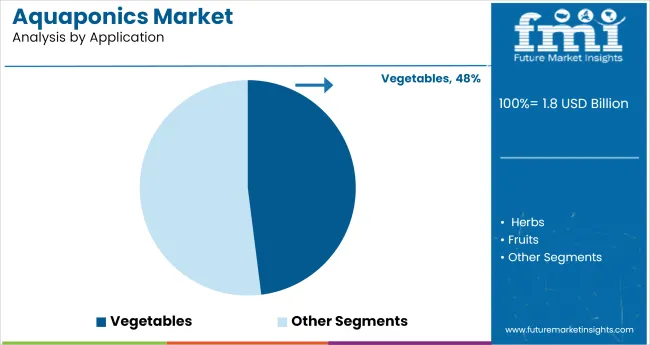
Vegetables account for the leading share in the market by application, estimated at 48% in 2025. This dominance is driven by the consistent demand for leafy greens like lettuce, spinach, and kale, which grow efficiently in aquaponic systems with minimal input.
  • Crops have short growth cycles, enabling rapid turnover and stable yield per square meter, which is especially attractive in commercial and farming setups.
  • Unlike herbs or fruits, vegetables can be cultivated year-round and harvested frequently, optimizing both space and system productivity.
  • Restaurants, supermarkets, and community-supported agriculture programs are increasingly sourcing aquaponically grown vegetables for their freshness and traceability, reinforcing their prominence within this application segment.

Commercial Segment Leads Aquaponics Market by End User

Aquaponics Market Analysis By End User

The commercial segment holds the leading share in themarket by end user, accounting for 54% in 2025. This leadership is driven by the scalability and revenue potential of products in retail supply chains, foodservice, and institutional procurement.

  • Commercial farms are investing in automated monitoring, climate control, and vertical farming integration to optimize fish and plant output within confinedspaces.
  • Unlike home production or research setups, commercial installations are designed for high-volume harvests and year-round operation, making them attractive to supermarkets and restaurants prioritizing traceable, chemical-free produce.
  • Strategic alliances with food distributors and public institutions are enabling commercial operators to expand distribution.

Top Aquaponics Market Dynamics

Aquaponic farms are cutting costs through nutrient recycling, water-saving systems, and solid waste recovery. Retailers are improving off-take by aligning procurement with harvest cycles, reducing spoilage, and enhancing supply chain efficiency.

Closed-Loop Input Recovery Enhances Cost Control

Aquaponic farms have begun optimizing input loops to reduce dependence on external fertilizers and water replenishment. Commercial setups in Southeast Asia lowered input costs by 21% in 2024 by integrating mineralization tanks that recycle fish waste into bioavailable nutrients.

Recirculation system refinements in California helped decrease water usage per kg of lettuce by 36% compared to conventional hydroponics. Mid-size farms in Germany now use sedimentation cones to recover up to 74% of suspended solids for reuse, enabling longer filtration cycles.

  • Mineralization tanks reduce nutrient dependency
  • Recirculation redesign cuts water intensity
  • Solid recovery systems lower maintenance frequency

Retail Alignment with Aquaponic Output Cycles Boosts Offtake

Retailers in high-density regions have begun adapting procurement calendars to match aquaponic farm harvest intervals. In South Korea, grocery chains added flexible sourcing contracts after trials showed 27% lower waste in aquaponic leafy greens due to shorter transport routes.

Midwestern USA meal-kit firms adjusted ingredient forecasting to mirror the harvest rhythms of tilapia and bok choy, reducing SKU mismatch by 19%. European foodservice buyers began favoring aquaponic produce after temperature-controlled delivery hubs cut spoilage incidents by 22% in 2024.
  • Flexible contracts improve farm-retail synchronization
  • Meal-kit firms align with aquaponic harvest timing
  • Chilled logistics reduce post-harvest loss

Top Countries Innovating, Operating, and Expanding Aquaponics Systems

Country Wise Analysis Of Aquaponics Market

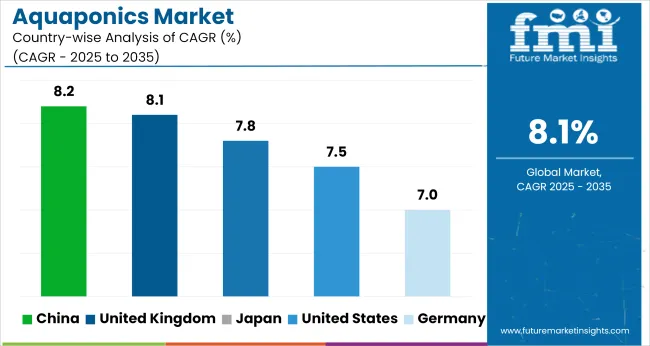
Countries CAGR (2025 to 2035)
United States 7.5%
United Kingdom 8.1%
Japan 7.8%
China 8.2%
Germany 7.0%

The aquaponics industry is projected to grow at a global CAGR of 8.1% from 2025 to 2035, though regional growth trajectories show marked variation. India, representing BRICS, is advancing at 9.6%, powered by state-funded integrated farming programs and farm startups optimizing water use in zones. China follows at 9.1%, with high-tech greenhouse expansion in inland provinces supporting closed-loop vegetable and fish production.

ASEAN nations such as Malaysia and Thailand post CAGRs around 8.5%, as rooftop gains popularity in densely populated areas and SMEs respond to premium produce demand in domestic markets. OECD economies such as the United States and Germany register slower growth at 6.4% and 6.1% respectively, limited by energy costs, zoning regulations, and longer return-on-investment cycles. This divergence highlights how emerging economies are scaling products as a land and water-efficient solution, while mature markets focus on pilot-scale integration and policy alignment.

The report covers a detailed analysis of 40+ countries, and the top five countries have been shared as a reference.

Growth Analysis of the United States Aquaponics Market

The USA aquaponics market is expected to grow at a 7.5% CAGR during the forecast period. Expansion is being led by commercial operators scaling modular systems to supply grocery chains and farm-to-fork restaurants. Federal nutrition assistance programs have begun sourcing aquaponic greens for school lunches and food banks, boosting institutional demand.

The farming zones in cities like Denver, Seattle, and Chicago have granted zoning flexibility for aquaponic structures, encouraging rooftop and indoor farm investments. Rising consumer demand for chemical-free produce in health-focused states such as California and Oregon has shifted procurement preferences of meal-kit services and CSAs toward aquaponic farms.

  • School nutrition programs are integrating aquaponic greens
  • Zoning incentives accelerate city-based aquaponic expansion
  • Meal-kit platforms source aquaponic crops for freshness benefits

China Aquaponics Market Growth Outlook

The China aquaponics market is projected to grow at 8.2% CAGR from 2025 to 2035. Deployment has expanded through government-backed research hubs and pilot farms in peri-districts, focusing on fish and leafy greens integration. Several tier-1 cities have been included in regional food safety strategies, prioritizing chemical-free produce to address contamination concerns.

Consumer shift toward clean-label vegetables, especially among middle-income households, has increased demand for traceable aquaponic crops in online grocery channels. Domestic tech firms are entering the segment with low-cost automation kits, enabling smallholders to retrofit aquaculture tanks for dual-purpose use.

  • Food safety strategies favor aquaponic adoption
  • Middle-income consumers drive clean-label vegetable demand
  • Local firms offer affordable automation tools for aquaponic upgrades

Japan Aquaponics Market Growth Analysis

The Japanese aquaponics market is anticipated to grow at a 7.8% CAGR between 2025 and 2035. Expansion has been supported by the government’s smart agriculture policy, which includes as a component in climate-resilient food production. Declining availability of farmland in mountainous and coastal areas has prompted investment in vertical aquaponic systems.

High-margin crops such as wasabi greens and shiso are being cultivated in fish-plant symbiotic systems to serve premium retail and gourmet outlets. Prefectures like Shizuoka and Nagano have launched incubation zones with funding for R&D in nutrient recovery and precision aquaculture.

  • Smart agriculture policy supports climate-resilient aquaponic methods
  • Vertical systems mitigate limited farmland in hilly regions
  • Gourmet-focused crops grown for premium restaurant demand

In-Depth Analysis of the Aquaponics Market in Germany

The German aquaponics market is estimated to grow at 7.0% CAGR during the forecast period. Growth is being supported by integration into decentralized food systems targeting carbon-neutral distribution chains. Retail co-operatives in cities like Berlin and Hamburg are prioritizing locally sourced aquaponic lettuce and herbs as part of regional food resilience strategies.

Regulatory clarity on aquaponic fish production has opened investment from municipal food banks and educational institutions. Partnerships between aquaponic startups and organic certification bodies have helped overcome previous barriers in retail certification, allowing entry into mainstream supermarket shelves.

  • Retail co-ops support aquaponic sourcing in resilience planning
  • Certification hurdles are easing through new organic protocols
  • Local governments fund aquaponic pilots for institutional supply

United Kingdom Aquaponics Market Growth Projection

The United Kingdom aquaponics market is valued at an 8.1% CAGR through 2025 to 2035. Post-Brexit agricultural reform has created openings for controlled environment systems like aquaponics, which are less reliant on imported inputs. Regeneration projects in Greater London and Manchester have incorporated aquaponic farming units to address food access disparities.

Consumer awareness campaigns around nitrate-free greens and low-carbon fish have increased footfall at retailers offering aquaponic-certified produce. The UK’s indoor agriculture grants and local council incentives have enabled mid-sized growers to scale operations near distribution hubs, ensuring a fresh, locally sourced supply for major retailers.
  • Product fits into the UK’s post-Brexit local sourcing shift
  • Indoor grants help scale farms close to population centers
  • Consumer preference grows for nitrate-free, aquaponic-certified produce

Leading Aquaponics Suppliers

Aquaponics Market Analysis By Company

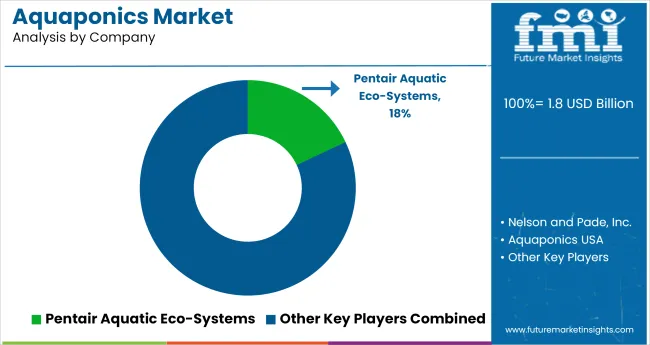
Leading players are advancing through system specialization, localized deployment, and hybrid distribution models in the market. Companies like Pentair Aquatic Eco-Systems, Nelson and Pade, Inc., and The Aquaponic Source are leveraging their engineering expertise to supply modular systems tailored to commercial farms and educational institutions.

Firms such as Aquaponics USA, Greenlife Aquaponics, and Endless Food Systems focus on residential kits and applications, often bundled with training or remote monitoring support. Regional players like Japan Aquaponics and Practical Aquaponics are driving adoption in Asia-Pacific through government-linked pilot projects and low-footprint installations.

Symbiotic Aquaponic and Stuppy Greenhouse are concentrating on school partnerships and semi-automated greenhouses in North America, where curriculum-aligned farming kits help boost STEM education. Competitive momentum is shaped by three factors: regional customization of system designs, integration with controlled environment agriculture (CEA) platforms, and tight coupling of plant-fish nutrient loops for traceability and yield stability.

Recent Aquaponics Industry News

In March 2025, Nelson and Pade, Inc. launched the new “Aquaponics 360” systems, which integrate IoT-enabled sensors and AI-driven management to optimize production and system monitoring.

Leading Players

  • Pentair Aquatic Eco-Systems
  • Nelson and Pade, Inc.
  • Aquaponics USA
  • Greenlife Aquaponics
  • The Aquaponic Source
  • Endless Food Systems
  • Japan Aquaponics
  • Stuppy Greenhouse
  • Symbiotic Aquaponic
  • Practical Aquaponics

Report Coverage and Scope Summary

Report Attributes Details
Market Size (2025) USD 1.8 billion
Projected Market Size (2035) USD 3.9 billion
CAGR (2025 to 2035) 8.1%
Base Year for Estimation 2024
Historical Period 2020 to 2024
Projections Period 2025 to 2035
Quantitative Units USD billion for value and volume in metric tons
Type Analyzed (Segment 1) Media Filled Grow Beds (MFG), Nutrient Film Technique (NFT), Deep Water Culture (DWC), and Others.
Component Analyzed (Segment 2) Bio Filter, Settling Basins, Fish Tanks, Soil-Free Plant Bed, Rearing Tanks, and Aquaponic Produce.
Equipment Analyzed (Segment 3) Pumps And Valves, Water Heaters, Fish Purge Systems, Aeration Systems, Water Quality Testing, and Others.
Application Analyzed (Segment 4) Fish, Herbs, Fruits, and Vegetables.
End Use Analyzed (Segment 5) Commercial, Home Production, and Research.
Regions Covered North America, Europe, Asia Pacific, Middle East & Africa, Latin America
Countries Covered United States, Canada, Germany, United Kingdom, France, Italy, Spain, China, Japan, South Korea, India, Australia, Brazil, Mexico, Argentina, Saudi Arabia, UAE, South Africa
Key Players Pentair Aquatic Eco-Systems, Nelson and Pade, Inc., Aquaponics USA, Greenlife Aquaponics, The Aquaponic Source, Endless Food Systems, Japan Aquaponics, Stuppy Greenhouse, Symbiotic Aquaponics, and Practical Aquaponics.
Additional Attributes Dollar sales, share by system type, equipment demand forecasts, regional adoption rates, consumer preferences for produce, cost benchmarks, and competitive positioning in commercial segments.

Key Segmentation 

By Type:

The industry is segmented into media-filled grow beds (MFG), nutrient film technique (NFT), deep water culture (DWC), and others.

By Component:

The industry is segmented into bio filters, settling basins, fish tanks, soil-free plant beds, rearing tanks, and aquaponic produce.

By Equipment:

The industry includes pumps and valves, water heaters, fish purge systems, aeration systems, water quality testing, and others.

By Application:

The industry is segmented into fish, herbs, fruits, and vegetables.

By End User:

The industry is segmented into commercial, home production, and research.

By Region:

The industry covers regions including North America, Europe, Asia Pacific, Latin America, and the Middle East & Africa.

Table of Content

  1. Executive Summary
    • Global Market Outlook
    • Demand-side Trends
    • Supply-side Trends
    • Technology Roadmap Analysis
    • Analysis and Recommendations
  2. Market Overview
    • Market Coverage/Taxonomy
    • Market Definition/Scope/Limitations
  3. Market Background
    • Market Dynamics
      • Drivers
      • Restraints
      • Opportunity
      • Trends
    • Scenario Forecast
      • Demand in Optimistic Scenario
      • Demand in Likely Scenario
      • Demand in Conservative Scenario
    • Opportunity Map Analysis
    • Product Life Cycle Analysis
    • Supply Chain Analysis
      • Supply Side Participants and their Roles
        • Producers
        • Mid-Level Participants (Traders/ Agents/ Brokers)
        • Wholesalers and Distributors
      • Value Added and Value Created at Node in the Supply Chain
      • List of Raw Material Suppliers
      • List of Existing and Potential Buyer’s
    • Investment Feasibility Matrix
    • Value Chain Analysis
      • Profit Margin Analysis
      • Wholesalers and Distributors
      • Retailers
    • PESTLE and Porter’s Analysis
    • Regulatory Landscape
      • By Key Regions
      • By Key Countries
    • Regional Parent Market Outlook
    • Production and Consumption Statistics
    • Import and Export Statistics
  4. Global Market Analysis 2020 to 2024 and Forecast, 2025 to 2035
    • Historical Market Size Value (USD Billion) & Volume (Metric tons) Analysis, 2020 to 2024
    • Current and Future Market Size Value (USD Billion) & Volume (Metric tons) Projections, 2025 to 2035
      • Y-o-Y Growth Trend Analysis
      • Absolute $ Opportunity Analysis
  5. Global Market Pricing Analysis 2020 to 2024 and Forecast 2025 to 2035
  6. Global Market Analysis 2020 to 2024 and Forecast 2025 to 2035, By Type
    • Introduction/Key Findings
    • Historical Market Size Value (USD Billion) & Volume (Metric tons) Analysis By Type, 2020 to 2024
    • Current and Future Market Size Value (USD Billion) & Volume (Metric tons) Analysis and Forecast By Type, 2025 to 2035
      • Media Filled Grow Beds (MFG)
      • Nutrient Film Technique (NFT)
      • Deep Water Culture (DWC)
      • Others
    • Y-o-Y Growth Trend Analysis By Type, 2020 to 2024
    • Absolute $ Opportunity Analysis By Type, 2025 to 2035
  7. Global Market Analysis 2020 to 2024 and Forecast 2025 to 2035, By Component
    • Introduction/Key Findings
    • Historical Market Size Value (USD Billion) & Volume (Metric tons) Analysis By Component, 2020 to 2024
    • Current and Future Market Size Value (USD Billion) & Volume (Metric tons) Analysis and Forecast By Component, 2025 to 2035
      • Bio Filter
      • Settling Basins
      • Fish tanks
      • Soil-free plant bed
      • Rearing Tanks
      • Aquaponic Produce
    • Y-o-Y Growth Trend Analysis By Component, 2020 to 2024
    • Absolute $ Opportunity Analysis By Component, 2025 to 2035
  8. Global Market Analysis 2020 to 2024 and Forecast 2025 to 2035, By Equipment
    • Introduction/Key Findings
    • Historical Market Size Value (USD Billion) & Volume (Metric tons) Analysis By Equipment, 2020 to 2024
    • Current and Future Market Size Value (USD Billion) & Volume (Metric tons) Analysis and Forecast By Equipment, 2025 to 2035
      • Pumps and Valves
      • Water Heaters
      • Fish Purge Systems
      • Aeration Systems
      • Water Quality Testing
      • Others
    • Y-o-Y Growth Trend Analysis By Equipment, 2020 to 2024
    • Absolute $ Opportunity Analysis By Equipment, 2025 to 2035
  9. Global Market Analysis 2020 to 2024 and Forecast 2025 to 2035, By Application
    • Introduction/Key Findings
    • Historical Market Size Value (USD Billion) & Volume (Metric tons) Analysis By Application, 2020 to 2024
    • Current and Future Market Size Value (USD Billion) & Volume (Metric tons) Analysis and Forecast By Application, 2025 to 2035
      • Fish
      • Herbs
      • Fruits
      • Vegetables
    • Y-o-Y Growth Trend Analysis By Application, 2020 to 2024
    • Absolute $ Opportunity Analysis By Application, 2025 to 2035
  10. Global Market Analysis 2020 to 2024 and Forecast 2025 to 2035, By End User
    • Introduction/Key Findings
    • Historical Market Size Value (USD Billion) & Volume (Metric tons) Analysis By End User, 2020 to 2024
    • Current and Future Market Size Value (USD Billion) & Volume (Metric tons) Analysis and Forecast By End User, 2025 to 2035
      • Commercial
      • Home Production
      • Research
    • Y-o-Y Growth Trend Analysis By End User, 2020 to 2024
    • Absolute $ Opportunity Analysis By End User, 2025 to 2035
  11. Global Market Analysis 2020 to 2024 and Forecast 2025 to 2035, By Region
    • Introduction
    • Historical Market Size Value (USD Billion) & Volume (Metric tons) Analysis By Region, 2020 to 2024
    • Current Market Size Value (USD Billion) & Volume (Metric tons) Analysis and Forecast By Region, 2025 to 2035
      • North America
      • Latin America
      • Western Europe
      • Eastern Europe
      • East Asia
      • South Asia & Pacific
      • Middle East and Africa
    • Market Attractiveness Analysis By Region
  12. North America Market Analysis 2020 to 2024 and Forecast 2025 to 2035, By Country
    • Historical Market Size Value (USD Billion) & Volume (Metric tons) Trend Analysis By Market Taxonomy, 2020 to 2024
    • Market Size Value (USD Billion) & Volume (Metric tons) Forecast By Market Taxonomy, 2025 to 2035
      • By Country
        • USA
        • Canada
        • Mexico
      • By Type
      • By Component
      • By Equipment
      • By Application
      • By End User
    • Market Attractiveness Analysis
      • By Country
      • By Type
      • By Component
      • By Equipment
      • By Application
      • By End User
    • Key Takeaways
  13. Latin America Market Analysis 2020 to 2024 and Forecast 2025 to 2035, By Country
    • Historical Market Size Value (USD Billion) & Volume (Metric tons) Trend Analysis By Market Taxonomy, 2020 to 2024
    • Market Size Value (USD Billion) & Volume (Metric tons) Forecast By Market Taxonomy, 2025 to 2035
      • By Country
        • Brazil
        • Argentina
        • Rest of LATAM
      • By Type
      • By Component
      • By Equipment
      • By Application
      • By End User
    • Market Attractiveness Analysis
      • By Country
      • By Type
      • By Component
      • By Equipment
      • By Application
      • By End User
    • Key Takeaways
  14. Western Europe Market Analysis 2020 to 2024 and Forecast 2025 to 2035, By Country
    • Historical Market Size Value (USD Billion) & Volume (Metric tons) Trend Analysis By Market Taxonomy, 2020 to 2024
    • Market Size Value (USD Billion) & Volume (Metric tons) Forecast By Market Taxonomy, 2025 to 2035
      • By Country
        • Germany
        • Italy
        • France
        • UK
        • Spain
        • BENELUX
        • Nordic
        • Rest of W.Europe
      • By Type
      • By Component
      • By Equipment
      • By Application
      • By End User
    • Market Attractiveness Analysis
      • By Country
      • By Type
      • By Component
      • By Equipment
      • By Application
      • By End User
    • Key Takeaways
  15. Eastern Europe Market Analysis 2020 to 2024 and Forecast 2025 to 2035, By Country
    • Historical Market Size Value (USD Billion) & Volume (Metric tons) Trend Analysis By Market Taxonomy, 2020 to 2024
    • Market Size Value (USD Billion) & Volume (Metric tons) Forecast By Market Taxonomy, 2025 to 2035
      • By Country
        • Russia
        • Hungary
        • Poland
        • Balkan & Baltics
        • Rest of E. Europe
      • By Type
      • By Component
      • By Equipment
      • By Application
      • By End User
    • Market Attractiveness Analysis
      • By Country
      • By Type
      • By Component
      • By Equipment
      • By Application
      • By End User
    • Key Takeaways
  16. East Asia Market Analysis 2020 to 2024 and Forecast 2025 to 2035, By Country
    • Historical Market Size Value (USD Billion) & Volume (Metric tons) Trend Analysis By Market Taxonomy, 2020 to 2024
    • Market Size Value (USD Billion) & Volume (Metric tons) Forecast By Market Taxonomy, 2025 to 2035
      • By Country
        • China
        • Japan
        • South Korea
      • By Type
      • By Component
      • By Equipment
      • By Application
      • By End User
    • Market Attractiveness Analysis
      • By Country
      • By Type
      • By Component
      • By Equipment
      • By Application
      • By End User
    • Key Takeaways
  17. South Asia & Pacific Market Analysis 2020 to 2024 and Forecast 2025 to 2035, By Country
    • Historical Market Size Value (USD Billion) & Volume (Metric tons) Trend Analysis By Market Taxonomy, 2020 to 2024
    • Market Size Value (USD Billion) & Volume (Metric tons) Forecast By Market Taxonomy, 2025 to 2035
      • By Country
        • India
        • Australia & New Zealand
        • ASEAN
        • Rest of SAP
      • By Type
      • By Component
      • By Equipment
      • By Application
      • By End User
    • Market Attractiveness Analysis
      • By Country
      • By Type
      • By Component
      • By Equipment
      • By Application
      • By End User
    • Key Takeaways
  18. Middle East and Africa Market Analysis 2020 to 2024 and Forecast 2025 to 2035, By Country
    • Historical Market Size Value (USD Billion) & Volume (Metric tons) Trend Analysis By Market Taxonomy, 2020 to 2024
    • Market Size Value (USD Billion) & Volume (Metric tons) Forecast By Market Taxonomy, 2025 to 2035
      • By Country
        • GCC Countries
        • Northern Africa
        • South Africa
        • Turkiye
        • Rest of MEA
      • By Type
      • By Component
      • By Equipment
      • By Application
      • By End User
    • Market Attractiveness Analysis
      • By Country
      • By Type
      • By Component
      • By Equipment
      • By Application
      • By End User
    • Key Takeaways
  19. Key Countries Market Analysis
    • USA
      • Pricing Analysis
      • Market Share Analysis, 2024
        • By Type
        • By Component
        • By Equipment
        • By Application
        • By End User
    • Canada
      • Pricing Analysis
      • Market Share Analysis, 2024
        • By Type
        • By Component
        • By Equipment
        • By Application
        • By End User
    • Brazil
      • Pricing Analysis
      • Market Share Analysis, 2024
        • By Type
        • By Component
        • By Equipment
        • By Application
        • By End User
    • Mexico
      • Pricing Analysis
      • Market Share Analysis, 2024
        • By Type
        • By Component
        • By Equipment
        • By Application
        • By End User
    • Argentina
      • Pricing Analysis
      • Market Share Analysis, 2024
        • By Type
        • By Component
        • By Equipment
        • By Application
        • By End User
  20. Market Structure Analysis
    • Competition Dashboard
    • Competition Benchmarking
    • Market Share Analysis of Top Players
      • By Regional
      • By Type
      • By Component
      • By Equipment
      • By Application
      • By End User
  21. Competition Analysis
    • Competition Deep Dive
      • Pentair Aquatic Eco-Systems
        • Overview
        • Product Portfolio
        • Profitability by Market Segments (Product/Age /Sales Channel/Region)
        • Sales Footprint
        • Strategy Overview
          • Marketing Strategy
          • Product Strategy
          • Channel Strategy
      • Nelson and Pade, Inc.
        • Overview
        • Product Portfolio
        • Profitability by Market Segments (Product/Age /Sales Channel/Region)
        • Sales Footprint
        • Strategy Overview
          • Marketing Strategy
          • Product Strategy
          • Channel Strategy
      • USA
        • Overview
        • Product Portfolio
        • Profitability by Market Segments (Product/Age /Sales Channel/Region)
        • Sales Footprint
        • Strategy Overview
          • Marketing Strategy
          • Product Strategy
          • Channel Strategy
      • Greenlife Aquaponics
        • Overview
        • Product Portfolio
        • Profitability by Market Segments (Product/Age /Sales Channel/Region)
        • Sales Footprint
        • Strategy Overview
          • Marketing Strategy
          • Product Strategy
          • Channel Strategy
      • The Aquaponic Source
        • Overview
        • Product Portfolio
        • Profitability by Market Segments (Product/Age /Sales Channel/Region)
        • Sales Footprint
        • Strategy Overview
          • Marketing Strategy
          • Product Strategy
          • Channel Strategy
      • Endless Food Systems
        • Overview
        • Product Portfolio
        • Profitability by Market Segments (Product/Age /Sales Channel/Region)
        • Sales Footprint
        • Strategy Overview
          • Marketing Strategy
          • Product Strategy
          • Channel Strategy
      • Japan Aquaponics
        • Overview
        • Product Portfolio
        • Profitability by Market Segments (Product/Age /Sales Channel/Region)
        • Sales Footprint
        • Strategy Overview
          • Marketing Strategy
          • Product Strategy
          • Channel Strategy
      • Stuppy Greenhouse
        • Overview
        • Product Portfolio
        • Profitability by Market Segments (Product/Age /Sales Channel/Region)
        • Sales Footprint
        • Strategy Overview
          • Marketing Strategy
          • Product Strategy
          • Channel Strategy
      • Symbiotic Aquaponic
        • Overview
        • Product Portfolio
        • Profitability by Market Segments (Product/Age /Sales Channel/Region)
        • Sales Footprint
        • Strategy Overview
          • Marketing Strategy
          • Product Strategy
          • Channel Strategy
      • Practical Aquaponics
        • Overview
        • Product Portfolio
        • Profitability by Market Segments (Product/Age /Sales Channel/Region)
        • Sales Footprint
        • Strategy Overview
          • Marketing Strategy
          • Product Strategy
          • Channel Strategy
  22. Assumptions & Acronyms Used
  23. Research Methodology

List of Tables

  • Table 1: Global Market Value (USD Billion) Forecast by Region, 2020-2035
  • Table 2: Global Market Volume (Metric tons) Forecast by Region, 2020-2035
  • Table 3: Global Market Value (USD Billion) Forecast by Type, 2020-2035
  • Table 4: Global Market Volume (Metric tons) Forecast by Type, 2020-2035
  • Table 5: Global Market Value (USD Billion) Forecast by Component, 2020-2035
  • Table 6: Global Market Volume (Metric tons) Forecast by Component, 2020-2035
  • Table 7: Global Market Value (USD Billion) Forecast by Equipment, 2020-2035
  • Table 8: Global Market Volume (Metric tons) Forecast by Equipment, 2020-2035
  • Table 9: Global Market Value (USD Billion) Forecast by Application, 2020-2035
  • Table 10: Global Market Volume (Metric tons) Forecast by Application, 2020-2035
  • Table 11: Global Market Value (USD Billion) Forecast by End User, 2020-2035
  • Table 12: Global Market Volume (Metric tons) Forecast by End User, 2020-2035
  • Table 13: North America Market Value (USD Billion) Forecast by Country, 2020-2035
  • Table 14: North America Market Volume (Metric tons) Forecast by Country, 2020-2035
  • Table 15: North America Market Value (USD Billion) Forecast by Type, 2020-2035
  • Table 16: North America Market Volume (Metric tons) Forecast by Type, 2020-2035
  • Table 17: North America Market Value (USD Billion) Forecast by Component, 2020-2035
  • Table 18: North America Market Volume (Metric tons) Forecast by Component, 2020-2035
  • Table 19: North America Market Value (USD Billion) Forecast by Equipment, 2020-2035
  • Table 20: North America Market Volume (Metric tons) Forecast by Equipment, 2020-2035
  • Table 21: North America Market Value (USD Billion) Forecast by Application, 2020-2035
  • Table 22: North America Market Volume (Metric tons) Forecast by Application, 2020-2035
  • Table 23: North America Market Value (USD Billion) Forecast by End User, 2020-2035
  • Table 24: North America Market Volume (Metric tons) Forecast by End User, 2020-2035
  • Table 25: Latin America Market Value (USD Billion) Forecast by Country, 2020-2035
  • Table 26: Latin America Market Volume (Metric tons) Forecast by Country, 2020-2035
  • Table 27: Latin America Market Value (USD Billion) Forecast by Type, 2020-2035
  • Table 28: Latin America Market Volume (Metric tons) Forecast by Type, 2020-2035
  • Table 29: Latin America Market Value (USD Billion) Forecast by Component, 2020-2035
  • Table 30: Latin America Market Volume (Metric tons) Forecast by Component, 2020-2035
  • Table 31: Latin America Market Value (USD Billion) Forecast by Equipment, 2020-2035
  • Table 32: Latin America Market Volume (Metric tons) Forecast by Equipment, 2020-2035
  • Table 33: Latin America Market Value (USD Billion) Forecast by Application, 2020-2035
  • Table 34: Latin America Market Volume (Metric tons) Forecast by Application, 2020-2035
  • Table 35: Latin America Market Value (USD Billion) Forecast by End User, 2020-2035
  • Table 36: Latin America Market Volume (Metric tons) Forecast by End User, 2020-2035
  • Table 37: Western Europe Market Value (USD Billion) Forecast by Country, 2020-2035
  • Table 38: Western Europe Market Volume (Metric tons) Forecast by Country, 2020-2035
  • Table 39: Western Europe Market Value (USD Billion) Forecast by Type, 2020-2035
  • Table 40: Western Europe Market Volume (Metric tons) Forecast by Type, 2020-2035
  • Table 41: Western Europe Market Value (USD Billion) Forecast by Component, 2020-2035
  • Table 42: Western Europe Market Volume (Metric tons) Forecast by Component, 2020-2035
  • Table 43: Western Europe Market Value (USD Billion) Forecast by Equipment, 2020-2035
  • Table 44: Western Europe Market Volume (Metric tons) Forecast by Equipment, 2020-2035
  • Table 45: Western Europe Market Value (USD Billion) Forecast by Application, 2020-2035
  • Table 46: Western Europe Market Volume (Metric tons) Forecast by Application, 2020-2035
  • Table 47: Western Europe Market Value (USD Billion) Forecast by End User, 2020-2035
  • Table 48: Western Europe Market Volume (Metric tons) Forecast by End User, 2020-2035
  • Table 49: Eastern Europe Market Value (USD Billion) Forecast by Country, 2020-2035
  • Table 50: Eastern Europe Market Volume (Metric tons) Forecast by Country, 2020-2035
  • Table 51: Eastern Europe Market Value (USD Billion) Forecast by Type, 2020-2035
  • Table 52: Eastern Europe Market Volume (Metric tons) Forecast by Type, 2020-2035
  • Table 53: Eastern Europe Market Value (USD Billion) Forecast by Component, 2020-2035
  • Table 54: Eastern Europe Market Volume (Metric tons) Forecast by Component, 2020-2035
  • Table 55: Eastern Europe Market Value (USD Billion) Forecast by Equipment, 2020-2035
  • Table 56: Eastern Europe Market Volume (Metric tons) Forecast by Equipment, 2020-2035
  • Table 57: Eastern Europe Market Value (USD Billion) Forecast by Application, 2020-2035
  • Table 58: Eastern Europe Market Volume (Metric tons) Forecast by Application, 2020-2035
  • Table 59: Eastern Europe Market Value (USD Billion) Forecast by End User, 2020-2035
  • Table 60: Eastern Europe Market Volume (Metric tons) Forecast by End User, 2020-2035
  • Table 61: East Asia Market Value (USD Billion) Forecast by Country, 2020-2035
  • Table 62: East Asia Market Volume (Metric tons) Forecast by Country, 2020-2035
  • Table 63: East Asia Market Value (USD Billion) Forecast by Type, 2020-2035
  • Table 64: East Asia Market Volume (Metric tons) Forecast by Type, 2020-2035
  • Table 65: East Asia Market Value (USD Billion) Forecast by Component, 2020-2035
  • Table 66: East Asia Market Volume (Metric tons) Forecast by Component, 2020-2035
  • Table 67: East Asia Market Value (USD Billion) Forecast by Equipment, 2020-2035
  • Table 68: East Asia Market Volume (Metric tons) Forecast by Equipment, 2020-2035
  • Table 69: East Asia Market Value (USD Billion) Forecast by Application, 2020-2035
  • Table 70: East Asia Market Volume (Metric tons) Forecast by Application, 2020-2035
  • Table 71: East Asia Market Value (USD Billion) Forecast by End User, 2020-2035
  • Table 72: East Asia Market Volume (Metric tons) Forecast by End User, 2020-2035
  • Table 73: South Asia & Pacific Market Value (USD Billion) Forecast by Country, 2020-2035
  • Table 74: South Asia & Pacific Market Volume (Metric tons) Forecast by Country, 2020-2035
  • Table 75: South Asia & Pacific Market Value (USD Billion) Forecast by Type, 2020-2035
  • Table 76: South Asia & Pacific Market Volume (Metric tons) Forecast by Type, 2020-2035
  • Table 77: South Asia & Pacific Market Value (USD Billion) Forecast by Component, 2020-2035
  • Table 78: South Asia & Pacific Market Volume (Metric tons) Forecast by Component, 2020-2035
  • Table 79: South Asia & Pacific Market Value (USD Billion) Forecast by Equipment, 2020-2035
  • Table 80: South Asia & Pacific Market Volume (Metric tons) Forecast by Equipment, 2020-2035
  • Table 81: South Asia & Pacific Market Value (USD Billion) Forecast by Application, 2020-2035
  • Table 82: South Asia & Pacific Market Volume (Metric tons) Forecast by Application, 2020-2035
  • Table 83: South Asia & Pacific Market Value (USD Billion) Forecast by End User, 2020-2035
  • Table 84: South Asia & Pacific Market Volume (Metric tons) Forecast by End User, 2020-2035
  • Table 85: Middle East and Africa Market Value (USD Billion) Forecast by Country, 2020-2035
  • Table 86: Middle East and Africa Market Volume (Metric tons) Forecast by Country, 2020-2035
  • Table 87: Middle East and Africa Market Value (USD Billion) Forecast by Type, 2020-2035
  • Table 88: Middle East and Africa Market Volume (Metric tons) Forecast by Type, 2020-2035
  • Table 89: Middle East and Africa Market Value (USD Billion) Forecast by Component, 2020-2035
  • Table 90: Middle East and Africa Market Volume (Metric tons) Forecast by Component, 2020-2035
  • Table 91: Middle East and Africa Market Value (USD Billion) Forecast by Equipment, 2020-2035
  • Table 92: Middle East and Africa Market Volume (Metric tons) Forecast by Equipment, 2020-2035
  • Table 93: Middle East and Africa Market Value (USD Billion) Forecast by Application, 2020-2035
  • Table 94: Middle East and Africa Market Volume (Metric tons) Forecast by Application, 2020-2035
  • Table 95: Middle East and Africa Market Value (USD Billion) Forecast by End User, 2020-2035
  • Table 96: Middle East and Africa Market Volume (Metric tons) Forecast by End User, 2020-2035

List of Figures

  • Figure 1: Global Market Volume (Metric tons) Forecast 2020-2035
  • Figure 2: Global Market Pricing Analysis
  • Figure 3: Global Market Value (USD Billion) Forecast 2020-2035
  • Figure 4: Global Market Value Share and BPS Analysis by Type, 2025 and 2035
  • Figure 5: Global Market Y-o-Y Growth Comparison by Type, 2025-2035
  • Figure 6: Global Market Attractiveness Analysis by Type
  • Figure 7: Global Market Value Share and BPS Analysis by Component, 2025 and 2035
  • Figure 8: Global Market Y-o-Y Growth Comparison by Component, 2025-2035
  • Figure 9: Global Market Attractiveness Analysis by Component
  • Figure 10: Global Market Value Share and BPS Analysis by Equipment, 2025 and 2035
  • Figure 11: Global Market Y-o-Y Growth Comparison by Equipment, 2025-2035
  • Figure 12: Global Market Attractiveness Analysis by Equipment
  • Figure 13: Global Market Value Share and BPS Analysis by Application, 2025 and 2035
  • Figure 14: Global Market Y-o-Y Growth Comparison by Application, 2025-2035
  • Figure 15: Global Market Attractiveness Analysis by Application
  • Figure 16: Global Market Value Share and BPS Analysis by End User, 2025 and 2035
  • Figure 17: Global Market Y-o-Y Growth Comparison by End User, 2025-2035
  • Figure 18: Global Market Attractiveness Analysis by End User
  • Figure 19: Global Market Value (USD Billion) Share and BPS Analysis by Region, 2025 and 2035
  • Figure 20: Global Market Y-o-Y Growth Comparison by Region, 2025-2035
  • Figure 21: Global Market Attractiveness Analysis by Region
  • Figure 22: North America Market Incremental $ Opportunity, 2025-2035
  • Figure 23: Latin America Market Incremental $ Opportunity, 2025-2035
  • Figure 24: Western Europe Market Incremental $ Opportunity, 2025-2035
  • Figure 25: Eastern Europe Market Incremental $ Opportunity, 2025-2035
  • Figure 26: East Asia Market Incremental $ Opportunity, 2025-2035
  • Figure 27: South Asia & Pacific Market Incremental $ Opportunity, 2025-2035
  • Figure 28: Middle East and Africa Market Incremental $ Opportunity, 2025-2035
  • Figure 29: North America Market Value Share and BPS Analysis by Country, 2025 and 2035
  • Figure 30: North America Market Value Share and BPS Analysis by Type, 2025 and 2035
  • Figure 31: North America Market Y-o-Y Growth Comparison by Type, 2025-2035
  • Figure 32: North America Market Attractiveness Analysis by Type
  • Figure 33: North America Market Value Share and BPS Analysis by Component, 2025 and 2035
  • Figure 34: North America Market Y-o-Y Growth Comparison by Component, 2025-2035
  • Figure 35: North America Market Attractiveness Analysis by Component
  • Figure 36: North America Market Value Share and BPS Analysis by Equipment, 2025 and 2035
  • Figure 37: North America Market Y-o-Y Growth Comparison by Equipment, 2025-2035
  • Figure 38: North America Market Attractiveness Analysis by Equipment
  • Figure 39: North America Market Value Share and BPS Analysis by Application, 2025 and 2035
  • Figure 40: North America Market Y-o-Y Growth Comparison by Application, 2025-2035
  • Figure 41: North America Market Attractiveness Analysis by Application
  • Figure 42: North America Market Value Share and BPS Analysis by End User, 2025 and 2035
  • Figure 43: North America Market Y-o-Y Growth Comparison by End User, 2025-2035
  • Figure 44: North America Market Attractiveness Analysis by End User
  • Figure 45: Latin America Market Value Share and BPS Analysis by Country, 2025 and 2035
  • Figure 46: Latin America Market Value Share and BPS Analysis by Type, 2025 and 2035
  • Figure 47: Latin America Market Y-o-Y Growth Comparison by Type, 2025-2035
  • Figure 48: Latin America Market Attractiveness Analysis by Type
  • Figure 49: Latin America Market Value Share and BPS Analysis by Component, 2025 and 2035
  • Figure 50: Latin America Market Y-o-Y Growth Comparison by Component, 2025-2035
  • Figure 51: Latin America Market Attractiveness Analysis by Component
  • Figure 52: Latin America Market Value Share and BPS Analysis by Equipment, 2025 and 2035
  • Figure 53: Latin America Market Y-o-Y Growth Comparison by Equipment, 2025-2035
  • Figure 54: Latin America Market Attractiveness Analysis by Equipment
  • Figure 55: Latin America Market Value Share and BPS Analysis by Application, 2025 and 2035
  • Figure 56: Latin America Market Y-o-Y Growth Comparison by Application, 2025-2035
  • Figure 57: Latin America Market Attractiveness Analysis by Application
  • Figure 58: Latin America Market Value Share and BPS Analysis by End User, 2025 and 2035
  • Figure 59: Latin America Market Y-o-Y Growth Comparison by End User, 2025-2035
  • Figure 60: Latin America Market Attractiveness Analysis by End User
  • Figure 61: Western Europe Market Value Share and BPS Analysis by Country, 2025 and 2035
  • Figure 62: Western Europe Market Value Share and BPS Analysis by Type, 2025 and 2035
  • Figure 63: Western Europe Market Y-o-Y Growth Comparison by Type, 2025-2035
  • Figure 64: Western Europe Market Attractiveness Analysis by Type
  • Figure 65: Western Europe Market Value Share and BPS Analysis by Component, 2025 and 2035
  • Figure 66: Western Europe Market Y-o-Y Growth Comparison by Component, 2025-2035
  • Figure 67: Western Europe Market Attractiveness Analysis by Component
  • Figure 68: Western Europe Market Value Share and BPS Analysis by Equipment, 2025 and 2035
  • Figure 69: Western Europe Market Y-o-Y Growth Comparison by Equipment, 2025-2035
  • Figure 70: Western Europe Market Attractiveness Analysis by Equipment
  • Figure 71: Western Europe Market Value Share and BPS Analysis by Application, 2025 and 2035
  • Figure 72: Western Europe Market Y-o-Y Growth Comparison by Application, 2025-2035
  • Figure 73: Western Europe Market Attractiveness Analysis by Application
  • Figure 74: Western Europe Market Value Share and BPS Analysis by End User, 2025 and 2035
  • Figure 75: Western Europe Market Y-o-Y Growth Comparison by End User, 2025-2035
  • Figure 76: Western Europe Market Attractiveness Analysis by End User
  • Figure 77: Eastern Europe Market Value Share and BPS Analysis by Country, 2025 and 2035
  • Figure 78: Eastern Europe Market Value Share and BPS Analysis by Type, 2025 and 2035
  • Figure 79: Eastern Europe Market Y-o-Y Growth Comparison by Type, 2025-2035
  • Figure 80: Eastern Europe Market Attractiveness Analysis by Type
  • Figure 81: Eastern Europe Market Value Share and BPS Analysis by Component, 2025 and 2035
  • Figure 82: Eastern Europe Market Y-o-Y Growth Comparison by Component, 2025-2035
  • Figure 83: Eastern Europe Market Attractiveness Analysis by Component
  • Figure 84: Eastern Europe Market Value Share and BPS Analysis by Equipment, 2025 and 2035
  • Figure 85: Eastern Europe Market Y-o-Y Growth Comparison by Equipment, 2025-2035
  • Figure 86: Eastern Europe Market Attractiveness Analysis by Equipment
  • Figure 87: Eastern Europe Market Value Share and BPS Analysis by Application, 2025 and 2035
  • Figure 88: Eastern Europe Market Y-o-Y Growth Comparison by Application, 2025-2035
  • Figure 89: Eastern Europe Market Attractiveness Analysis by Application
  • Figure 90: Eastern Europe Market Value Share and BPS Analysis by End User, 2025 and 2035
  • Figure 91: Eastern Europe Market Y-o-Y Growth Comparison by End User, 2025-2035
  • Figure 92: Eastern Europe Market Attractiveness Analysis by End User
  • Figure 93: East Asia Market Value Share and BPS Analysis by Country, 2025 and 2035
  • Figure 94: East Asia Market Value Share and BPS Analysis by Type, 2025 and 2035
  • Figure 95: East Asia Market Y-o-Y Growth Comparison by Type, 2025-2035
  • Figure 96: East Asia Market Attractiveness Analysis by Type
  • Figure 97: East Asia Market Value Share and BPS Analysis by Component, 2025 and 2035
  • Figure 98: East Asia Market Y-o-Y Growth Comparison by Component, 2025-2035
  • Figure 99: East Asia Market Attractiveness Analysis by Component
  • Figure 100: East Asia Market Value Share and BPS Analysis by Equipment, 2025 and 2035
  • Figure 101: East Asia Market Y-o-Y Growth Comparison by Equipment, 2025-2035
  • Figure 102: East Asia Market Attractiveness Analysis by Equipment
  • Figure 103: East Asia Market Value Share and BPS Analysis by Application, 2025 and 2035
  • Figure 104: East Asia Market Y-o-Y Growth Comparison by Application, 2025-2035
  • Figure 105: East Asia Market Attractiveness Analysis by Application
  • Figure 106: East Asia Market Value Share and BPS Analysis by End User, 2025 and 2035
  • Figure 107: East Asia Market Y-o-Y Growth Comparison by End User, 2025-2035
  • Figure 108: East Asia Market Attractiveness Analysis by End User
  • Figure 109: South Asia & Pacific Market Value Share and BPS Analysis by Country, 2025 and 2035
  • Figure 110: South Asia & Pacific Market Value Share and BPS Analysis by Type, 2025 and 2035
  • Figure 111: South Asia & Pacific Market Y-o-Y Growth Comparison by Type, 2025-2035
  • Figure 112: South Asia & Pacific Market Attractiveness Analysis by Type
  • Figure 113: South Asia & Pacific Market Value Share and BPS Analysis by Component, 2025 and 2035
  • Figure 114: South Asia & Pacific Market Y-o-Y Growth Comparison by Component, 2025-2035
  • Figure 115: South Asia & Pacific Market Attractiveness Analysis by Component
  • Figure 116: South Asia & Pacific Market Value Share and BPS Analysis by Equipment, 2025 and 2035
  • Figure 117: South Asia & Pacific Market Y-o-Y Growth Comparison by Equipment, 2025-2035
  • Figure 118: South Asia & Pacific Market Attractiveness Analysis by Equipment
  • Figure 119: South Asia & Pacific Market Value Share and BPS Analysis by Application, 2025 and 2035
  • Figure 120: South Asia & Pacific Market Y-o-Y Growth Comparison by Application, 2025-2035
  • Figure 121: South Asia & Pacific Market Attractiveness Analysis by Application
  • Figure 122: South Asia & Pacific Market Value Share and BPS Analysis by End User, 2025 and 2035
  • Figure 123: South Asia & Pacific Market Y-o-Y Growth Comparison by End User, 2025-2035
  • Figure 124: South Asia & Pacific Market Attractiveness Analysis by End User
  • Figure 125: Middle East and Africa Market Value Share and BPS Analysis by Country, 2025 and 2035
  • Figure 126: Middle East and Africa Market Value Share and BPS Analysis by Type, 2025 and 2035
  • Figure 127: Middle East and Africa Market Y-o-Y Growth Comparison by Type, 2025-2035
  • Figure 128: Middle East and Africa Market Attractiveness Analysis by Type
  • Figure 129: Middle East and Africa Market Value Share and BPS Analysis by Component, 2025 and 2035
  • Figure 130: Middle East and Africa Market Y-o-Y Growth Comparison by Component, 2025-2035
  • Figure 131: Middle East and Africa Market Attractiveness Analysis by Component
  • Figure 132: Middle East and Africa Market Value Share and BPS Analysis by Equipment, 2025 and 2035
  • Figure 133: Middle East and Africa Market Y-o-Y Growth Comparison by Equipment, 2025-2035
  • Figure 134: Middle East and Africa Market Attractiveness Analysis by Equipment
  • Figure 135: Middle East and Africa Market Value Share and BPS Analysis by Application, 2025 and 2035
  • Figure 136: Middle East and Africa Market Y-o-Y Growth Comparison by Application, 2025-2035
  • Figure 137: Middle East and Africa Market Attractiveness Analysis by Application
  • Figure 138: Middle East and Africa Market Value Share and BPS Analysis by End User, 2025 and 2035
  • Figure 139: Middle East and Africa Market Y-o-Y Growth Comparison by End User, 2025-2035
  • Figure 140: Middle East and Africa Market Attractiveness Analysis by End User
  • Figure 141: Global Market - Tier Structure Analysis
  • Figure 142: Global Market - Company Share Analysis

Frequently Asked Questions

What is the estimated market size of the aquaponics industry in 2025?

The industry is valued at USD 1.8 billion in 2025.

What is the projected industry size of the aquaponics industry by 2035?

It is forecasted to reach USD 3.9 billion by 2035.

What is the expected CAGR for the aquaponics industry between 2025 and 2035?

The industry is anticipated to grow at a CAGR of 8.1% during this period.

Which segment is expected to lead the aquaponics market in 2025?

Commercials are projected to lead the market with a 54% share in 2025.

Which region is expected to witness the highest growth in the aquaponics market?

Asia Pacific, particularly China, is expected to be the key growth region with a projected growth rate of 8.2%.

Future Market Insights

Aquaponics Market