Aquatic Plant-Sourced Retinoids Market Size and Share Forecast Outlook 2025 to 2035

The global Aquatic Plant-Sourced Retinoids Market is expected to record a valuation of USD 1,250.3 million in 2025 and USD 4,153.1 million in 2035, with an increase of USD 2,902.8 million, which equals a growth of 193% over the decade. The overall expansion represents a CAGR of 12.8% and more than a 3X increase in market size.
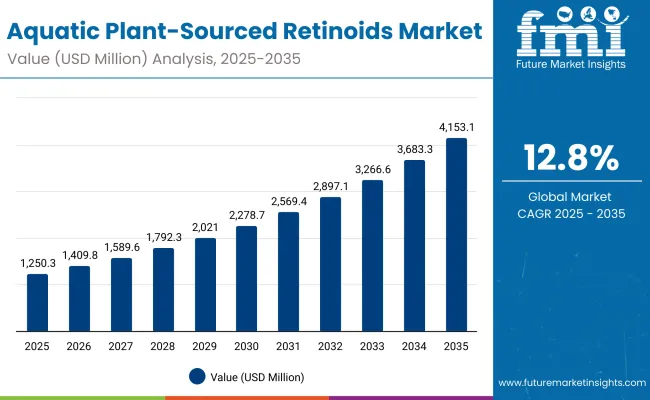
Quick Stats for Global Aquatic Plant-Sourced Retinoids Market

  • Global Market Value (2025): USD 1,250.3 million
  • Global Market Forecast Value (2035): USD 4,153.1 million
  • Global Market Forecast CAGR: 12.8%
  • Leading Segment in Global Market in 2025: Anti-aging & wrinkle repair (56.6%)
  • Key Growth Regions in the Global Market: North America, Asia-Pacific, Europe
  • Top Key Players in Global Market: Algatech, Codif, Greentech, Marinova, BASF, Croda, Seppic, Ashland, DSM-Firmenich, Givaudan

Aquatic Plant Sourced Retinoids Market

Global Aquatic Plant-SourcedRetinoids Market Key Takeaways

Metric Value
Global Aquatic Plant-Sourced Retinoids Market Estimated Value in (2025E) USD 1,250.3 million
Global Aquatic Plant-Sourced Retinoids Market Forecast Value in (2035F) USD 4,153.1 million
Forecast CAGR (2025 to 2035) 12.8%

During the first five-year period from 2025 to 2030, the market increases from USD 1,250.3 million to USD 2,278.7 million, adding USD 1,028.4 million, which accounts for 35% of the total decade growth. This phase records steady adoption in premium skincare serums, dermocosmetic creams, and spa-based anti-aging formulations, driven by the need for marine-derived actives with higher efficacy and natural positioning. Anti-aging & wrinkle repair dominates this period as it caters to over 56% of consumers seeking functional retinoid alternatives sourced from marine and freshwater ecosystems.

The second half from 2030 to 2035 contributes USD 1,874.4 million, equal to 65% of total growth, as the market jumps from USD 2,278.7 million to USD 4,153.1 million. This acceleration is powered by biotech-driven marine retinoid innovations, vegan-certified formulations, and rapid expansion of e-commerce and spa dermatology clinics as trusted channels.

Brightening, hydration, and cellular renewal functions grow strongly in this period as consumers diversify their skincare needs beyond anti-aging. Marine biotech and clean-label claims expand to capture premium positioning, while microalgae-engineered retinoids attract biotech partnerships and scale-up investments.

From 2020 to 2024, the global Aquatic Plant-Sourced Retinoids Market grew from an estimated USD ~820 million to USD 1,200 million, driven by marine algae-derived retinoid launches and initial positioning in anti-aging skincare. During this period, the competitive landscape was dominated by ingredient manufacturers controlling nearly 80% of revenue, with leaders such as Algatech, Codif, and Marinova focusing on marine-sourced active extracts and retinoid-alternative molecules for anti-aging and brightening.

Competitive differentiation relied on purity levels, biotech innovation, and regulatory approvals for natural/organic positioning, while downstream skincare brands leveraged these inputs in premium lines. Direct-to-consumer distribution was minimal, with pharmacies and spas driving early traction.

Demand for aquatic plant-sourced retinoids will expand to USD 1,250.3 million in 2025, and the revenue mix will shift as vegan, clean-label, and marine biotech-certified claims grow to over 50% share. Traditional marine algae leaders face rising competition from microalgae biotech firms and synthetic biology players offering engineered retinoids with enhanced stability and potency.

Major global players such as BASF, Croda, and DSM-Firmenich are pivoting to bioengineered formulations, AI-driven molecule optimization, and marine fermentation platforms to retain relevance. Emerging entrants specializing in freshwater plant extraction, sustainability certifications, and AR/VR-enabled consumer engagement are gaining share. The competitive advantage is moving away from raw sourcing innovation alone to ecosystem strength, brand partnerships, and regulatory trust-building.

Why the Global Aquatic Plant-Sourced Retinoids Market is Growing?

Advances in marine biotechnology and microalgae engineering have improved extraction efficiency and molecule stability, allowing for safer, natural alternatives to synthetic retinoids. Marine algae-derived retinoids dominate due to their high bioactivity and consumer trust in marine-origin actives. Anti-aging & wrinkle repair has gained popularity due to its scientifically validated efficacy in reducing fine lines and skin damage while offering a natural label.

The rise of marine biotech-certified formulations has contributed to premium positioning and market acceleration, with consumers associating marine actives with luxury and purity. Industries such as skincare, dermocosmetics, and spa-based treatments are driving demand for aquatic retinoid solutions that can integrate seamlessly into serums, creams, and professional-grade ampoules.

Expansion of e-commerce platforms, clean-label consumer preferences, and vegan positioning has fueled market growth. Innovations in microalgae bioengineering and sustainable harvesting practices are expected to open new application areas. Segment growth is expected to be led by marine algae-derived retinoids in source, anti-aging in function, and serums in product type, due to their precision targeting, higher consumer trust, and adaptability across skincare routines.

Segmental Analysis

The market is segmented by source, function, product type, channel, claim, and region. Sources include marine algae-derived retinoids, freshwater plant extracts, and microalgae engineered retinoids, highlighting the sustainability and biotech focus of product pipelines. Functions cover anti-aging & wrinkle repair, brightening, cellular renewal, and hydration, reflecting diverse skincare benefits.

Product types include serums, creams/lotions, masks, and ampoules, addressing different consumer preferences and professional use. Channels span e-commerce, pharmacies, specialty marine-based beauty retail, and premium spas/dermatology clinics. Claims emphasize marine biotech, natural/organic, vegan, and clean-label, aligning with consumer demand for transparency and certification.
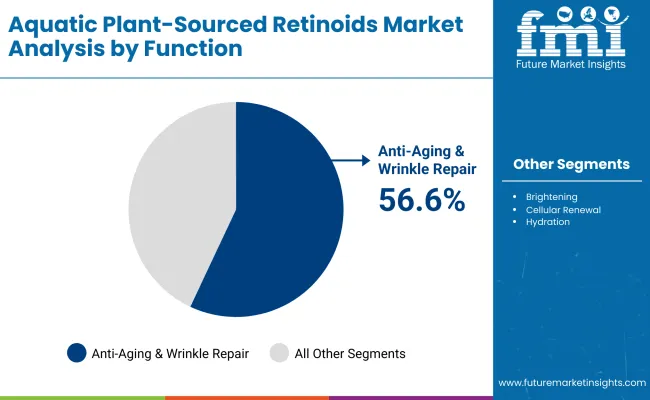
Insights into the Function Segment with Anti-aging & Wrinkle Repair Leading in Market Share

Aquatic Plant Sourced Retinoids Market By Function

Function Value Share % 2025
Anti-aging & wrinkle repair 56.6%
Others 43.4%

The anti-aging & wrinkle repair segment is projected to contribute USD 707.1 million of global market revenue in 2025, maintaining its lead as the dominant function. This is driven by the growing consumer demand for effective yet natural anti-aging solutions, especially among aging populations in North America, Europe, and Japan. The segment’s growth is also supported by clinical validation of marine retinoid actives, positioning them as natural substitutes to traditional retinoids without the harsh side effects.
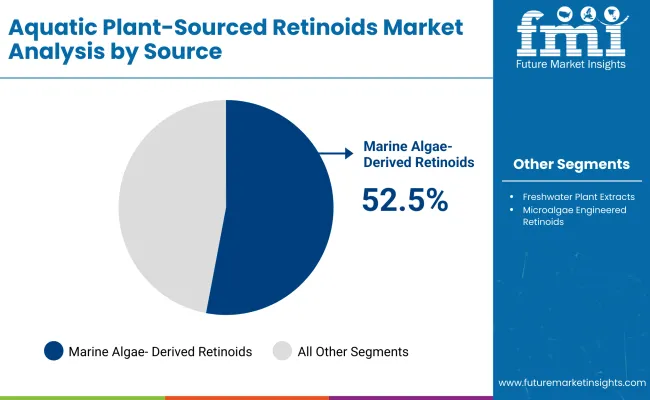
Insights into the Source Segment with Marine Algae-Derived Retinoids Dominating the Demand

Aquatic Plant Sourced Retinoids Market By Source

Source Value Share % 2025
Marine algae-derived retinoids 52.5%
Others 47.5%

The marine algae-derived segment is forecasted to hold USD 656.6 million in 2025, led by its broad application in both mass-market and premium skincare ranges. These retinoids are favored for their stability, high bioavailability, and association with marine purity, making them ideal for luxury skincare and dermocosmetics. Their scalability and regulatory acceptance have facilitated widespread adoption across global beauty brands.
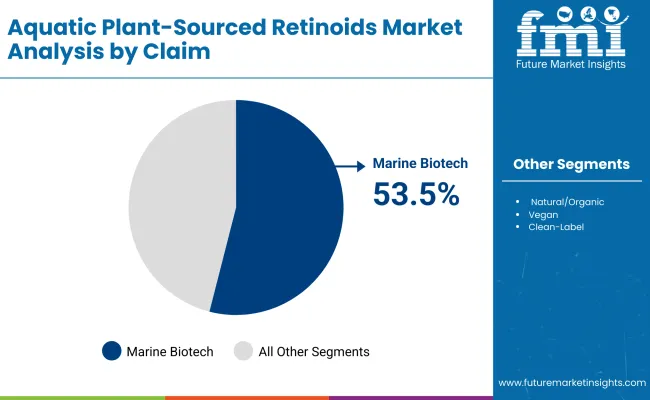
Insights into the Claim Segment with Marine Biotech Leading in Premium Adoption

Aquatic Plant Sourced Retinoids Market By Claim

Claim Value Share % 2025
Marine biotech 53.5%
Others 46.5%

The marine biotech segment is projected to reach USD 669.7 million in 2025, establishing it as the leading claim type. Its dominance is supported by premium product positioning, biotech certification, and brand storytelling that resonates with conscious consumers. This segment benefits from collaborations between marine research institutes, biotech companies, and global cosmetics brands, which provide both credibility and innovation pipelines.

What are the Drivers, Restraints, and Key Trends of the Global Aquatic Plant-Sourced Retinoids Market?

Key Drivers

Rising Consumer Preference for Retinoid Alternatives with Lower Irritation Risk

One of the strongest growth drivers for the global aquatic plant-sourced retinoids market is the shift away from synthetic retinoids like retinol and tretinoin, which are widely associated with side effects such as skin peeling, redness, and increased sensitivity to sunlight. Consumers - especially those with sensitive skin or looking for preventative anti-aging products - are actively seeking natural, marine-derived alternatives that deliver the same benefits with fewer side effects.

Aquatic retinoids, derived from marine algae and microalgae bioengineering, are positioned as gentler yet effective solutions, which makes them attractive to the rapidly growing base of younger consumers (Millennials and Gen Z) who want preventive skincare but are wary of irritation risks. This consumer-driven safety perception is boosting adoption not only in direct-to-consumer skincare brands but also in dermatology clinics and premium spas, where professional-grade aquatic retinoid treatments are gaining ground.

Expansion of Biotech and Marine-Based Partnerships Driving Product Innovation

Another major driver is the increasing collaboration between biotech firms, marine research institutes, and global cosmetics manufacturers. Leading companies like Algatech, Codif, and Marinova are investing in microalgae bioengineering, fermentation processes, and sustainable harvesting practices to develop next-generation aquatic retinoids with enhanced stability, potency, and scalability.

These innovations are moving beyond simple extraction to engineered molecules that can provide multi-functional benefits such as anti-aging, brightening, and hydration. The involvement of global leaders such as BASF, Croda, and DSM-Firmenich ensures robust commercialization pathways and integration into established beauty portfolios. This synergy between biotech-driven innovation and established beauty brands accelerates market expansion and creates a pipeline of differentiated, science-backed ingredients that reinforce consumer trust.

Key Restraints

High Cost of Production and Limited Yield of Aquatic Retinoids

Unlike synthetic retinoids, which can be mass-produced at relatively lower costs, the extraction and purification of aquatic plant-sourced retinoids remain capital- and technology-intensive. Cultivation of marine algae requires controlled environments, large-scale photobioreactors, or ocean-based aquaculture systems that demand high operational investments.

Even with advances in fermentation and microalgae engineering, yields remain limited compared to the scale of demand, pushing costs higher. This makes aquatic retinoids significantly more expensive, restricting their presence mostly to premium skincare lines and luxury retail channels. Unless production costs are reduced through scale or innovation, mass-market adoption could remain limited, thereby slowing growth in price-sensitive regions such as Latin America and parts of Asia-Pacific.

Regulatory and Standardization Gaps Across Global Markets

Another critical restraint is the lack of harmonized regulatory frameworks for aquatic-sourced cosmetic ingredients. While the European Union enforces stringent testing and labeling requirements, other regions like Asia-Pacific have inconsistent standards for marine-derived actives. In markets such as China, additional approvals for new marine-sourced ingredients can delay commercialization.

Furthermore, the absence of a global standard for marine biotech or clean-label certifications creates confusion among both manufacturers and consumers. Brands often struggle with multiple certifications, inconsistent labeling, and regulatory hurdles that slow product launches. These gaps not only increase compliance costs but also limit transparency, which could undermine consumer trust in the long run.

Key Trends

Rapid Growth of Marine Biotech-Certified Claims as a Premium Differentiator

One of the defining trends in this market is the rise of marine biotech certifications and sustainability storytelling. Brands are increasingly highlighting certifications such as marine biotech, vegan, and clean-label on packaging to signal transparency and ethical sourcing.

Consumers are willing to pay a premium for such products, especially in mature markets like the USA, Japan, and Europe, where eco-conscious beauty is evolving into a mainstream purchase driver. Marine biotech claims are not just marketing labels but are being backed by academic partnerships, lab-to-brand collaborations, and third-party validations, which help these products command higher margins and loyalty.

Shift Toward Microalgae-Engineered Retinoids for Scalable Innovation

Another emerging trend is the pivot from traditional algae harvesting to microalgae bioengineering and synthetic biology platforms. Companies are experimenting with engineered strains of microalgae that produce higher retinoid yields with more consistent bioactivity.

This approach not only reduces dependency on natural harvesting (which is seasonal and environmentally sensitive) but also enables customization of retinoid molecules for specific benefits such as anti-inflammatory properties or enhanced photostability. This trend is particularly visible in collaborations between biotech startups and ingredient giants (e.g., BASF, Croda, Seppic), aiming to bridge the gap between sustainability, cost efficiency, and innovation.
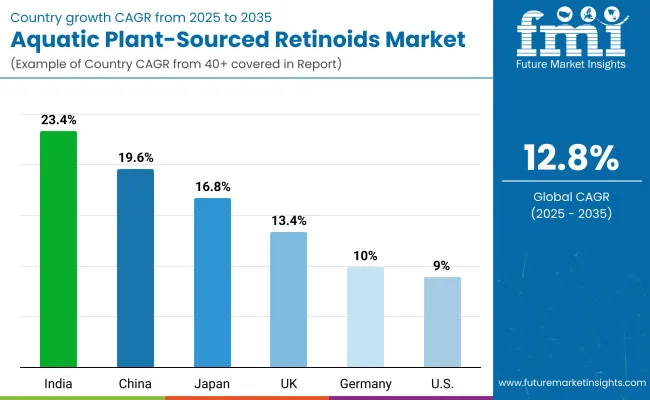
Analysis of Global Aquatic Plant-Sourced Retinoids Market By Key Countries

Aquatic Plant Sourced Retinoids Market Country Wise Analysis

Country Estimated CAGR (2025 to 2035)
China 19.6%
USA 9.0%
India 23.4%
UK 13.4%
Germany 10.0%
Japan 16.8%

The global aquatic plant-sourced retinoids market shows highly uneven growth rates across key countries, reflecting differences in consumer adoption, regulatory frameworks, and retail channel maturity. India is expected to lead with a CAGR of 23.4%, driven by its fast-growing middle-class population, strong demand for natural and clean-label beauty products, and the rising influence of e-commerce platforms that provide access to premium international skincare brands.

China follows closely with a 19.6% CAGR, fueled by the popularity of marine biotech-certified formulations, the country’s large consumer base for anti-aging and brightening solutions, and government-led support for biotech and algae-based industries. Japan, with a 16.8% CAGR, is seeing strong traction due to its aging population, premium skincare culture, and established dermocosmetic industry, which actively adopts safer alternatives to synthetic retinoids.

By contrast, Western markets are growing at a steadier pace, reflecting market maturity and consumer awareness. The USA is projected to grow at 9.0% CAGR, with demand concentrated in anti-aging serums and professional spa-based treatments, while Germany at 10.0% CAGR and the UK at 13.4% CAGR show strong preference for clean-label, vegan, and organic claims, aligning with Europe’s strict regulatory frameworks and sustainability-driven consumer behavior.

These markets, though slower in growth compared to Asia, remain significant in absolute value because of their established premium skincare segments and high consumer purchasing power. Overall, the data suggests that Asia-Pacific will be the engine of future expansion, while the USA and Europe will anchor demand through premium positioning and regulatory-driven trust.
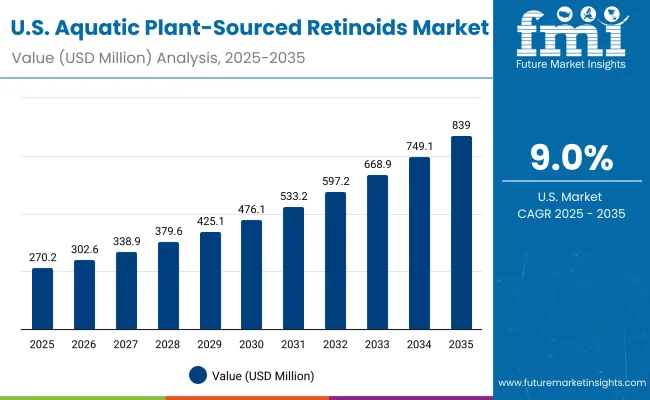
Sales Outlook for Aquatic Plant-Sourced Retinoids in the United States

Usa Aquatic Plant Sourced Retinoids Market

Year USA Aquatic Plant-Sourced Retinoids Market (USD Million)
2025 270.23
2026 302.65
2027 338.96
2028 379.62
2029 425.16
2030 476.16
2031 533.28
2032 597.25
2033 668.90
2034 749.14
2035 839.01

The Aquatic Plant-Sourced Retinoids Market in the United States is projected to grow at a CAGR of 9.0%, led by strong consumer interest in anti-aging serums and clean-label skincare solutions. Professional dermatology clinics and premium spas are integrating marine algae-derived retinoids into advanced anti-aging treatments, driving early adoption in the professional channel.

Pharmacies and e-commerce platforms have also seen growth, with USA consumers showing increasing trust in marine biotech-certified ingredients. The anti-aging & wrinkle repair function holds the largest share, while vegan and clean-label claims are expected to gain traction in the second half of the forecast period.

  • Anti-aging serums dominate USA sales, supported by strong consumer trust in natural retinoid substitutes.
  • Dermatology clinics and spas are key channels endorsing marine retinoid formulations.
  • Pharmacies and e-commerce platforms drive mainstream accessibility.

Growth and Expansion Outlook for Aquatic Plant-Sourced Retinoids in the United Kingdom

The Aquatic Plant-Sourced Retinoids Market in the United Kingdom is expected to grow at a CAGR of 13.4%, supported by premium skincare adoption and sustainability-driven claims. U.K. consumers are among the most responsive to vegan and clean-label certifications, boosting demand for microalgae-engineered and freshwater-derived extracts.

Innovation is being accelerated by collaborations between marine biotech firms and European cosmetic houses, with the U.K. serving as a hub for clinical trials and retail launches. E-commerce platforms are integrating retinoid-rich marine formulations into beauty subscription boxes and premium skincare bundles, widening access to eco-conscious consumers.

  • Clean-label and vegan positioning is central to growth in the U.K. market.
  • Clinical collaborations with European biotech firms drive product innovation.
  • Subscription-based e-commerce beauty boxes expand consumer reach.

Growth and Expansion Outlook for Aquatic Plant-Sourced Retinoids in India

India is witnessing rapid growth in the Aquatic Plant-Sourced Retinoids Market, which is forecast to expand at a CAGR of 23.4% through 2035. A sharp increase in adoption across tier-2 and tier-3 cities is being driven by price declines and rising consumer awareness of natural anti-aging products.

Domestic skincare brands are beginning to integrate marine biotech-certified and organic retinoid formulations, offering competitive price points for younger consumers. Educational campaigns, dermatology clinics, and Ayurveda-inspired beauty firms are collaborating to position aquatic retinoids as gentle yet effective alternatives to conventional chemical actives.

  • Tier-2 city consumers are driving incremental sales as affordability improves.
  • Domestic beauty brands are integrating aquatic retinoids with Ayurveda-inspired positioning.
  • Younger consumers see aquatic retinoids as safe anti-aging alternatives.

Sales Outlook for Aquatic Plant-Sourced Retinoids in China

The Aquatic Plant-Sourced Retinoids Market in China is expected to grow at a CAGR of 19.6%, the highest among leading economies. This momentum is driven by the popularity of marine biotech-certified formulations, rising urban demand for anti-aging and brightening products, and large-scale integration into premium spa and dermatology clinics.

Cross-sector adoption is also visible: domestic e-commerce platforms are promoting vegan and clean-label formulations at competitive prices, while biotech partnerships with local manufacturers enhance supply. Municipal and academic partnerships are supporting algae cultivation research, accelerating scalability.
  • Marine biotech claims are driving premium positioning in China’s urban markets.
  • Domestic e-commerce platforms are fueling mass-market adoption.
  • Biotech collaborations ensure a steady pipeline of innovative retinoid actives.

Opportunity Analysis of China Aquatic Plant-Sourced Retinoids Market

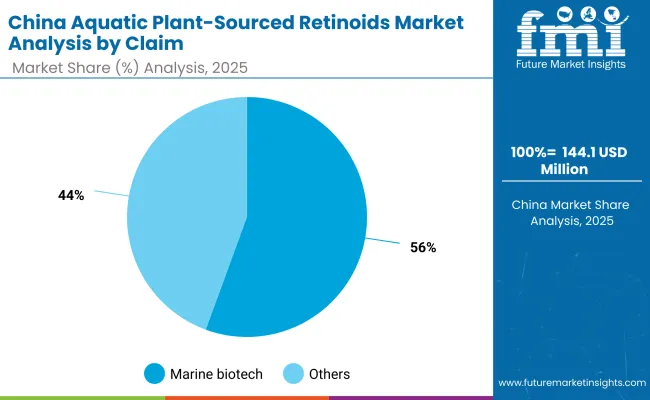
China Aquatic Plant Sourced Retinoids Market By Claim

China by Claim Value Share % 2025
Marine biotech 55.6%
Others 44.4%

The Aquatic Plant-Sourced Retinoids Market in China is valued at USD 144.1 million in 2025, with marine biotech claims leading at 55.6%, followed by natural/organic, vegan, and clean-label categories. The dominance of marine biotech claims is a direct outcome of China’s premium skincare ecosystem, where consumers place high trust in scientifically validated marine actives. Anti-aging and brightening products enriched with marine-sourced retinoids are gaining strong traction across tier-1 and tier-2 cities, particularly among middle- and upper-income demographics.

The market’s strength lies in the integration of marine biotech certifications with e-commerce-driven beauty consumption, as platforms such as Tmall and JD.com highlight clean-label, biotech-derived innovations in premium beauty sections. Portability of marine biotech claims across multiple formulations (serums, creams, ampoules) further enhances their adoption, making them a cornerstone for luxury brands and indie labels alike. Vegan and clean-label alternatives are also gaining traction, but marine biotech maintains leadership due to heavy investment in R&D and brand storytelling around marine purity.
  • Market size for China in 2025 is USD 144.1 million
  • Global market share is approximately 11.5%
  • Marine biotech leads at 55.6% due to consumer trust in certified marine actives

Opportunity Analysis of USA Aquatic Plant-Sourced Retinoids Market

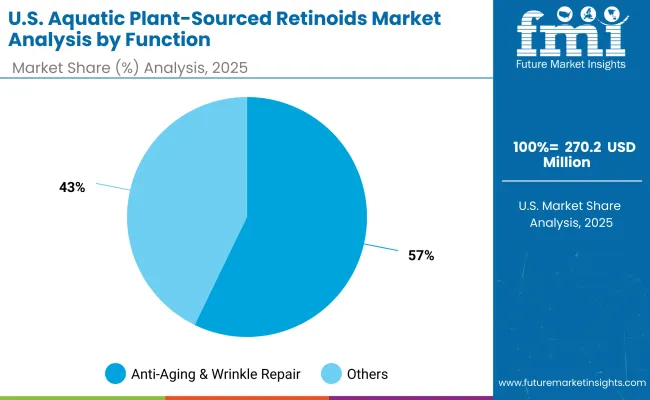
Usa Aquatic Plant Sourced Retinoids Market By Function

USA by Function Value Share % 2025
Anti-aging & wrinkle repair 57.2%
Others 42.8%

The Aquatic Plant-Sourced Retinoids Market in the United States is valued at USD 270.2 million in 2025, with anti-aging & wrinkle repair leading at 57.2%, followed by brightening, hydration, and cellular renewal. The dominance of anti-aging formulations is driven by the aging population and premium consumer spending on dermocosmetics, where retinoid-based anti-aging solutions are well-established. Unlike synthetic retinoids, marine-derived alternatives are gaining traction due to their lower irritation profile and strong alignment with clean-label and vegan trends.

The advantage of aquatic retinoids in the USA market lies in their integration into dermatology clinics, premium spas, and pharmacy-led retail channels, where professional endorsement reinforces consumer trust. At the same time, e-commerce channels and direct-to-consumer brands are scaling adoption among younger consumers looking for preventive anti-aging solutions. Over the forecast period, the USA market will see increasing demand for serums and ampoules, favored for their concentrated marine actives and compatibility with daily skincare regimens.
  • Market size for the USA in 2025 is USD 270.2 million
  • Global market share is approximately 21.6%
  • Anti-aging leads at 57.2% due to strong consumer demand for natural retinoid alternatives

Competitive Landscape of Global Aquatic Plant-Sourced Retinoids Market

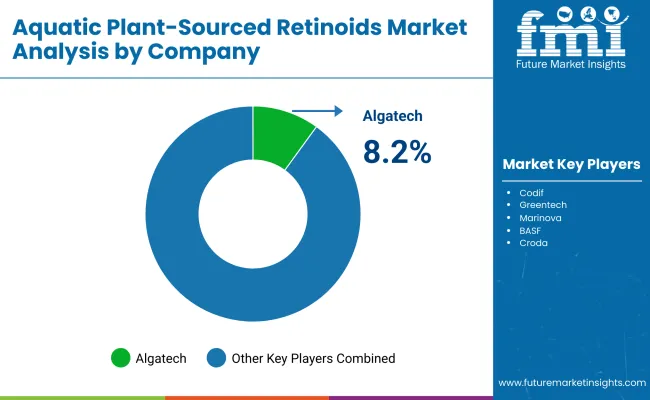
Aquatic Plant Sourced Retinoids Market By Company

Company Global Value Share 2025
Algatech 8.2%
Others 91.8%

The global Aquatic Plant-Sourced Retinoids Market is moderately fragmented, with marine biotechnology leaders, cosmetic ingredient suppliers, and niche algae-focused innovators competing across multiple regions. Global leaders such as Algatech, BASF, Croda, DSM-Firmenich, and Givaudan hold significant influence, driven by advanced marine algae cultivation systems, microalgae bioengineering capabilities, and integration into multinational skincare portfolios. Their strategies increasingly emphasize biotech partnerships, marine fermentation platforms, and clean-label certifications to secure premium positioning.

Established marine-specialist players such as Codif, Greentech, and Marinova cater to niche demand for sustainably harvested marine actives. These companies accelerate adoption through collaborations with luxury skincare brands and professional-grade spa treatments, making them highly relevant in Europe and Asia-Pacific premium markets.

Other mid-sized innovators like Seppic and Ashland are focusing on hybrid ingredient platforms that combine marine-derived retinoids with multifunctional properties such as hydration and barrier repair. Their strength lies in custom formulations, clinical validation, and cross-functional ingredient positioning, which appeal to pharma-cosmetic and dermocosmetic applications.

Competitive differentiation is shifting away from sourcing exclusivity toward integrated ecosystems that include biotech scalability, regulatory compliance, consumer-facing certifications (vegan, clean-label, marine biotech), and cross-channel retail partnerships. Emerging entrants in Asia are rapidly adopting microalgae engineering and cost-competitive freshwater retinoid extraction, signaling intensified competition in the next decade.

Key Developments in Global Aquatic Plant-Sourced Retinoids Market

  • On March 12, 2024, Algatech launched a new line of microalgae-engineered retinoid concentrates designed for high-efficacy anti-aging serums. The company partnered with two European luxury skincare brands to accelerate commercialization.
  • On June 8, 2024, Codif announced the expansion of its marine biotech cultivation facility in Brittany, France, increasing capacity for algae-based retinoid actives by 40%. The investment was aimed at meeting rising demand from Asia-Pacific markets.

Scope of the Report

Item Value
Quantitative Units USD 1,250.3 Million
Source Marine algae-derived retinoids , Freshwater plant extracts, Microalgae engineered retinoids
Function Anti-aging & wrinkle repair, Brightening, Cellular renewal, Hydration
Product Type Serums, Creams/lotions, Masks, Ampoules
Channel E-commerce, Pharmacies, Specialty marine-based beauty retail, Premium spas/dermatology clinics
Claim Marine biotech, Natural/organic, Vegan, Clean-label
Regions Covered North America, Europe, Asia-Pacific, Latin America, Middle East & Africa
Country Covered United States, Canada, Germany, France, United Kingdom, China, Japan, India, Brazil, South Africa
Key Companies Profiled Algatech , Codif , Greentech , Marinova , BASF, Croda , Seppic , Ashland, DSM- Firmenich , Givaudan
Additional Attributes Dollar sales by source, function, claim, and product type; adoption trends across premium skincare, spa dermatology, and e-commerce; rising demand for marine biotech-certified formulations; sector-specific growth in anti-aging, brightening, and hydration; consumer-driven expansion of vegan and clean-label retinoids ; regional trends influenced by biotech investments, sustainability certifications, and digital-first retail strategies; innovations in microalgae bioengineering, marine fermentation, and clean-label extraction methods.

Key Segments

By Source:

  • Marine algae-derived retinoids
  • Freshwater plant extracts
  • Microalgae engineered retinoids

By Function:

  • Anti-aging & wrinkle repair
  • Brightening
  • Cellular renewal
  • Hydration

By Product Type:

  • Serums
  • Creams/lotions
  • Masks
  • Ampoules

By Channel:

  • E-commerce
  • Pharmacies
  • Specialty marine-based beauty retail
  • Premium spas/dermatology clinics

By Claim:

  • Marine biotech
  • Natural/organic
  • Vegan
  • Clean-label

By Region:

  • North America
  • Latin America
  • Europe
  • East Asia
  • South Asia & Pacific
  • Middle East and Africa

Table of Content

  1. Executive Summary
    • Global Market Outlook
    • Demand-side Trends
    • Supply-side Trends
    • Technology Roadmap Analysis
    • Analysis and Recommendations
  2. Market Overview
    • Market Coverage / Taxonomy
    • Market Definition / Scope / Limitations
  3. Market Background
    • Market Dynamics
      • Drivers
      • Restraints
      • Opportunity
      • Trends
    • Scenario Forecast
      • Demand in Optimistic Scenario
      • Demand in Likely Scenario
      • Demand in Conservative Scenario
    • Opportunity Map Analysis
    • Product Life Cycle Analysis
    • Supply Chain Analysis
    • Investment Feasibility Matrix
    • Value Chain Analysis
    • PESTLE and Porter’s Analysis
    • Regulatory Landscape
    • Regional Parent Market Outlook
    • Production and Consumption Statistics
    • Import and Export Statistics
  4. Global Analysis 2020 to 2024 and Forecast, 2025 to 2035
    • Historical Market Size Value (USD Million) & Volume (Units) Analysis, 2020 to 2024
    • Current and Future Market Size Value (USD Million) & Volume (Units) Projections, 2025 to 2035
      • Y-o-Y Growth Trend Analysis
      • Absolute $ Opportunity Analysis
  5. Global Pricing Analysis 2020 to 2024 and Forecast 2025 to 2035
  6. Global Analysis 2020 to 2024 and Forecast 2025 to 2035, By Source
    • Introduction / Key Findings
    • Historical Market Size Value (USD Million) & Volume (Units) Analysis By Source, 2020 to 2024
    • Current and Future Market Size Value (USD Million) & Volume (Units) Analysis and Forecast By Source, 2025 to 2035
      • Marine algae-derived retinoids
      • Freshwater plant extracts
      • Microalgae engineered retinoids
    • Y-o-Y Growth Trend Analysis By Source, 2020 to 2024
    • Absolute $ Opportunity Analysis By Source, 2025 to 2035
  7. Global Analysis 2020 to 2024 and Forecast 2025 to 2035, By Function
    • Introduction / Key Findings
    • Historical Market Size Value (USD Million) & Volume (Units) Analysis By Function, 2020 to 2024
    • Current and Future Market Size Value (USD Million) & Volume (Units) Analysis and Forecast By Function, 2025 to 2035
      • Anti-aging & wrinkle repair
      • Brightening
      • Cellular renewal
      • Hydration
    • Y-o-Y Growth Trend Analysis By Function, 2020 to 2024
    • Absolute $ Opportunity Analysis By Function, 2025 to 2035
  8. Global Analysis 2020 to 2024 and Forecast 2025 to 2035, By Product Type
    • Introduction / Key Findings
    • Historical Market Size Value (USD Million) & Volume (Units) Analysis By Product Type, 2020 to 2024
    • Current and Future Market Size Value (USD Million) & Volume (Units) Analysis and Forecast By Product Type, 2025 to 2035
      • Serums
      • Creams/lotions
      • Masks
      • Ampoules
    • Y-o-Y Growth Trend Analysis By Product Type, 2020 to 2024
    • Absolute $ Opportunity Analysis By Product Type, 2025 to 2035
  9. Global Analysis 2020 to 2024 and Forecast 2025 to 2035, By Channel
    • Introduction / Key Findings
    • Historical Market Size Value (USD Million) & Volume (Units) Analysis By Channel, 2020 to 2024
    • Current and Future Market Size Value (USD Million) & Volume (Units) Analysis and Forecast By Channel, 2025 to 2035
      • E-commerce
      • Pharmacies
      • Specialty marine-based beauty retail
      • Premium spas/dermatology clinics
    • Y-o-Y Growth Trend Analysis By Channel, 2020 to 2024
    • Absolute $ Opportunity Analysis By Channel, 2025 to 2035
  10. Global Analysis 2020 to 2024 and Forecast 2025 to 2035, By Claim
    • Introduction / Key Findings
    • Historical Market Size Value (USD Million) & Volume (Units) Analysis By Claim, 2020 to 2024
    • Current and Future Market Size Value (USD Million) & Volume (Units) Analysis and Forecast By Claim, 2025 to 2035
      • Marine biotech
      • Natural/organic
      • Vegan
      • Clean-label
    • Y-o-Y Growth Trend Analysis By Claim, 2020 to 2024
    • Absolute $ Opportunity Analysis By Claim, 2025 to 2035
  11. Global Analysis 2020 to 2024 and Forecast 2025 to 2035, By Region
    • Introduction
    • Historical Market Size Value (USD Million) & Volume (Units) Analysis By Region, 2020 to 2024
    • Current Market Size Value (USD Million) & Volume (Units) Analysis and Forecast By Region, 2025 to 2035
      • North America
      • Latin America
      • Europe
      • East Asia
      • South Asia & Pacific
      • Middle East and Africa
    • Market Attractiveness Analysis By Region
  12. North America Analysis 2020 to 2024 and Forecast 2025 to 2035, By Country
    • Historical Market Size Value (USD Million) & Volume (Units) Trend Analysis By Market Taxonomy, 2020 to 2024
    • Market Size Value (USD Million) & Volume (Units) Forecast By Market Taxonomy, 2025 to 2035
      • By Country
        • USA
        • Canada
      • By Source
      • By Function
      • By Product Type
      • By Channel
      • By Claim
    • Market Attractiveness Analysis
      • By Country
      • By Source
      • By Function
      • By Product Type
      • By Channel
      • By Claim
    • Key Takeaways
  13. Latin America Analysis 2020 to 2024 and Forecast 2025 to 2035, By Country
    • Historical Market Size Value (USD Million) & Volume (Units) Trend Analysis By Market Taxonomy, 2020 to 2024
    • Market Size Value (USD Million) & Volume (Units) Forecast By Market Taxonomy, 2025 to 2035
      • By Country
        • Brazil
        • Mexico
        • Colombia
        • Rest of Latin America
      • By Source
      • By Function
      • By Product Type
      • By Channel
      • By Claim
    • Market Attractiveness Analysis
      • By Country
      • By Source
      • By Function
      • By Product Type
      • By Channel
      • By Claim
    • Key Takeaways
  14. Europe Analysis 2020 to 2024 and Forecast 2025 to 2035, By Country
    • Historical Market Size Value (USD Million) & Volume (Units) Trend Analysis By Market Taxonomy, 2020 to 2024
    • Market Size Value (USD Million) & Volume (Units) Forecast By Market Taxonomy, 2025 to 2035
      • By Country
        • Germany
        • UK
        • France
        • Italy
        • Spain
        • Belgium
        • Netherlands
        • Nordic
        • Switzerland
        • Russia
        • Poland
        • Rest of Europe
      • By Source
      • By Function
      • By Product Type
      • By Channel
      • By Claim
    • Market Attractiveness Analysis
      • By Country
      • By Source
      • By Function
      • By Product Type
      • By Channel
      • By Claim
    • Key Takeaways
  15. East Asia Analysis 2020 to 2024 and Forecast 2025 to 2035, By Country
    • Historical Market Size Value (USD Million) & Volume (Units) Trend Analysis By Market Taxonomy, 2020 to 2024
    • Market Size Value (USD Million) & Volume (Units) Forecast By Market Taxonomy, 2025 to 2035
      • By Country
        • China
        • Japan
        • South Korea
      • By Source
      • By Function
      • By Product Type
      • By Channel
      • By Claim
    • Market Attractiveness Analysis
      • By Country
      • By Source
      • By Function
      • By Product Type
      • By Channel
      • By Claim
    • Key Takeaways
  16. South Asia & Pacific Analysis 2020 to 2024 and Forecast 2025 to 2035, By Country
    • Historical Market Size Value (USD Million) & Volume (Units) Trend Analysis By Market Taxonomy, 2020 to 2024
    • Market Size Value (USD Million) & Volume (Units) Forecast By Market Taxonomy, 2025 to 2035
      • By Country
        • India
        • Thailand
        • Malaysia
        • Indonesia
        • Singapore
        • Vietnam
        • Australia
        • New Zealand
        • Rest of South Asia
      • By Source
      • By Function
      • By Product Type
      • By Channel
      • By Claim
    • Market Attractiveness Analysis
      • By Country
      • By Source
      • By Function
      • By Product Type
      • By Channel
      • By Claim
    • Key Takeaways
  17. Middle East and Africa Analysis 2020 to 2024 and Forecast 2025 to 2035, By Country
    • Historical Market Size Value (USD Million) & Volume (Units) Trend Analysis By Market Taxonomy, 2020 to 2024
    • Market Size Value (USD Million) & Volume (Units) Forecast By Market Taxonomy, 2025 to 2035
      • By Country
        • Turkey
        • UAE
        • Saudi Arabia
        • Israel
        • Other GCC Countries
        • North Africa
        • South Africa
      • By Source
      • By Function
      • By Product Type
      • By Channel
      • By Claim
    • Market Attractiveness Analysis
      • By Country
      • By Source
      • By Function
      • By Product Type
      • By Channel
      • By Claim
    • Key Takeaways
  18. Key Countries Analysis
    • USA
      • Pricing Analysis
      • Market Share Analysis, 2024
        • By Source
        • By Function
        • By Product Type
        • By Channel
        • By Claim
    • Canada
      • Pricing Analysis
      • Market Share Analysis, 2024
        • By Source
        • By Function
        • By Product Type
        • By Channel
        • By Claim
    • Mexico
      • Pricing Analysis
      • Market Share Analysis, 2024
        • By Source
        • By Function
        • By Product Type
        • By Channel
        • By Claim
    • Brazil
      • Pricing Analysis
      • Market Share Analysis, 2024
        • By Source
        • By Function
        • By Product Type
        • By Channel
        • By Claim
    • Chile
      • Pricing Analysis
      • Market Share Analysis, 2024
        • By Source
        • By Function
        • By Product Type
        • By Channel
        • By Claim
    • Germany
      • Pricing Analysis
      • Market Share Analysis, 2024
        • By Source
        • By Function
        • By Product Type
        • By Channel
        • By Claim
    • UK
      • Pricing Analysis
      • Market Share Analysis, 2024
        • By Source
        • By Function
        • By Product Type
        • By Channel
        • By Claim
    • Italy
      • Pricing Analysis
      • Market Share Analysis, 2024
        • By Source
        • By Function
        • By Product Type
        • By Channel
        • By Claim
    • Spain
      • Pricing Analysis
      • Market Share Analysis, 2024
        • By Source
        • By Function
        • By Product Type
        • By Channel
        • By Claim
    • France
      • Pricing Analysis
      • Market Share Analysis, 2024
        • By Source
        • By Function
        • By Product Type
        • By Channel
        • By Claim
    • India
      • Pricing Analysis
      • Market Share Analysis, 2024
        • By Source
        • By Function
        • By Product Type
        • By Channel
        • By Claim
    • ASEAN
      • Pricing Analysis
      • Market Share Analysis, 2024
        • By Source
        • By Function
        • By Product Type
        • By Channel
        • By Claim
    • Australia & New Zealand
      • Pricing Analysis
      • Market Share Analysis, 2024
        • By Source
        • By Function
        • By Product Type
        • By Channel
        • By Claim
    • China
      • Pricing Analysis
      • Market Share Analysis, 2024
        • By Source
        • By Function
        • By Product Type
        • By Channel
        • By Claim
    • Japan
      • Pricing Analysis
      • Market Share Analysis, 2024
        • By Source
        • By Function
        • By Product Type
        • By Channel
        • By Claim
    • South Korea
      • Pricing Analysis
      • Market Share Analysis, 2024
        • By Source
        • By Function
        • By Product Type
        • By Channel
        • By Claim
    • Russia
      • Pricing Analysis
      • Market Share Analysis, 2024
        • By Source
        • By Function
        • By Product Type
        • By Channel
        • By Claim
    • Poland
      • Pricing Analysis
      • Market Share Analysis, 2024
        • By Source
        • By Function
        • By Product Type
        • By Channel
        • By Claim
    • Hungary
      • Pricing Analysis
      • Market Share Analysis, 2024
        • By Source
        • By Function
        • By Product Type
        • By Channel
        • By Claim
    • Kingdom of Saudi Arabia
      • Pricing Analysis
      • Market Share Analysis, 2024
        • By Source
        • By Function
        • By Product Type
        • By Channel
        • By Claim
    • Turkiye
      • Pricing Analysis
      • Market Share Analysis, 2024
        • By Source
        • By Function
        • By Product Type
        • By Channel
        • By Claim
    • South Africa
      • Pricing Analysis
      • Market Share Analysis, 2024
        • By Source
        • By Function
        • By Product Type
        • By Channel
        • By Claim
  19. Market Structure Analysis
    • Competition Dashboard
    • Competition Benchmarking
    • Market Share Analysis of Top Players
      • By Regional
      • By Source
      • By Function
      • By Product Type
      • By Channel
      • By Claim
  20. Competition Analysis
    • Competition Deep Dive
      • Algatech
        • Overview
        • Product Portfolio
        • Profitability by Market Segments (Product/Age /Sales Channel/Region)
        • Sales Footprint
        • Strategy Overview
        • Codif
        • Greentech
        • Marinova
        • BASF
        • Croda
        • Seppic
        • Ashland
        • DSM-Firmenich
        • Givaudan
  21. Assumptions & Acronyms Used
  22. Research Methodology

List of Tables

  • Table 1: Global Value (USD Million) Forecast by Region, 2020-2035
  • Table 2: Global Volume (Units) Forecast by Region, 2020-2035
  • Table 3: Global Value (USD Million) Forecast by Source, 2020-2035
  • Table 4: Global Volume (Units) Forecast by Source, 2020-2035
  • Table 5: Global Value (USD Million) Forecast by Function, 2020-2035
  • Table 6: Global Volume (Units) Forecast by Function, 2020-2035
  • Table 7: Global Value (USD Million) Forecast by Product Type, 2020-2035
  • Table 8: Global Volume (Units) Forecast by Product Type, 2020-2035
  • Table 9: Global Value (USD Million) Forecast by Channel, 2020-2035
  • Table 10: Global Volume (Units) Forecast by Channel, 2020-2035
  • Table 11: Global Value (USD Million) Forecast by Claim, 2020-2035
  • Table 12: Global Volume (Units) Forecast by Claim, 2020-2035
  • Table 13: North America Value (USD Million) Forecast by Country, 2020-2035
  • Table 14: North America Volume (Units) Forecast by Country, 2020-2035
  • Table 15: North America Value (USD Million) Forecast by Source, 2020-2035
  • Table 16: North America Volume (Units) Forecast by Source, 2020-2035
  • Table 17: North America Value (USD Million) Forecast by Function, 2020-2035
  • Table 18: North America Volume (Units) Forecast by Function, 2020-2035
  • Table 19: North America Value (USD Million) Forecast by Product Type, 2020-2035
  • Table 20: North America Volume (Units) Forecast by Product Type, 2020-2035
  • Table 21: North America Value (USD Million) Forecast by Channel, 2020-2035
  • Table 22: North America Volume (Units) Forecast by Channel, 2020-2035
  • Table 23: North America Value (USD Million) Forecast by Claim, 2020-2035
  • Table 24: North America Volume (Units) Forecast by Claim, 2020-2035
  • Table 25: Latin America Value (USD Million) Forecast by Country, 2020-2035
  • Table 26: Latin America Volume (Units) Forecast by Country, 2020-2035
  • Table 27: Latin America Value (USD Million) Forecast by Source, 2020-2035
  • Table 28: Latin America Volume (Units) Forecast by Source, 2020-2035
  • Table 29: Latin America Value (USD Million) Forecast by Function, 2020-2035
  • Table 30: Latin America Volume (Units) Forecast by Function, 2020-2035
  • Table 31: Latin America Value (USD Million) Forecast by Product Type, 2020-2035
  • Table 32: Latin America Volume (Units) Forecast by Product Type, 2020-2035
  • Table 33: Latin America Value (USD Million) Forecast by Channel, 2020-2035
  • Table 34: Latin America Volume (Units) Forecast by Channel, 2020-2035
  • Table 35: Latin America Value (USD Million) Forecast by Claim, 2020-2035
  • Table 36: Latin America Volume (Units) Forecast by Claim, 2020-2035
  • Table 37: Europe Value (USD Million) Forecast by Country, 2020-2035
  • Table 38: Europe Volume (Units) Forecast by Country, 2020-2035
  • Table 39: Europe Value (USD Million) Forecast by Source, 2020-2035
  • Table 40: Europe Volume (Units) Forecast by Source, 2020-2035
  • Table 41: Europe Value (USD Million) Forecast by Function, 2020-2035
  • Table 42: Europe Volume (Units) Forecast by Function, 2020-2035
  • Table 43: Europe Value (USD Million) Forecast by Product Type, 2020-2035
  • Table 44: Europe Volume (Units) Forecast by Product Type, 2020-2035
  • Table 45: Europe Value (USD Million) Forecast by Channel, 2020-2035
  • Table 46: Europe Volume (Units) Forecast by Channel, 2020-2035
  • Table 47: Europe Value (USD Million) Forecast by Claim, 2020-2035
  • Table 48: Europe Volume (Units) Forecast by Claim, 2020-2035
  • Table 49: East Asia Value (USD Million) Forecast by Country, 2020-2035
  • Table 50: East Asia Volume (Units) Forecast by Country, 2020-2035
  • Table 51: East Asia Value (USD Million) Forecast by Source, 2020-2035
  • Table 52: East Asia Volume (Units) Forecast by Source, 2020-2035
  • Table 53: East Asia Value (USD Million) Forecast by Function, 2020-2035
  • Table 54: East Asia Volume (Units) Forecast by Function, 2020-2035
  • Table 55: East Asia Value (USD Million) Forecast by Product Type, 2020-2035
  • Table 56: East Asia Volume (Units) Forecast by Product Type, 2020-2035
  • Table 57: East Asia Value (USD Million) Forecast by Channel, 2020-2035
  • Table 58: East Asia Volume (Units) Forecast by Channel, 2020-2035
  • Table 59: East Asia Value (USD Million) Forecast by Claim, 2020-2035
  • Table 60: East Asia Volume (Units) Forecast by Claim, 2020-2035
  • Table 61: South Asia & Pacific Value (USD Million) Forecast by Country, 2020-2035
  • Table 62: South Asia & Pacific Volume (Units) Forecast by Country, 2020-2035
  • Table 63: South Asia & Pacific Value (USD Million) Forecast by Source, 2020-2035
  • Table 64: South Asia & Pacific Volume (Units) Forecast by Source, 2020-2035
  • Table 65: South Asia & Pacific Value (USD Million) Forecast by Function, 2020-2035
  • Table 66: South Asia & Pacific Volume (Units) Forecast by Function, 2020-2035
  • Table 67: South Asia & Pacific Value (USD Million) Forecast by Product Type, 2020-2035
  • Table 68: South Asia & Pacific Volume (Units) Forecast by Product Type, 2020-2035
  • Table 69: South Asia & Pacific Value (USD Million) Forecast by Channel, 2020-2035
  • Table 70: South Asia & Pacific Volume (Units) Forecast by Channel, 2020-2035
  • Table 71: South Asia & Pacific Value (USD Million) Forecast by Claim, 2020-2035
  • Table 72: South Asia & Pacific Volume (Units) Forecast by Claim, 2020-2035
  • Table 73: Middle East and Africa Value (USD Million) Forecast by Country, 2020-2035
  • Table 74: Middle East and Africa Volume (Units) Forecast by Country, 2020-2035
  • Table 75: Middle East and Africa Value (USD Million) Forecast by Source, 2020-2035
  • Table 76: Middle East and Africa Volume (Units) Forecast by Source, 2020-2035
  • Table 77: Middle East and Africa Value (USD Million) Forecast by Function, 2020-2035
  • Table 78: Middle East and Africa Volume (Units) Forecast by Function, 2020-2035
  • Table 79: Middle East and Africa Value (USD Million) Forecast by Product Type, 2020-2035
  • Table 80: Middle East and Africa Volume (Units) Forecast by Product Type, 2020-2035
  • Table 81: Middle East and Africa Value (USD Million) Forecast by Channel, 2020-2035
  • Table 82: Middle East and Africa Volume (Units) Forecast by Channel, 2020-2035
  • Table 83: Middle East and Africa Value (USD Million) Forecast by Claim, 2020-2035
  • Table 84: Middle East and Africa Volume (Units) Forecast by Claim, 2020-2035

List of Figures

  • Figure 1: Global Volume (Units) Forecast 2020-2035
  • Figure 2: Global Pricing Analysis
  • Figure 3: Global Value (USD Million) Forecast 2020-2035
  • Figure 4: Global Value Share and BPS Analysis by Source, 2025 and 2035
  • Figure 5: Global Y-o-Y Growth Comparison by Source, 2025-2035
  • Figure 6: Global Attractiveness Analysis by Source
  • Figure 7: Global Value Share and BPS Analysis by Function, 2025 and 2035
  • Figure 8: Global Y-o-Y Growth Comparison by Function, 2025-2035
  • Figure 9: Global Attractiveness Analysis by Function
  • Figure 10: Global Value Share and BPS Analysis by Product Type, 2025 and 2035
  • Figure 11: Global Y-o-Y Growth Comparison by Product Type, 2025-2035
  • Figure 12: Global Attractiveness Analysis by Product Type
  • Figure 13: Global Value Share and BPS Analysis by Channel, 2025 and 2035
  • Figure 14: Global Y-o-Y Growth Comparison by Channel, 2025-2035
  • Figure 15: Global Attractiveness Analysis by Channel
  • Figure 16: Global Value Share and BPS Analysis by Claim, 2025 and 2035
  • Figure 17: Global Y-o-Y Growth Comparison by Claim, 2025-2035
  • Figure 18: Global Attractiveness Analysis by Claim
  • Figure 19: Global Value (USD Million) Share and BPS Analysis by Region, 2025 and 2035
  • Figure 20: Global Y-o-Y Growth Comparison by Region, 2025-2035
  • Figure 21: Global Attractiveness Analysis by Region
  • Figure 22: North America Incremental $ Opportunity, 2025-2035
  • Figure 23: Latin America Incremental $ Opportunity, 2025-2035
  • Figure 24: Europe Incremental $ Opportunity, 2025-2035
  • Figure 25: East Asia Incremental $ Opportunity, 2025-2035
  • Figure 26: South Asia & Pacific Incremental $ Opportunity, 2025-2035
  • Figure 27: Middle East and Africa Incremental $ Opportunity, 2025-2035
  • Figure 28: North America Value Share and BPS Analysis by Country, 2025 and 2035
  • Figure 29: North America Value Share and BPS Analysis by Source, 2025 and 2035
  • Figure 30: North America Y-o-Y Growth Comparison by Source, 2025-2035
  • Figure 31: North America Attractiveness Analysis by Source
  • Figure 32: North America Value Share and BPS Analysis by Function, 2025 and 2035
  • Figure 33: North America Y-o-Y Growth Comparison by Function, 2025-2035
  • Figure 34: North America Attractiveness Analysis by Function
  • Figure 35: North America Value Share and BPS Analysis by Product Type, 2025 and 2035
  • Figure 36: North America Y-o-Y Growth Comparison by Product Type, 2025-2035
  • Figure 37: North America Attractiveness Analysis by Product Type
  • Figure 38: North America Value Share and BPS Analysis by Channel, 2025 and 2035
  • Figure 39: North America Y-o-Y Growth Comparison by Channel, 2025-2035
  • Figure 40: North America Attractiveness Analysis by Channel
  • Figure 41: North America Value Share and BPS Analysis by Claim, 2025 and 2035
  • Figure 42: North America Y-o-Y Growth Comparison by Claim, 2025-2035
  • Figure 43: North America Attractiveness Analysis by Claim
  • Figure 44: Latin America Value Share and BPS Analysis by Country, 2025 and 2035
  • Figure 45: Latin America Value Share and BPS Analysis by Source, 2025 and 2035
  • Figure 46: Latin America Y-o-Y Growth Comparison by Source, 2025-2035
  • Figure 47: Latin America Attractiveness Analysis by Source
  • Figure 48: Latin America Value Share and BPS Analysis by Function, 2025 and 2035
  • Figure 49: Latin America Y-o-Y Growth Comparison by Function, 2025-2035
  • Figure 50: Latin America Attractiveness Analysis by Function
  • Figure 51: Latin America Value Share and BPS Analysis by Product Type, 2025 and 2035
  • Figure 52: Latin America Y-o-Y Growth Comparison by Product Type, 2025-2035
  • Figure 53: Latin America Attractiveness Analysis by Product Type
  • Figure 54: Latin America Value Share and BPS Analysis by Channel, 2025 and 2035
  • Figure 55: Latin America Y-o-Y Growth Comparison by Channel, 2025-2035
  • Figure 56: Latin America Attractiveness Analysis by Channel
  • Figure 57: Latin America Value Share and BPS Analysis by Claim, 2025 and 2035
  • Figure 58: Latin America Y-o-Y Growth Comparison by Claim, 2025-2035
  • Figure 59: Latin America Attractiveness Analysis by Claim
  • Figure 60: Europe Value Share and BPS Analysis by Country, 2025 and 2035
  • Figure 61: Europe Value Share and BPS Analysis by Source, 2025 and 2035
  • Figure 62: Europe Y-o-Y Growth Comparison by Source, 2025-2035
  • Figure 63: Europe Attractiveness Analysis by Source
  • Figure 64: Europe Value Share and BPS Analysis by Function, 2025 and 2035
  • Figure 65: Europe Y-o-Y Growth Comparison by Function, 2025-2035
  • Figure 66: Europe Attractiveness Analysis by Function
  • Figure 67: Europe Value Share and BPS Analysis by Product Type, 2025 and 2035
  • Figure 68: Europe Y-o-Y Growth Comparison by Product Type, 2025-2035
  • Figure 69: Europe Attractiveness Analysis by Product Type
  • Figure 70: Europe Value Share and BPS Analysis by Channel, 2025 and 2035
  • Figure 71: Europe Y-o-Y Growth Comparison by Channel, 2025-2035
  • Figure 72: Europe Attractiveness Analysis by Channel
  • Figure 73: Europe Value Share and BPS Analysis by Claim, 2025 and 2035
  • Figure 74: Europe Y-o-Y Growth Comparison by Claim, 2025-2035
  • Figure 75: Europe Attractiveness Analysis by Claim
  • Figure 76: East Asia Value Share and BPS Analysis by Country, 2025 and 2035
  • Figure 77: East Asia Value Share and BPS Analysis by Source, 2025 and 2035
  • Figure 78: East Asia Y-o-Y Growth Comparison by Source, 2025-2035
  • Figure 79: East Asia Attractiveness Analysis by Source
  • Figure 80: East Asia Value Share and BPS Analysis by Function, 2025 and 2035
  • Figure 81: East Asia Y-o-Y Growth Comparison by Function, 2025-2035
  • Figure 82: East Asia Attractiveness Analysis by Function
  • Figure 83: East Asia Value Share and BPS Analysis by Product Type, 2025 and 2035
  • Figure 84: East Asia Y-o-Y Growth Comparison by Product Type, 2025-2035
  • Figure 85: East Asia Attractiveness Analysis by Product Type
  • Figure 86: East Asia Value Share and BPS Analysis by Channel, 2025 and 2035
  • Figure 87: East Asia Y-o-Y Growth Comparison by Channel, 2025-2035
  • Figure 88: East Asia Attractiveness Analysis by Channel
  • Figure 89: East Asia Value Share and BPS Analysis by Claim, 2025 and 2035
  • Figure 90: East Asia Y-o-Y Growth Comparison by Claim, 2025-2035
  • Figure 91: East Asia Attractiveness Analysis by Claim
  • Figure 92: South Asia & Pacific Value Share and BPS Analysis by Country, 2025 and 2035
  • Figure 93: South Asia & Pacific Value Share and BPS Analysis by Source, 2025 and 2035
  • Figure 94: South Asia & Pacific Y-o-Y Growth Comparison by Source, 2025-2035
  • Figure 95: South Asia & Pacific Attractiveness Analysis by Source
  • Figure 96: South Asia & Pacific Value Share and BPS Analysis by Function, 2025 and 2035
  • Figure 97: South Asia & Pacific Y-o-Y Growth Comparison by Function, 2025-2035
  • Figure 98: South Asia & Pacific Attractiveness Analysis by Function
  • Figure 99: South Asia & Pacific Value Share and BPS Analysis by Product Type, 2025 and 2035
  • Figure 100: South Asia & Pacific Y-o-Y Growth Comparison by Product Type, 2025-2035
  • Figure 101: South Asia & Pacific Attractiveness Analysis by Product Type
  • Figure 102: South Asia & Pacific Value Share and BPS Analysis by Channel, 2025 and 2035
  • Figure 103: South Asia & Pacific Y-o-Y Growth Comparison by Channel, 2025-2035
  • Figure 104: South Asia & Pacific Attractiveness Analysis by Channel
  • Figure 105: South Asia & Pacific Value Share and BPS Analysis by Claim, 2025 and 2035
  • Figure 106: South Asia & Pacific Y-o-Y Growth Comparison by Claim, 2025-2035
  • Figure 107: South Asia & Pacific Attractiveness Analysis by Claim
  • Figure 108: Middle East and Africa Value Share and BPS Analysis by Country, 2025 and 2035
  • Figure 109: Middle East and Africa Value Share and BPS Analysis by Source, 2025 and 2035
  • Figure 110: Middle East and Africa Y-o-Y Growth Comparison by Source, 2025-2035
  • Figure 111: Middle East and Africa Attractiveness Analysis by Source
  • Figure 112: Middle East and Africa Value Share and BPS Analysis by Function, 2025 and 2035
  • Figure 113: Middle East and Africa Y-o-Y Growth Comparison by Function, 2025-2035
  • Figure 114: Middle East and Africa Attractiveness Analysis by Function
  • Figure 115: Middle East and Africa Value Share and BPS Analysis by Product Type, 2025 and 2035
  • Figure 116: Middle East and Africa Y-o-Y Growth Comparison by Product Type, 2025-2035
  • Figure 117: Middle East and Africa Attractiveness Analysis by Product Type
  • Figure 118: Middle East and Africa Value Share and BPS Analysis by Channel, 2025 and 2035
  • Figure 119: Middle East and Africa Y-o-Y Growth Comparison by Channel, 2025-2035
  • Figure 120: Middle East and Africa Attractiveness Analysis by Channel
  • Figure 121: Middle East and Africa Value Share and BPS Analysis by Claim, 2025 and 2035
  • Figure 122: Middle East and Africa Y-o-Y Growth Comparison by Claim, 2025-2035
  • Figure 123: Middle East and Africa Attractiveness Analysis by Claim
  • Figure 124: Global - Tier Structure Analysis
  • Figure 125: Global - Company Share Analysis

Frequently Asked Questions

How big is the global Aquatic Plant-Sourced Retinoids Market in 2025?

The global Aquatic Plant-Sourced Retinoids Market is estimated to be valued at USD 1,250.3 million in 2025.

What will be the size of the global Aquatic Plant-Sourced Retinoids Market in 2035?

The market size for the global Aquatic Plant-Sourced Retinoids Market is projected to reach USD 4,153.1 million by 2035.

How much will be the global Aquatic Plant-Sourced Retinoids Market growth between 2025 and 2035?

The global Aquatic Plant-Sourced Retinoids Market is expected to grow at a 12.8% CAGR between 2025 and 2035.

What are the key product types in the global Aquatic Plant-Sourced Retinoids Market?

The key product types in the global Aquatic Plant-Sourced Retinoids Market are serums, creams/lotions, masks, and ampoules.

Which function segment will contribute the most significant share in the global Aquatic Plant-Sourced Retinoids Market in 2025?

In terms of function, anti-aging & wrinkle repair is projected to command 56.6% share in the global Aquatic Plant-Sourced Retinoids Market in 2025.

Future Market Insights

Aquatic Plant-Sourced Retinoids Market

Chat With

MaRIA

Hi There, I am MaRIA, Your Market Research Intelligence Assistant. How may I help you?