
- Market Size (2026)
- USD 684.8 Mn
- Forecast (2036)
- USD 1170.0 Mn
- CAGR (2026 to 2036)
- 5.5%
How big is Beeswax Market in 2026?
The beeswax market demonstrated steady progress from USD 648.5 million in 2025 to USD 684.8 million in 2026, building toward a targeted valuation of USD 1,170.0 million by 2036 at a CAGR of 5.5%.
Consumer demand for natural, biodegradable cosmetics and plastic-free food coatings is driving steady growth across the global beeswax market. Global beeswax industry size reached USD 648.5 million in 2025 and advances to an estimated USD 684.8 million in 2026. Total market valuation is on track to reach USD 1,170.0 million by 2036, progressing at a 5.5% compound annual growth rate between 2026 and 2036. FMI market tracking confirms that Yellow Crude and Filtered Beeswax secures a 54.6% share of 2026 product type valuation because simple clay filtration removes hive debris without chemical bleaching and keeps unit costs lower for buyers. Food and personal care manufacturers are adopting refined beeswax to lock in moisture and replace petroleum-derived waxes. Per a December 2025 review in Current Research in Food Science, beeswax E901 melts between 61 and 66 degrees Celsius and reduces moisture loss across natural food films by 20% to 40% [1]. This protective moisture barrier gives beeswax a clear functional edge over refined carnauba wax grades in creamy lip balms and soft confectionery glazes. In addition, April 2026 Food Research International findings confirmed that a 3 to 1 beeswax and glycerol monolaurate gel boosted krill oil capsule stability from 73.18% to 94.92% [4]. However, limited honeybee hive yields and the widespread adulteration of crude wax with cheap petroleum paraffin force buyers to run strict lab purity tests on every shipment through 2036.
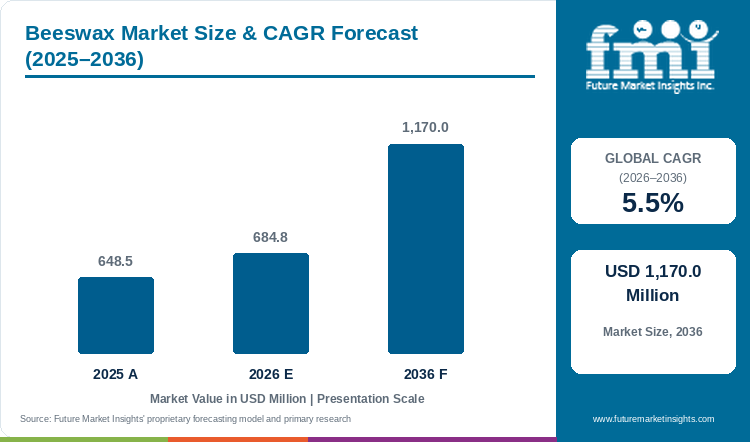
Key Market Trends & Insights
- By product type: Yellow Crude and Filtered Beeswax holds an estimated 54.6% share in 2026 because physical filtration preserves natural wax esters and golden color for balms and candles.
- By physical form: Pastilles, Pellets, and Beads represent 49.2% in 2026 since uniform wax beads melt quickly in heated mixing tanks without manual block cutting.
- By grade: Cosmetic and Personal Care USP/BP Grade accounts for 43.8% in 2026 as skin-care and lipstick manufacturers replace synthetic polyethylene waxes.
- By farming practice: Conventional Apiculture secures 76.8% in 2026 owing to large commercial beekeeping operations across North America and Europe as well as Asia.
- By food & pharma functionality: Edible oil gels and E901 confectionery glazes expand industrial demand as bakeries replace hydrogenated fats and synthetic tablet lubricants.
Regional Highlights
- Top national expansion: Germany leads national growth projections at a 5.9% CAGR through 2036 under pharmacopoeial wax refining and certified natural cosmetics manufacturing.
- Broader country progression: The United Kingdom tracks at a 5.7% CAGR ahead of the United States at 5.6% and France at 5.4%, whereas Japan progresses at a 5.2% CAGR.
Market Size & Forecast
Table 1: Market Size and Forecast for the Beeswax Market (USD million and CAGR percentage), 2025 to 2036
| Metric | Value |
|---|---|
| 2025 Market Size | USD 648.5 million |
| Estimated Market Size in 2026 | USD 684.8 million |
| Projected Market Size by 2036 | USD 1,170.0 million |
| CAGR, 2026 to 2036 | 5.5% |
| Added Market Value, 2026 to 2036 | USD 485.2 million |
Cosmetic and pharmaceutical manufacturers buying natural wax face a major quality challenge because raw honeycomb wax varies widely from one beekeeping region to another. Unrefined hive wax carries pollen and propolis stains with fluctuating acid levels that can cause skin creams to separate or lipsticks to sweat in warm stores. As detailed in an April 2026 paper in the International Journal of Molecular Sciences, honeybee waxes contain more than 300 distinct natural compounds that must be refined to strict pharmacopoeial standards before medical or cosmetic use [2]. To guarantee batch consistency on high-speed filling lines, personal care formulators blend refined beeswax with personal care cosmetic waxes to stabilize melting points and texture.
Refined Wax Volume and Active-Formulation Sizing
Table 2: Refined Wax Volume and Formulation Sizing for the Beeswax Market (USD million, thousand metric tons, and USD per kilogram), 2025 to 2036
| Metric | 2025 | 2026 | 2036 |
|---|---|---|---|
| Market size (USD million) | 648.5 | 684.8 | 1,170.0 |
| Commercial refined & filtered beeswax volume (thousand metric tons) | 69.5 to 75.2 | 72.8 to 78.8 | 114.5 to 124.0 |
| Cosmetic USP/BP & E901 food-grade volume (thousand metric tons) | 42.5 to 46.8 | 44.8 to 49.4 | 73.0 to 80.5 |
| Average commercial refined beeswax valuation per kilogram (USD) | 8.8 to 9.5 | 8.9 to 9.6 | 9.6 to 10.4 |
Operational note: Tonnage estimates track refined and bleached Apis wax shipments across cosmetic and E901 food glazing applications as well as pharmaceutical and candle uses.
Regulatory pressure to remove trans fats and cut saturated palm oil in commercial baked goods is opening a new demand avenue for food-grade beeswax. When bakeries try to replace solid shortenings with liquid vegetable oils alone, cookie and pastry doughs become oily and turn rancid on grocery shelves. Per a December 2025 study in Food Technology and Biotechnology, structuring liquid seed oil with just 3% to 5% beeswax creates a firm baking fat that holds 99.9% of its oil and stays fresh for 90 days in cookies [5]. Specialty refiners are supplying these food-grade wax pastilles with deodorized cosmetic beeswax to serve both clean-label bakeries and natural beauty brands.
Per Capita & Commercial Formulation Line Sizing
Table 3: Per Capita and Formulation Line Valuation Indicators for the Beeswax Market (USD and percentage share), 2025 to 2036
| Metric | 2025 | 2026 | 2036 |
|---|---|---|---|
| World population (billion) | 8.2 | 8.3 | 9.0 |
| Market value per 1,000 people (USD) | 79.1 | 82.5 | 130.0 |
| Annual market value per cosmetic & panning line (USD thousand) | 27.8 to 31.2 | 29.2 to 32.8 | 49.5 to 55.8 |
| Pastilles, pellets & micronized form share (%) | 61.0% to 65.0% | 62.5% to 66.5% | 71.0% to 75.0% |
Table 4: Industrial Processing and Channel Valuation Indicators for the Beeswax Market (USD million and line count), 2026
| Metric | Value | Institutional Reference Basis |
|---|---|---|
| Market size, 2026 | USD 684.8 million | 2026 global market valuation baseline |
| Commercial cosmetic kettle & confectionery panning lines | 22,400 lines | Global lip-care, cream emulsion, and E901 panning lines |
| Market value per formulation line | USD 30,571.4 | Annualized beeswax procurement valuation |
| USP/BP cosmetic grade market value, 2026 | USD 299.9 million | 43.8% grade allocation |
Home-fragrance and wood-care manufacturers moving away from petroleum waxes also face shrinkage and cracking issues when pouring pure natural wax into glass jars. In July 2025, Palsgaard opened a new application center in Navi Mumbai to help regional formulation teams test natural lipid and wax crystal structures [10]. To prevent container pull-away and improve surface gloss, wax compounders blend filtered beeswax with biodegradable bio-based waxes and petroleum paraffin waxes for smooth, even burning in premium candles.
Analyst Perspective
"Cosmetic chemists and confectionery panners do not purchase beeswax as an ungraded agricultural byproduct, since they demand zero-paraffin gas-chromatography certificates and pesticide-free pastilles. Refiners that combine European and U.S. pharmacopoeial bleaching with automated bead prilling will capture premium personal care and pharmaceutical contracts through 2036."
- Nandini Roy Choudhury, Principal Consultant, Future Market Insights.
How is the beeswax market segmented?
The beeswax market is segmented by product type and physical form with grade and farming practice. In 2026, Yellow Crude and Filtered Beeswax is projected at 54.6% and Pastilles, Pellets, and Beads at 49.2%, while Cosmetic and Personal Care USP/BP Grade holds 43.8% and Conventional Apiculture accounts for 76.8%.
By product type: Yellow Crude and Filtered Beeswax with White Bleached and Refined Beeswax and Absolute and Fractional Beeswax.
By physical form: Pastilles, Pellets, and Beads with Slabs, Blocks, and Bars and Micronized Powders and Emulsions.
By grade: Cosmetic and Personal Care USP/BP Grade with Food Glazing and Confectionery E901 Grade as well as Pharmaceutical Coating and Ointment Grade plus Technical Candle and Wood Polish Grade.
By farming practice: Conventional Apiculture and Certified Organic Apiculture.
Why does Yellow Crude and Filtered Beeswax lead the product type category?
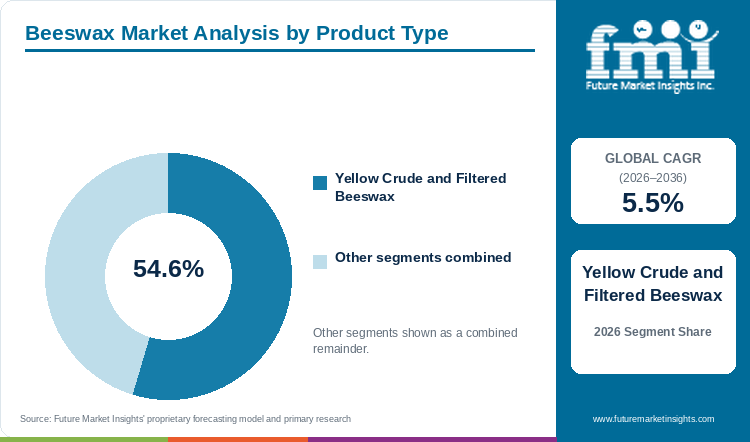
Yellow Crude and Filtered Beeswax holds an estimated 54.6% of product type demand in 2026, anchored by broad multi-industry utility and lower refining loss.
Table 5: Product Type Share for the Beeswax Market (percentage share), 2026
| Product Type | Share (2026) |
|---|---|
| Yellow Crude and Filtered Beeswax | 54.6% |
| Other Segments Combined | 45.4%* |
| Total | 100.0% |
*Note: Other product type categories (White Bleached and Refined Beeswax and Absolute and Fractional Beeswax) represent the remaining share of 2026 beeswax volume.
Table 6: Product Type Leadership and Market Growth for the Beeswax Market (segment share and CAGR percentage), 2026 to 2036
| Metric | Value |
|---|---|
| Global CAGR (2026 to 2036) | 5.5% |
| Leading Segment | Yellow Crude and Filtered Beeswax (54.6% share in 2026) |
Many natural skin-balm and candle brands prefer unbleached yellow beeswax because buyers associate its warm golden color and mild honey scent with authentic, minimally processed ingredients. Clay filtration of melted hive cappings removes physical dirt while keeping all native wax esters intact and avoiding bleaching costs. Producers of premium scented candle blends and herbal ointments rely on filtered yellow grades to deliver natural aroma and rich texture at an economical price point.
- Yellow Crude and Filtered Beeswax holds 54.6% of product type value in 2026 because unbleached filtered wax serves both finished natural balms and bulk feedstock for white wax refiners.
- Per a September 2025 study in Scientific Reports, hydroethanolic Apis mellifera beeswax extracts contain chlorogenic acid at 878.80 ug per gram and gallic acid at 421.13 ug per gram with 90.2% anti-inflammatory activity [11].
What sustains Pastilles, Pellets, and Beads leadership in physical form?
Pastilles, Pellets, and Beads represent 49.2% of the physical form category in 2026, supported by pneumatic conveying compatibility and rapid kettle melting.
In large cosmetic and food factories, handling heavy 25-kilogram solid wax blocks slows down production because workers must manually cut and pre-melt the slabs. Uniform wax pastilles and beads solve this bottleneck by pouring cleanly from bags or automated hoppers and melting in a fraction of the time inside heated mixing tanks. Faster melting also prevents overheating and discoloration of sensitive cosmetic emulsions.
- Pastilles, Pellets, and Beads account for 49.2% of physical form demand in 2026 as contract manufacturers automate ingredient weighing and reduce kettle heating time by up to 35%.
- According to a March 2025 study in the Journal of the Science of Food and Agriculture, adding 200 mg per gram of beeswax to oil emulsions increased antioxidant quercetin loading and delivery by 285.55% [9].
How does Cosmetic and Personal Care USP/BP Grade lead the grade segment?
Cosmetic and Personal Care USP/BP Grade accounts for 43.8% of grade value in 2026, driven by lip-care sticks and natural barrier creams.
Skin-care and makeup brands cannot use raw agricultural wax in facial creams or lipsticks because trace pollen proteins and hive impurities can trigger skin irritation. USP and BP pharmacopoeial cosmetic grades undergo activated-carbon and clay refining to strip out allergens and lock in strict acid-value specifications. Formulators making lipsticks and mascaras with soothing barrier creams depend on USP/BP grades for smooth skin feel and firm stick structure.
- Cosmetic and Personal Care USP/BP Grade secures 43.8% of grade demand in 2026 because global beauty companies mandate pharmacopoeial purity and zero pesticide residues.
- A February 2026 study in RSC Advances showed that beeswax nano-formulations achieved 87.6% to 91.3% active encapsulation efficiency with a 115.68 nm particle size for skin wound repair [6].
Why does Conventional Apiculture lead the farming practice category?
Conventional Apiculture secures 76.8% of farming practice volume in 2026, supported by commercial pollination fleets and established rendering networks.
Certified organic beeswax is difficult to produce at scale because organic rules require hives to forage several kilometers away from any sprayed farmland or industrial area. Because most commercial honeybees are used to pollinate conventional orchards and row crops, organic wax remains scarce and expensive. As a result, industrial wax buyers source conventional hive cappings and rely on activated-carbon filtration at the refinery to remove trace agricultural residues.
- Conventional Apiculture represents 76.8% of farming practice demand in 2026 as buyers use post-harvest clay and carbon refining to achieve high purity from commercial pollination hives.
- In September 2026, researchers reporting in Gels demonstrated that an 8% beeswax gel inside a 50 to 50 foamed emulsion achieved 98.62% thermal stability as a clean-label fat replacer in dessert mousses [7].
How do E901 Food Glazing and Pharmaceutical Tablet Coating expand specialty demand?
Food Glazing E901 and Pharmaceutical Coating grades represent the fastest-growing specialty tiers through 2036, driven by starch-beeswax tablet lubricants and fruit coatings.
Confectionery makers and pharmaceutical tablet plants are actively looking for natural alternatives to synthetic mineral-oil glazes and chemical tablet lubricants. In gummy candies and fresh citrus packing, white E901 beeswax paired with commercial food glazing agents and hydrophobic edible films and coatings prevents pieces from sticking together in humid weather and keeps fruit firm during shipping.
- Per a July 2026 study in Pharmaceutics, a 7 to 3 spray-dried rice starch and beeswax composite lubricant reduced tablet ejection force from 386.5 N to 89.2 N while keeping tablet friability at just 0.16% [3].
- A November 2025 study in the Journal of the Science of Food and Agriculture confirmed that a 6 to 4 to 0.5 corn and mustard oil gel structured with beeswax raised processed cheese antioxidant activity from 31.86% to 63.30% [8].
What are the drivers, restraints, and opportunities in the beeswax market?
In the beeswax market, microplastic cosmetic phase-outs and edible oleogel fat replacement drive adoption whereas colony losses and paraffin adulteration restrain crude supply and co-processed pharmaceutical lubricants create high-margin growth.
- Driver: Cosmetic brands in Europe and North America replace synthetic polyethylene microbeads and petroleum paraffins with biodegradable USP/BP beeswax.
- Restraint: Honeybee colony mortality and synthetic miticide accumulation in hive comb with illicit paraffin spiking tighten authentic crude wax availability.
- Opportunity: Co-processed starch-beeswax tablet lubricants and trans-fat-free bakery oleogels open high-value pharmaceutical and food ingredient channels.
Growth Analysis and Future Potential: Qualitative Demand Catalysts
Government bans on synthetic microplastics in personal care products and consumer demand for natural ingredient labels are the core drivers propelling beeswax demand. Beauty brands are reformulating lip balms and sunscreens with natural beeswax pastilles to achieve water resistance and creamy texture without synthetic polymers. In April 2025, Koster Keunen showcased new Silken Creme Lip Gloss and Skin Harmony Balm formulations at in-cosmetics Global combining natural beeswax with Kester Wax plasticizers to prevent oil syneresis in clean-beauty sticks [13]. Confectionery and produce packers also combine E901 beeswax with confectionery panning coatings and post-harvest fruit firmness additives to extend retail shelf life naturally.
Risk Assessment of the Beeswax Market: Operational and Formulation Friction
Climate-driven swings in hive yields and widespread adulteration with cheap petroleum paraffin represent the biggest hurdles restraining the beeswax market. Because bees must consume roughly six to eight kilograms of honey to secrete a single kilogram of wax, natural hive supply suffers whenever extreme heat hits apiaries. A July 2025 study in PLOS ONE analyzing beekeeping districts confirmed that rising ambient temperatures showed a strong negative correlation with beeswax production at r = -0.84 and p = 0.002, accounting for 74.1% of harvest variance [12]. When raw wax supply tightens, some traders melt cheap paraffin into crude blocks, forcing buyers to test incoming lots with gas chromatography.
Commercial Opportunity Analysis: Formulation Differentiation and Value-Add Formats
Wax refiners are creating lucrative growth opportunities by moving beyond simple bulk slabs into structured bakery fat replacers and clean-label food coatings. Results from a January 2026 Food Chemistry investigation show that beeswax oleogels exhibit a clean melting profile below 50 degrees Celsius that avoids waxy mouthfeel when replacing solid coconut and palm fats in bakery fillings [14]. In January 2026, researchers in Foods also demonstrated that structuring extra virgin olive oil with beeswax measurably lowered polar thermal degradation compounds during heating at p = 0.028 [15]. Refiners that offer pesticide-free pastilles and custom-engineered wax blends are winning multi-year supply contracts with pharmaceutical and clean-label food companies through 2036.
Beeswax Market by Country (2026 to 2036)
FMI country modeling indicates that Germany leads beeswax market expansion at a 5.9% CAGR from 2026 to 2036, followed by the United Kingdom at 5.7% and the United States at 5.6%. France advances at 5.4%, whereas Japan progresses at a 5.2% CAGR.
Table 7: Country CAGR and Primary Growth Levers for the Beeswax Market (CAGR percentage), 2026 to 2036
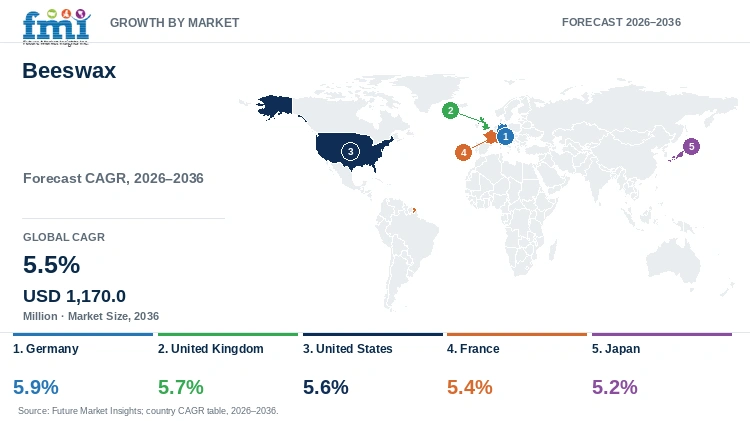
| Country | CAGR (2026 to 2036) | Primary Growth Lever |
|---|---|---|
| Germany | 5.9% | European Pharmacopoeia wax refining hubs and NATRUE natural cosmetics manufacturing |
| United Kingdom | 5.7% | Anhydrous beauty stick formulation and E901 confectionery panning demand |
| United States | 5.6% | USP cosmetic pastille processing and clean-label citrus and gummy coatings |
| France | 5.4% | Luxury dermo-cosmetic emulsions and absolute beeswax perfumery extraction |
| Japan | 5.2% | Precision pharmaceutical tablet polishing and ultra-low-odor white beeswax sticks |
Source: Future Market Insights analysis
Germany Beeswax Market Outlook (2026 to 2036)
Germany leads European beeswax expansion at a 5.9% annual growth rate through 2036 because its Hamburg and Bremen refineries function as the primary processing and distribution hub for the entire European Union. Domestic refiners import crude cappings wax from Africa and South America and purify it into European Pharmacopoeia white and yellow pastilles. Statistics from the January 2026 U.S. Department of Agriculture Berlin report GM2026-0003 show that national organic retail demand reached record volume across over 2,200 organic shops and mainstream grocery chains [16]. In addition, Norevo GmbH renewed its COSMOS-approved raw material certification in 2025 to supply certified natural waxes to European cosmetic and confectionery plants [17].
Key takeaway: In Germany, European Pharmacopoeia wax refining and certified natural cosmetics manufacturing anchor a leading 5.9% CAGR through 2036.
United Kingdom Beeswax Market Outlook (2026 to 2036)
Demand in the United Kingdom rises at a 5.7% CAGR through 2036, driven by a strong domestic contract beauty industry and supermarket clean-label bakery reformulation. Unlike continental refiners focused on bulk industrial exports, UK wax processors specialize in British Pharmacopoeia ointment bases and custom-blended pastilles for waterless beauty sticks and luxury candles. Trade analysis in the November 2025 U.S. Department of Agriculture London report UK2025-0035 indicates that food and personal-care retailers across the country are accelerating private-label reformulation toward sustainably sourced, plastic-free ingredients [18]. Domestic biscuit and confectionery makers are adopting E901 beeswax glazes and low-saturate wax oleogels to replace palm stearin and mineral oil.
Key takeaway: In the United Kingdom, British Pharmacopoeia ointment production and anhydrous beauty stick manufacturing drive a 5.7% annual growth rate.
United States Beeswax Market Outlook (2026 to 2036)
The United States beeswax market expands at a 5.6% CAGR between 2026 and 2036, supported by large-scale USP cosmetic manufacturing and fresh-produce packhouse glazing in California and Florida. Refiners in Connecticut and New York blend domestic clover beeswax with imported organic lots to supply lip-care brands and gummy candy panners across North America. A June 2026 study in the Journal of Food Science demonstrated that combining monoglycerides with refined beeswax in sunflower and camelina oil oleogels creates a stable solid fat replacer for commercial bakery filling creams [19]. Personal care and specialty food brands across the United States rely on domestic USP pastille refiners for zero-paraffin certification.
Key takeaway: In the United States, USP cosmetic pastille refining and clean-label bakery and confectionery coatings support a 5.6% CAGR.
France Beeswax Market Outlook (2026 to 2036)
France achieves a 5.4% annual growth pace through 2036 because its prestige dermo-cosmetic laboratories and Grasse perfume houses consume high-margin white bleached wax and floral wax absolutes rather than cheap technical grades. Skin-care chemists in France require ultra-pure white beeswax and functionalized wax esters to formulate rich cold creams and water-resistant sunscreens that do not clog pores. Commercial filings in the April 2025 U.S. Department of Agriculture Paris report FR2025-0004 confirm that 19,000 domestic culinary and specialty ingredient producers across France prioritize traceable natural raw materials for domestic and export markets [20]. Patisserie and chocolate houses across metropolitan France also use E901 beeswax glazes for fine confections.
Key takeaway: In France, luxury dermo-cosmetic emulsions and Grasse perfumery beeswax absolutes sustain a 5.4% CAGR through 2036.
Japan Beeswax Market Outlook (2026 to 2036)
Japan records a 5.2% CAGR through 2036, distinguished by buyer demand for odorless, non-peroxide sun-bleached white beeswax used in precision color cosmetics and sugar-coated Kampo herbal tablets. Because consumers in Japan strongly dislike heavy wax odors in facial makeup and hair pomades, domestic formulators enforce tight acid-value and melting-point specifications on imported pastilles. Buyer surveys from the October 2026 U.S. Department of Agriculture Tokyo report JA2026-0017 confirm that more than 72,000 food and ingredient buyers across 3,000 booths emphasized clean-label functional foods and shelf-stable natural coatings [21]. Pharmaceutical and cosmetic makers across Tokyo and Osaka use sun-bleached white beeswax to protect delicate actives in tablets and lipsticks.
Key takeaway: In Japan, ultra-low-odor white cosmetic wax specifications and precision tablet polishing support a 5.2% CAGR through 2036.
Full report country CAGRs cover North America and Latin America with Western and Eastern Europe. Regional modeling also encompasses East Asia and South Asia and Pacific with the Middle East and Africa.
Who are the notable companies in the beeswax market?
Koster Keunen Inc. and Strahl & Pitcairn LLC with Poth Hille & Co. Ltd., ter Hell & Co. GmbH, Paramold Manufacturing LLC and Arjun Bees Wax Industries are the notable companies in the beeswax market.
Competitive positioning in the beeswax industry separates global pharmacopoeial wax refiners and esterification innovators from European distribution specialists and origin rendering exporters.
- Global Pharmacopoeial Wax Refiners and Derivative Innovators: Koster Keunen Inc. and Strahl & Pitcairn LLC operate multi-continent bleaching and prilling plants with wax-ester derivatization lines serving multinational beauty and pharma groups.
- European Specialty Wax Refiners and Technical Compounders: Poth Hille & Co. Ltd. and ter Hell & Co. GmbH supply BP/Ph. Eur. certified beeswax pastilles and E901 food glazing blends with custom micro-wax compounds across Europe.
- Specialized Industrial Prillers and Origin Exporters: Paramold Manufacturing LLC and Arjun Bees Wax Industries provide custom pastillation and investment-casting wax blends with bulk filtered Apis mellifera and Apis dorsata slabs.
Competitive Benchmarking: Beeswax Market
Table 8: Competitive Benchmarking for the Beeswax Market (qualitative capability ratings and geographic reach)
| Company | USP/BP/Ph. Eur. Refining | Pastillation & Emulsion Engineering | Traceable Apiculture Sourcing | Geographic Reach |
|---|---|---|---|---|
| Koster Keunen Inc. | High | High | High | United States and Netherlands refining hubs with West African sustainable beekeeping network |
| Strahl & Pitcairn LLC | High | High | High | North America and global specialty cosmetic and food-grade natural wax refining |
| Poth Hille & Co. Ltd. | High | High | Medium | United Kingdom and European BP/Ph. Eur. beeswax refining and slab/pastille supply |
| ter Hell & Co. GmbH | High | High | High | Germany and global specialty wax distribution, refining, and E901 glazing blends |
| Paramold Manufacturing LLC | Medium | High | Medium | United States custom wax compounding, prilling, and precision industrial wax blends |
| Arjun Bees Wax Industries | High | Medium | High | India origin Apis refining and bulk yellow and white beeswax export to Europe and USA |
Scoring basis: USP/BP/Ph. Eur. Refining evaluates documented pharmacopoeial bleaching and pesticide adsorption with gas-chromatography purity testing, whereas Pastillation & Emulsion Engineering rates bead prilling and functionalized wax derivatives. Traceable Apiculture Sourcing measures direct apiary collection programs and zero-paraffin authenticity auditing.
Key Developments in the Beeswax Market
- Pharmaceutical excipients researchers demonstrated in July 2026 that a 7 to 3 co-processed rice starch and beeswax composite cuts tablet ejection force from 386.5 N to 89.2 N as a natural lubricant replacement [3].
- Food lipid scientists reported in April 2026 that a 3 to 1 composite beeswax and glycerol monolaurate oleogel raises krill oil microencapsulation efficiency from 73.18% to 94.92% while cutting surface oil to 1.24% [4].
- Dermatological formulators published a February 2026 study showing that synergistic beeswax nano-formulations achieve 87.6% to 91.3% encapsulation efficiency with 115.68 nm particle size for chronic wound care [6].
- Bakery technologists confirmed in December 2025 that cookies formulated with 3% to 5% beeswax oleogels retain 99.9% oil-binding capacity over 90 days of ambient storage as trans-fat-free shortening replacements [5].
Key Players in the Beeswax Market
Global Pharmacopoeial Wax Refiners and Derivative Innovators
- Koster Keunen Inc.
- Strahl & Pitcairn LLC
European Specialty Wax Refiners and Technical Compounders
- Poth Hille & Co. Ltd.
- ter Hell & Co. GmbH
Specialized Industrial Prillers and Origin Exporters
- Paramold Manufacturing LLC
- Arjun Bees Wax Industries
Beeswax Market - Report Scope
Table 9: Report Scope for the Beeswax Market (coverage fields and definitions), 2026 to 2036
| Coverage field | Report scope |
|---|---|
| Market breakdown | Product Type and Physical Form with Grade and Farming Practice |
| Quantitative Units | USD Million |
| Market Definition | Commercial B2B supplier valuation of yellow crude and filtered beeswax with white bleached and refined beeswax and absolute or fractional beeswax across pastilles, slabs, and micronized emulsions for cosmetic, E901 food glazing, pharmaceutical, and candle applications. Excludes synthetic petroleum paraffin and raw honey. |
| Regions Covered | North America and Latin America with Western Europe, Eastern Europe, East Asia, South Asia and Pacific and Middle East and Africa |
| Countries Covered | United States and Germany with France, Japan and United Kingdom plus additional national markets |
| Key Companies Covered | Koster Keunen Inc. and Strahl & Pitcairn LLC with Poth Hille & Co. Ltd., ter Hell & Co. GmbH, Paramold Manufacturing LLC and Arjun Bees Wax Industries |
| Forecast Period | 2026 to 2036 |
| Approach | Primary and secondary research with top-down cosmetic and food wax baselines and bottom-up refined Apis wax tonnage triangulation. |
Beeswax Market - Research Methodology
Table 10: Research Methodology for the Beeswax Market (research methods and approaches)
| Method | Approach |
|---|---|
| Primary Research | Structured interviews with pharmacopoeial wax refiners and cosmetic emulsion chemists with E901 confectionery panning managers and commercial apiary cooperatives to validate crude-to-refined yield losses. |
| Secondary Research | Analysis of USP, BP, and European Pharmacopoeia monographs with EFSA E901 glazing evaluations and PubMed/PMC oleogel and excipient studies. |
| Market Sizing and Forecasting | Top-down natural cosmetic and food wax baselines reconciled against bottom-up refined beeswax tonnage (72.8K to 78.8K MT in 2026) and grade-weighted prices per kilogram from 2026 to 2036. |
| Country Forecasting Model | Econometric national projections weight anhydrous cosmetic production and microplastic substitution mandates with pharmaceutical and confectionery coating lines across five priority countries. |
| Operational Benchmark Traceability | Refined wax volume and formulation line indicators in Tables 2, 3, and 4 trace to Current Research in Food Science E901 film studies and Pharmaceutics tablet lubricant trials with Food Research International oleogel assays. |
| Data Triangulation and Validation | Valuation estimates isolate B2B refined, filtered, bleached, and fractionated beeswax ingredients while strictly excluding synthetic petroleum waxes, plant carnauba or candelilla waxes, and retail candle markups. |
Beeswax Market by Segments
Beeswax Market segmented by Product Type:
- Yellow Crude and Filtered Beeswax
- White Bleached and Refined Beeswax
- Absolute and Fractional Beeswax
Beeswax Market segmented by Physical Form:
- Pastilles, Pellets, and Beads
- Slabs, Blocks, and Bars
- Micronized Powders and Emulsions
Beeswax Market segmented by Grade:
- Cosmetic and Personal Care USP/BP Grade
- Food Glazing and Confectionery E901 Grade
- Pharmaceutical Coating and Ointment Grade
- Technical Candle and Wood Polish Grade
Beeswax Market segmented by Farming Practice:
- Conventional Apiculture
- Certified Organic Apiculture
Beeswax Market by Region
- North America
- United States
- Canada
- Latin America
- Brazil
- Mexico
- Argentina
- Chile
- Western Europe
- Germany
- France
- United Kingdom
- Italy
- Spain
- Benelux
- Nordics
- Eastern Europe
- Poland
- Czech Republic
- Romania
- Hungary
- East Asia
- China
- Japan
- South Korea
- South Asia and Pacific
- India
- ASEAN
- Australia and New Zealand
- Middle East and Africa
- GCC Countries
- South Africa
- Türkiye
- Israel
Research Sources and Bibliography
- [1] Li, X., Chen, H., Gasti, T., Marangoni Junior, L., Vieira, R. P., de Oliveira Filho, J. G., & Tian, W. (2025, December 27). Bee products in biopolymer films/coatings: Advancing sustainable active packaging for food preservation. Current Research in Food Science, 12, 101292 (PMCID PMC12856263).
- [2] Huanbutta, K., Chuttong, B., Danmek, K., Sriamornsak, P., Suwanpitak, K., & Sangnim, T. (2026, April 13). Beeswax in Pharmaceutical Sciences: A Comprehensive Review of Its Chemical Composition, Functional Applications, Types, and Formulation Roles. International Journal of Molecular Sciences, 27(8), 3486 (PubMed PMID 42074130).
- [3] Kittipongpatana, O. S., Trisopon, K., Phongphisutthinant, R., Chaipoot, S., & Kittipongpatana, N. (2026, July 28). Co-Processed Starch-Beeswax Composites as Natural Tablet Lubricants: Preparation, Characterization, and Performance Evaluation. Pharmaceutics, 18(8), 925 (PubMed PMID 42654042).
- [4] Sun, X., Song, L., Wang, R. Y., Ha, X. Y., Yin, F. W., Qin, L., Zhu, B. W., & Zhou, D. Y. (2026, April 30). Composite beeswax-glycerol monolaurate oleogelation enhances encapsulation efficiency and oxidative stability of microencapsulated Antarctic krill oil. Food Research International, 237, 119323 (PubMed PMID 42169287).
- [5] Jansen-Alves, C., da Cruz, E. P., Santos, R. S., Pacheco, C. O., Perleberg, C., Hackbart, H. C. S., de Pereira, C. M. P., Dias, A. R. G., & Zavareze, E. R. (2025, December 26). Replacing Hydrogenated Fat in Cookies with Oleogels Based on Butia odorata Seed Oil and Beeswax. Food Technology and Biotechnology, 63(4), 425 to 436 (PubMed PMID 41426364).
- [6] Eid, A. M., Alawami, A. S., Allam, A. A., Mahgoub, S. M., Soliman, A. G., Shahin, N., Roushdy, M. M., & Mahmoud, R. (2026, February 20). Synergistic beeswax-based nano-formulation for enhanced chronic wound healing and antibacterial potency. RSC Advances, 16(12), 10822 to 10846 (PubMed PMID 41788341).
- [7] Akcicek, A. (2026, September 3). Fabrication of Beeswax-Soapwort Root Powder-Gelatin Bigel-Based Foamed Emulsions for Use as a Fat Replacer in Mousse. Gels, 12(9), 810 (PMCID PMC13606560).
- [8] Hashim, A. F., Shazly, A. B., & El-Sayed, S. M. (2025, November 19). Development and optimization of oleogels based on beeswax, corn and mustard oils as a healthy fat model for prospective processed cheese production. Journal of the Science of Food and Agriculture, 106(4), 2111 to 2125 (PubMed PMID 41255291).
- [9] Zhang, D., Zhong, R., Liao, Z., Wang, X., Xiang, P., Zhang, A., Su, N., Cao, Y., & Lan, Y. (2025, March 15). Fabrication of interfacial crystallized oleogel emulsion for quercetin delivery with enhanced environmental stability and bioaccessibility. Journal of the Science of Food and Agriculture, 105(4), 2226 to 2235 (PubMed PMID 39497576).
- [10] Palsgaard. (2025, July 8). Palsgaard Inaugurates State-of-the-Art Application Centre in Navi Mumbai to Strengthen Regional Customer Support. Palsgaard A/S Newsroom.
- [11] Mekky, A. E., El-Barkey, N. M., Abd El Halim, H. M., Nasser, S. A., Mahmoud, N. N., Zahra, A. A., & Nasr-Eldin, M. A. (2025, September 12). Exploring the potential of hydro alcoholic crude extract of beeswax as antibacterial antifungal antiviral antiinflammatory and antioxidant agent. Scientific Reports, 15(1), 32512 (PMCID PMC12432216).
- [12] Kamatara, K., Mwakaje, A. G., & Nindi, S. J. (2025, July 18). Honey and beeswax production amidst climate variability in two agro-ecological zones of Singida and Njombe regions, Tanzania. PLOS ONE, 20(7), e0326415 (PubMed PMID 40679531).
- [13] Koster Keunen, Inc. (2025, April 8). Launching New Ingredient Innovations at in-cosmetics Global 2025. Koster Keunen Corporate Newsroom.
- [14] Chuesiang, P., Sanguansri, L., & Sonwai, S. (2026, January 16). Functional evaluation of wax-based oleogels as solid fat replacers in coconut and canola oil systems. Food Chemistry, 495, 146312 (PMCID PMC12905348).
- [15] Gomez-Estaca, J., Pintado, T., & Cofrades, S. (2026, January 28). Thermo-Oxidative Stability and Functional Properties of Extra Virgin Olive Oil Oleogels Structured with Beeswax. Foods, 15(3), 418 (PMCID PMC12939712).
- [16] USDA Foreign Agricultural Service. (2026, January 29). Germany: Large Retail Chains Support Record Year for German Organic Sales. U.S. Department of Agriculture GAIN Report GM2026-0003.
- [17] Norevo GmbH. (2025, January 27). Norevo COSMOS Approved Natural Raw Materials Attestation 2025. Norevo GmbH Quality Documentation.
- [18] USDA Foreign Agricultural Service. (2025, November 19). United Kingdom: Retail Foods Annual. U.S. Department of Agriculture GAIN Report UK2025-0035.
- [19] Yilmaz, E., & Demirci, M. (2026, June 10). A Novel Approach to Reducing Saturated Fatty Acids in Filling Creams Using Oleogels With Monoglyceride and Beeswax. Journal of Food Science, 91(6), e71169 (PubMed PMID 42299107).
- [20] USDA Foreign Agricultural Service. (2025, April 2). France: Food Processing Ingredients Annual. U.S. Department of Agriculture GAIN Report FR2025-0004.
- [21] USDA Foreign Agricultural Service. (2026, October 20). Japan: FOODEX Japan 2026 Report. U.S. Department of Agriculture GAIN Report JA2026-0017.
This bibliography is provided for reader reference and is not exhaustive. The full report contains the complete reference list and detailed citations.
This Report Answers
- How large is the beeswax market in 2026 and what is forecast for 2036?
- Which microplastic cosmetic phase-out and trans-fat replacement pressures support beeswax demand?
- Why does Yellow Crude and Filtered Beeswax lead the product type category?
- Why do Pastilles, Pellets, and Beads lead the physical form category globally?
- How do growth rates differ across Germany and the United Kingdom compared with the United States and France?
- Which leading companies operate USP/BP wax refining hubs versus origin cappings rendering?
- What limits organic hive wax supply or causes paraffin adulteration risks in the beeswax market?
- What should cosmetic and pharmaceutical buyers evaluate before qualifying refined beeswax pastilles?
Table of Content
Table of Content
- Key Takeaways
- Market Size and CAGR
- Top Growth Driver
- Fastest Growing Segment
- Leading Region
- Key Companies
- Emerging Opportunities
- Executive Summary
- Global Market Outlook
- Demand-side Trends
- Supply-side Trends
- Technology Roadmap Analysis
- Analysis and Recommendations
- Analyst Perspective (What is happening? Why now? What should investors know?)
- Key Questions Answered
- How large is the market?
- What is the CAGR?
- What are key trends?
- Which region dominates?
- Who are the leaders?
Read More...
- Market Overview
- Market Coverage / Taxonomy
- Market Definition / Scope / Limitations
- Research Methodology
- Chapter Orientation
- Analytical Lens and Working Hypotheses
- Market Structure, Signals, and Trend Drivers
- Benchmarking and Cross-market Comparability
- Market Sizing, Forecasting, and Opportunity Mapping
- Research Design and Evidence Framework
- Desk Research Programme (Secondary Evidence)
- Expert Input and Fieldwork (Primary Evidence)
- Tooling, Models, and Reference Databases
- Data Engineering and Model Build
- Quality Assurance and Audit Trail
- Market Background
- Market Dynamics (Drivers, Restraints, Opportunity, Trends)
- Scenario Forecast (Optimistic, Likely, Conservative)
- Impact Analysis
- AI Impact
- Sustainability Impact
- Regulatory Impact
- Technology Impact
- Consumer / Buyer Analysis
- Purchase Drivers
- Adoption Barriers
- Buyer Journey
- Opportunity Map Analysis
- Product Life Cycle Analysis
- Supply Chain Analysis
- Investment Feasibility Matrix
- Value Chain Analysis
- PESTLE and Porter's Analysis
- Regulatory Landscape
- Regional Parent Market Outlook
- Production and Consumption Statistics
- Import and Export Statistics
- Global Market Analysis and Forecast, 2021 to 2036
- Historical Market Size Value (USD Million) Analysis, 2021 to 2025
- Current and Future Market Size Value (USD Million) Projections, 2026 to 2036
- Y-o-Y Growth Trend Analysis
- Absolute $ Opportunity Analysis
- Global Market Pricing Analysis, 2021 to 2036
- Global Market Analysis and Forecast, By Product Type, 2021 to 2036
- Introduction / Key Findings
- Historical Market Size Value (USD Million) Analysis By Product Type, 2021 to 2025
- Current and Future Market Size Value (USD Million) Analysis and Forecast By Product Type, 2026 to 2036
- Yellow Crude and Filtered Beeswax
- White Bleached and Refined Beeswax
- Absolute and Fractional Beeswax
- Y-o-Y Growth Trend Analysis By Product Type, 2021 to 2025
- Absolute $ Opportunity Analysis By Product Type, 2026 to 2036
- Global Market Analysis and Forecast, By Physical Form, 2021 to 2036
- Introduction / Key Findings
- Historical Market Size Value (USD Million) Analysis By Physical Form, 2021 to 2025
- Current and Future Market Size Value (USD Million) Analysis and Forecast By Physical Form, 2026 to 2036
- Pastilles, Pellets, and Beads
- Slabs, Blocks, and Bars
- Micronized Powders and Emulsions
- Y-o-Y Growth Trend Analysis By Physical Form, 2021 to 2025
- Absolute $ Opportunity Analysis By Physical Form, 2026 to 2036
- Global Market Analysis and Forecast, By Grade, 2021 to 2036
- Introduction / Key Findings
- Historical Market Size Value (USD Million) Analysis By Grade, 2021 to 2025
- Current and Future Market Size Value (USD Million) Analysis and Forecast By Grade, 2026 to 2036
- Cosmetic and Personal Care USP/BP Grade
- Food Glazing and Confectionery E901 Grade
- Pharmaceutical Coating and Ointment Grade
- Technical Candle and Wood Polish Grade
- Y-o-Y Growth Trend Analysis By Grade, 2021 to 2025
- Absolute $ Opportunity Analysis By Grade, 2026 to 2036
- Global Market Analysis and Forecast, By Farming Practice, 2021 to 2036
- Introduction / Key Findings
- Historical Market Size Value (USD Million) Analysis By Farming Practice, 2021 to 2025
- Current and Future Market Size Value (USD Million) Analysis and Forecast By Farming Practice, 2026 to 2036
- Conventional Apiculture
- Certified Organic Apiculture
- Y-o-Y Growth Trend Analysis By Farming Practice, 2021 to 2025
- Absolute $ Opportunity Analysis By Farming Practice, 2026 to 2036
- Global Market Analysis and Forecast, By Region, 2021 to 2036
- Introduction
- Historical Market Size Value (USD Million) Analysis By Region, 2021 to 2025
- Current Market Size Value (USD Million) Analysis and Forecast By Region, 2026 to 2036
- North America
- Latin America
- Western Europe
- Eastern Europe
- East Asia
- South Asia and Pacific
- Middle East and Africa
- Market Attractiveness Analysis By Region
- North America Market Analysis and Forecast, By Country, 2021 to 2036
- Historical Market Size Value (USD Million) Trend Analysis By Market Taxonomy, 2021 to 2025
- Market Size Value (USD Million) Forecast By Market Taxonomy, 2026 to 2036
- By Country
- United States
- Canada
- By Product Type
- By Physical Form
- By Grade
- By Farming Practice
- By Country
- Market Attractiveness Analysis
- By Country
- By Product Type
- By Physical Form
- By Grade
- By Farming Practice
- Key Takeaways
- Latin America Market Analysis and Forecast, By Country
- Historical Market Size Value (USD Million) Trend Analysis By Market Taxonomy, 2021 to 2025
- Market Size Value (USD Million) Forecast By Market Taxonomy, 2026 to 2036
- By Country
- Brazil
- Mexico
- Argentina
- Chile
- By Product Type
- By Physical Form
- By Grade
- By Farming Practice
- By Country
- Market Attractiveness Analysis
- By Country
- By Product Type
- By Physical Form
- By Grade
- By Farming Practice
- Key Takeaways
- Western Europe Market Analysis and Forecast, By Country
- Historical Market Size Value (USD Million) Trend Analysis By Market Taxonomy, 2021 to 2025
- Market Size Value (USD Million) Forecast By Market Taxonomy, 2026 to 2036
- By Country
- Germany
- France
- United Kingdom
- Italy
- Spain
- Benelux
- Nordics
- By Product Type
- By Physical Form
- By Grade
- By Farming Practice
- By Country
- Market Attractiveness Analysis
- By Country
- By Product Type
- By Physical Form
- By Grade
- By Farming Practice
- Key Takeaways
- Eastern Europe Market Analysis and Forecast, By Country
- Historical Market Size Value (USD Million) Trend Analysis By Market Taxonomy, 2021 to 2025
- Market Size Value (USD Million) Forecast By Market Taxonomy, 2026 to 2036
- By Country
- Poland
- Czech Republic
- Romania
- Hungary
- By Product Type
- By Physical Form
- By Grade
- By Farming Practice
- By Country
- Market Attractiveness Analysis
- By Country
- By Product Type
- By Physical Form
- By Grade
- By Farming Practice
- Key Takeaways
- East Asia Market Analysis and Forecast, By Country
- Historical Market Size Value (USD Million) Trend Analysis By Market Taxonomy, 2021 to 2025
- Market Size Value (USD Million) Forecast By Market Taxonomy, 2026 to 2036
- By Country
- China
- Japan
- South Korea
- By Product Type
- By Physical Form
- By Grade
- By Farming Practice
- By Country
- Market Attractiveness Analysis
- By Country
- By Product Type
- By Physical Form
- By Grade
- By Farming Practice
- Key Takeaways
- South Asia and Pacific Market Analysis and Forecast, By Country
- Historical Market Size Value (USD Million) Trend Analysis By Market Taxonomy, 2021 to 2025
- Market Size Value (USD Million) Forecast By Market Taxonomy, 2026 to 2036
- By Country
- India
- ASEAN
- Australia and New Zealand
- By Product Type
- By Physical Form
- By Grade
- By Farming Practice
- By Country
- Market Attractiveness Analysis
- By Country
- By Product Type
- By Physical Form
- By Grade
- By Farming Practice
- Key Takeaways
- Middle East and Africa Market Analysis and Forecast, By Country
- Historical Market Size Value (USD Million) Trend Analysis By Market Taxonomy, 2021 to 2025
- Market Size Value (USD Million) Forecast By Market Taxonomy, 2026 to 2036
- By Country
- GCC Countries
- South Africa
- Türkiye
- Israel
- By Product Type
- By Physical Form
- By Grade
- By Farming Practice
- By Country
- Market Attractiveness Analysis
- By Country
- By Product Type
- By Physical Form
- By Grade
- By Farming Practice
- Key Takeaways
- Key Countries Market Analysis
- United States
- Pricing Analysis
- Market Share Analysis, 2025
- By Product Type
- By Physical Form
- By Grade
- By Farming Practice
- Canada
- Pricing Analysis
- Market Share Analysis, 2025
- By Product Type
- By Physical Form
- By Grade
- By Farming Practice
- Mexico
- Pricing Analysis
- Market Share Analysis, 2025
- By Product Type
- By Physical Form
- By Grade
- By Farming Practice
- Brazil
- Pricing Analysis
- Market Share Analysis, 2025
- By Product Type
- By Physical Form
- By Grade
- By Farming Practice
- Chile
- Pricing Analysis
- Market Share Analysis, 2025
- By Product Type
- By Physical Form
- By Grade
- By Farming Practice
- Germany
- Pricing Analysis
- Market Share Analysis, 2025
- By Product Type
- By Physical Form
- By Grade
- By Farming Practice
- United Kingdom
- Pricing Analysis
- Market Share Analysis, 2025
- By Product Type
- By Physical Form
- By Grade
- By Farming Practice
- Italy
- Pricing Analysis
- Market Share Analysis, 2025
- By Product Type
- By Physical Form
- By Grade
- By Farming Practice
- Spain
- Pricing Analysis
- Market Share Analysis, 2025
- By Product Type
- By Physical Form
- By Grade
- By Farming Practice
- France
- Pricing Analysis
- Market Share Analysis, 2025
- By Product Type
- By Physical Form
- By Grade
- By Farming Practice
- India
- Pricing Analysis
- Market Share Analysis, 2025
- By Product Type
- By Physical Form
- By Grade
- By Farming Practice
- ASEAN
- Pricing Analysis
- Market Share Analysis, 2025
- By Product Type
- By Physical Form
- By Grade
- By Farming Practice
- Australia and New Zealand
- Pricing Analysis
- Market Share Analysis, 2025
- By Product Type
- By Physical Form
- By Grade
- By Farming Practice
- China
- Pricing Analysis
- Market Share Analysis, 2025
- By Product Type
- By Physical Form
- By Grade
- By Farming Practice
- Japan
- Pricing Analysis
- Market Share Analysis, 2025
- By Product Type
- By Physical Form
- By Grade
- By Farming Practice
- South Korea
- Pricing Analysis
- Market Share Analysis, 2025
- By Product Type
- By Physical Form
- By Grade
- By Farming Practice
- Poland
- Pricing Analysis
- Market Share Analysis, 2025
- By Product Type
- By Physical Form
- By Grade
- By Farming Practice
- Hungary
- Pricing Analysis
- Market Share Analysis, 2025
- By Product Type
- By Physical Form
- By Grade
- By Farming Practice
- Türkiye
- Pricing Analysis
- Market Share Analysis, 2025
- By Product Type
- By Physical Form
- By Grade
- By Farming Practice
- South Africa
- Pricing Analysis
- Market Share Analysis, 2025
- By Product Type
- By Physical Form
- By Grade
- By Farming Practice
- United States
- Market Structure Analysis
- Competition Dashboard
- Competition Benchmarking
- Market Share Analysis of Top Players
- By Regional
- By Product Type
- By Physical Form
- By Grade
- By Farming Practice
- Emerging Startups
- Innovation Benchmarking
- Competition Analysis
- Competition Deep Dive
- Koster Keunen Inc.
- Overview
- Product Portfolio
- Profitability by Market Segments
- Sales Footprint
- Strategy Overview
- Marketing Strategy
- Product Strategy
- Channel Strategy
- Strahl & Pitcairn LLC
- Poth Hille & Co. Ltd.
- ter Hell & Co. GmbH
- Paramold Manufacturing LLC
- Arjun Bees Wax Industries
- Koster Keunen Inc.
- Case Studies
- Success Stories
- Recent Developments
- Competition Deep Dive
- Assumptions & Acronyms Used
List of Tables
- Table 1: Global Market Value (USD Million) Forecast by Region, 2021 to 2036
- Table 2: Global Market Value (USD Million) Forecast by Product Type, 2021 to 2036
- Table 3: Global Market Value (USD Million) Forecast by Physical Form, 2021 to 2036
- Table 4: Global Market Value (USD Million) Forecast by Grade, 2021 to 2036
- Table 5: Global Market Value (USD Million) Forecast by Farming Practice, 2021 to 2036
- Table 6: North America Market Value (USD Million) Forecast by Country, 2021 to 2036
- Table 7: North America Market Value (USD Million) Forecast by Product Type, 2021 to 2036
- Table 8: North America Market Value (USD Million) Forecast by Physical Form, 2021 to 2036
- Table 9: North America Market Value (USD Million) Forecast by Grade, 2021 to 2036
- Table 10: North America Market Value (USD Million) Forecast by Farming Practice, 2021 to 2036
- Table 11: Latin America Market Value (USD Million) Forecast by Country, 2021 to 2036
- Table 12: Latin America Market Value (USD Million) Forecast by Product Type, 2021 to 2036
- Table 13: Latin America Market Value (USD Million) Forecast by Physical Form, 2021 to 2036
- Table 14: Latin America Market Value (USD Million) Forecast by Grade, 2021 to 2036
- Table 15: Latin America Market Value (USD Million) Forecast by Farming Practice, 2021 to 2036
- Table 16: Western Europe Market Value (USD Million) Forecast by Country, 2021 to 2036
- Table 17: Western Europe Market Value (USD Million) Forecast by Product Type, 2021 to 2036
- Table 18: Western Europe Market Value (USD Million) Forecast by Physical Form, 2021 to 2036
- Table 19: Western Europe Market Value (USD Million) Forecast by Grade, 2021 to 2036
- Table 20: Western Europe Market Value (USD Million) Forecast by Farming Practice, 2021 to 2036
- Table 21: Eastern Europe Market Value (USD Million) Forecast by Country, 2021 to 2036
- Table 22: Eastern Europe Market Value (USD Million) Forecast by Product Type, 2021 to 2036
- Table 23: Eastern Europe Market Value (USD Million) Forecast by Physical Form, 2021 to 2036
- Table 24: Eastern Europe Market Value (USD Million) Forecast by Grade, 2021 to 2036
- Table 25: Eastern Europe Market Value (USD Million) Forecast by Farming Practice, 2021 to 2036
- Table 26: East Asia Market Value (USD Million) Forecast by Country, 2021 to 2036
- Table 27: East Asia Market Value (USD Million) Forecast by Product Type, 2021 to 2036
- Table 28: East Asia Market Value (USD Million) Forecast by Physical Form, 2021 to 2036
- Table 29: East Asia Market Value (USD Million) Forecast by Grade, 2021 to 2036
- Table 30: East Asia Market Value (USD Million) Forecast by Farming Practice, 2021 to 2036
- Table 31: South Asia and Pacific Market Value (USD Million) Forecast by Country, 2021 to 2036
- Table 32: South Asia and Pacific Market Value (USD Million) Forecast by Product Type, 2021 to 2036
- Table 33: South Asia and Pacific Market Value (USD Million) Forecast by Physical Form, 2021 to 2036
- Table 34: South Asia and Pacific Market Value (USD Million) Forecast by Grade, 2021 to 2036
- Table 35: South Asia and Pacific Market Value (USD Million) Forecast by Farming Practice, 2021 to 2036
- Table 36: Middle East and Africa Market Value (USD Million) Forecast by Country, 2021 to 2036
- Table 37: Middle East and Africa Market Value (USD Million) Forecast by Product Type, 2021 to 2036
- Table 38: Middle East and Africa Market Value (USD Million) Forecast by Physical Form, 2021 to 2036
- Table 39: Middle East and Africa Market Value (USD Million) Forecast by Grade, 2021 to 2036
- Table 40: Middle East and Africa Market Value (USD Million) Forecast by Farming Practice, 2021 to 2036
List of Figures
- Figure 1: Global Market Pricing Analysis
- Figure 2: Global Market Value (USD Million) Forecast 2021-2036
- Figure 3: Global Market Value Share and BPS Analysis by Product Type, 2026 and 2036
- Figure 4: Global Market Y-o-Y Growth Comparison by Product Type, 2026-2036
- Figure 5: Global Market Attractiveness Analysis by Product Type
- Figure 6: Global Market Value Share and BPS Analysis by Physical Form, 2026 and 2036
- Figure 7: Global Market Y-o-Y Growth Comparison by Physical Form, 2026-2036
- Figure 8: Global Market Attractiveness Analysis by Physical Form
- Figure 9: Global Market Value Share and BPS Analysis by Grade, 2026 and 2036
- Figure 10: Global Market Y-o-Y Growth Comparison by Grade, 2026-2036
- Figure 11: Global Market Attractiveness Analysis by Grade
- Figure 12: Global Market Value Share and BPS Analysis by Farming Practice, 2026 and 2036
- Figure 13: Global Market Y-o-Y Growth Comparison by Farming Practice, 2026-2036
- Figure 14: Global Market Attractiveness Analysis by Farming Practice
- Figure 15: Global Market Value (USD Million) Share and BPS Analysis by Region, 2026 and 2036
- Figure 16: Global Market Y-o-Y Growth Comparison by Region, 2026-2036
- Figure 17: Global Market Attractiveness Analysis by Region
- Figure 18: North America Market Incremental Dollar Opportunity, 2026-2036
- Figure 19: Latin America Market Incremental Dollar Opportunity, 2026-2036
- Figure 20: Western Europe Market Incremental Dollar Opportunity, 2026-2036
- Figure 21: Eastern Europe Market Incremental Dollar Opportunity, 2026-2036
- Figure 22: East Asia Market Incremental Dollar Opportunity, 2026-2036
- Figure 23: South Asia and Pacific Market Incremental Dollar Opportunity, 2026-2036
- Figure 24: Middle East and Africa Market Incremental Dollar Opportunity, 2026-2036
- Figure 25: North America Market Value Share and BPS Analysis by Country, 2026 and 2036
- Figure 26: North America Market Value Share and BPS Analysis by Product Type, 2026 and 2036
- Figure 27: North America Market Y-o-Y Growth Comparison by Product Type, 2026-2036
- Figure 28: North America Market Attractiveness Analysis by Product Type
- Figure 29: North America Market Value Share and BPS Analysis by Physical Form, 2026 and 2036
- Figure 30: North America Market Y-o-Y Growth Comparison by Physical Form, 2026-2036
- Figure 31: North America Market Attractiveness Analysis by Physical Form
- Figure 32: North America Market Value Share and BPS Analysis by Grade, 2026 and 2036
- Figure 33: North America Market Y-o-Y Growth Comparison by Grade, 2026-2036
- Figure 34: North America Market Attractiveness Analysis by Grade
- Figure 35: North America Market Value Share and BPS Analysis by Farming Practice, 2026 and 2036
- Figure 36: North America Market Y-o-Y Growth Comparison by Farming Practice, 2026-2036
- Figure 37: North America Market Attractiveness Analysis by Farming Practice
- Figure 38: Latin America Market Value Share and BPS Analysis by Country, 2026 and 2036
- Figure 39: Latin America Market Value Share and BPS Analysis by Product Type, 2026 and 2036
- Figure 40: Latin America Market Y-o-Y Growth Comparison by Product Type, 2026-2036
- Figure 41: Latin America Market Attractiveness Analysis by Product Type
- Figure 42: Latin America Market Value Share and BPS Analysis by Physical Form, 2026 and 2036
- Figure 43: Latin America Market Y-o-Y Growth Comparison by Physical Form, 2026-2036
- Figure 44: Latin America Market Attractiveness Analysis by Physical Form
- Figure 45: Latin America Market Value Share and BPS Analysis by Grade, 2026 and 2036
- Figure 46: Latin America Market Y-o-Y Growth Comparison by Grade, 2026-2036
- Figure 47: Latin America Market Attractiveness Analysis by Grade
- Figure 48: Latin America Market Value Share and BPS Analysis by Farming Practice, 2026 and 2036
- Figure 49: Latin America Market Y-o-Y Growth Comparison by Farming Practice, 2026-2036
- Figure 50: Latin America Market Attractiveness Analysis by Farming Practice
- Figure 51: Western Europe Market Value Share and BPS Analysis by Country, 2026 and 2036
- Figure 52: Western Europe Market Value Share and BPS Analysis by Product Type, 2026 and 2036
- Figure 53: Western Europe Market Y-o-Y Growth Comparison by Product Type, 2026-2036
- Figure 54: Western Europe Market Attractiveness Analysis by Product Type
- Figure 55: Western Europe Market Value Share and BPS Analysis by Physical Form, 2026 and 2036
- Figure 56: Western Europe Market Y-o-Y Growth Comparison by Physical Form, 2026-2036
- Figure 57: Western Europe Market Attractiveness Analysis by Physical Form
- Figure 58: Western Europe Market Value Share and BPS Analysis by Grade, 2026 and 2036
- Figure 59: Western Europe Market Y-o-Y Growth Comparison by Grade, 2026-2036
- Figure 60: Western Europe Market Attractiveness Analysis by Grade
- Figure 61: Western Europe Market Value Share and BPS Analysis by Farming Practice, 2026 and 2036
- Figure 62: Western Europe Market Y-o-Y Growth Comparison by Farming Practice, 2026-2036
- Figure 63: Western Europe Market Attractiveness Analysis by Farming Practice
- Figure 64: Eastern Europe Market Value Share and BPS Analysis by Country, 2026 and 2036
- Figure 65: Eastern Europe Market Value Share and BPS Analysis by Product Type, 2026 and 2036
- Figure 66: Eastern Europe Market Y-o-Y Growth Comparison by Product Type, 2026-2036
- Figure 67: Eastern Europe Market Attractiveness Analysis by Product Type
- Figure 68: Eastern Europe Market Value Share and BPS Analysis by Physical Form, 2026 and 2036
- Figure 69: Eastern Europe Market Y-o-Y Growth Comparison by Physical Form, 2026-2036
- Figure 70: Eastern Europe Market Attractiveness Analysis by Physical Form
- Figure 71: Eastern Europe Market Value Share and BPS Analysis by Grade, 2026 and 2036
- Figure 72: Eastern Europe Market Y-o-Y Growth Comparison by Grade, 2026-2036
- Figure 73: Eastern Europe Market Attractiveness Analysis by Grade
- Figure 74: Eastern Europe Market Value Share and BPS Analysis by Farming Practice, 2026 and 2036
- Figure 75: Eastern Europe Market Y-o-Y Growth Comparison by Farming Practice, 2026-2036
- Figure 76: Eastern Europe Market Attractiveness Analysis by Farming Practice
- Figure 77: East Asia Market Value Share and BPS Analysis by Country, 2026 and 2036
- Figure 78: East Asia Market Value Share and BPS Analysis by Product Type, 2026 and 2036
- Figure 79: East Asia Market Y-o-Y Growth Comparison by Product Type, 2026-2036
- Figure 80: East Asia Market Attractiveness Analysis by Product Type
- Figure 81: East Asia Market Value Share and BPS Analysis by Physical Form, 2026 and 2036
- Figure 82: East Asia Market Y-o-Y Growth Comparison by Physical Form, 2026-2036
- Figure 83: East Asia Market Attractiveness Analysis by Physical Form
- Figure 84: East Asia Market Value Share and BPS Analysis by Grade, 2026 and 2036
- Figure 85: East Asia Market Y-o-Y Growth Comparison by Grade, 2026-2036
- Figure 86: East Asia Market Attractiveness Analysis by Grade
- Figure 87: East Asia Market Value Share and BPS Analysis by Farming Practice, 2026 and 2036
- Figure 88: East Asia Market Y-o-Y Growth Comparison by Farming Practice, 2026-2036
- Figure 89: East Asia Market Attractiveness Analysis by Farming Practice
- Figure 90: South Asia and Pacific Market Value Share and BPS Analysis by Country, 2026 and 2036
- Figure 91: South Asia and Pacific Market Value Share and BPS Analysis by Product Type, 2026 and 2036
- Figure 92: South Asia and Pacific Market Y-o-Y Growth Comparison by Product Type, 2026-2036
- Figure 93: South Asia and Pacific Market Attractiveness Analysis by Product Type
- Figure 94: South Asia and Pacific Market Value Share and BPS Analysis by Physical Form, 2026 and 2036
- Figure 95: South Asia and Pacific Market Y-o-Y Growth Comparison by Physical Form, 2026-2036
- Figure 96: South Asia and Pacific Market Attractiveness Analysis by Physical Form
- Figure 97: South Asia and Pacific Market Value Share and BPS Analysis by Grade, 2026 and 2036
- Figure 98: South Asia and Pacific Market Y-o-Y Growth Comparison by Grade, 2026-2036
- Figure 99: South Asia and Pacific Market Attractiveness Analysis by Grade
- Figure 100: South Asia and Pacific Market Value Share and BPS Analysis by Farming Practice, 2026 and 2036
- Figure 101: South Asia and Pacific Market Y-o-Y Growth Comparison by Farming Practice, 2026-2036
- Figure 102: South Asia and Pacific Market Attractiveness Analysis by Farming Practice
- Figure 103: Middle East and Africa Market Value Share and BPS Analysis by Country, 2026 and 2036
- Figure 104: Middle East and Africa Market Value Share and BPS Analysis by Product Type, 2026 and 2036
- Figure 105: Middle East and Africa Market Y-o-Y Growth Comparison by Product Type, 2026-2036
- Figure 106: Middle East and Africa Market Attractiveness Analysis by Product Type
- Figure 107: Middle East and Africa Market Value Share and BPS Analysis by Physical Form, 2026 and 2036
- Figure 108: Middle East and Africa Market Y-o-Y Growth Comparison by Physical Form, 2026-2036
- Figure 109: Middle East and Africa Market Attractiveness Analysis by Physical Form
- Figure 110: Middle East and Africa Market Value Share and BPS Analysis by Grade, 2026 and 2036
- Figure 111: Middle East and Africa Market Y-o-Y Growth Comparison by Grade, 2026-2036
- Figure 112: Middle East and Africa Market Attractiveness Analysis by Grade
- Figure 113: Middle East and Africa Market Value Share and BPS Analysis by Farming Practice, 2026 and 2036
- Figure 114: Middle East and Africa Market Y-o-Y Growth Comparison by Farming Practice, 2026-2036
- Figure 115: Middle East and Africa Market Attractiveness Analysis by Farming Practice
- Figure 116: Global Market - Tier Structure Analysis
- Figure 117: Global Market - Company Share Analysis
Frequently Asked Questions
How big is the beeswax market in 2026, and what is forecast for 2036?
FMI estimates that the global beeswax market size stood at USD 648.5 million in 2025 and reached USD 684.8 million in 2026. Overall industry valuation is projected to reach USD 1,170.0 million by 2036 as personal care and food brands replace petroleum paraffins with natural Apis wax.
What is the CAGR for the beeswax market from 2026 to 2036?
The beeswax sector is projected to expand at a 5.5% CAGR over the 2026 to 2036 forecast window, generating USD 485.2 million in incremental market value.
Which product type segment leads the beeswax market?
Yellow Crude and Filtered Beeswax accounts for 54.6% of 2026 product type volume since physical filtration retains natural carotenoid antioxidants and serves both direct balm formulation and white wax refining.
Which physical form segment leads the beeswax market?
Pastilles, Pellets, and Beads represent 49.2% of the physical form category in 2026 as automated cosmetic and food plants meter free-flowing prills directly into heated mixing kettles.
Which country has a notable growth outlook during the assessment period?
Germany sets the pace for national beeswax growth at a 5.9% annual rate through 2036 under European Pharmacopoeia refining hubs and NATRUE cosmetics manufacturing.
Who are the key players in the market?
Koster Keunen Inc. and Strahl & Pitcairn LLC with Poth Hille & Co. Ltd. and ter Hell & Co. GmbH plus Paramold Manufacturing LLC and Arjun Bees Wax Industries represent the primary refiners profiled.
Preview the report firsthand - request a free sample
Get SampleGet the brochure for pricing and purchase details.
Get PDF
