Benzaldehyde Market Size, Share, and Forecast Outlook 2025 to 2035

The benzaldehyde market is anticipated to expand from USD 607.4 million in 2025 to USD 969.8 million by 2035, registering a CAGR of 4.8% during the forecast period. Market growth is being sustained by its rising application in aroma chemicals, pharmaceuticals, and agrochemicals, particularly as a precursor for cinnamic acid and other derivatives used in flavors and fragrances.
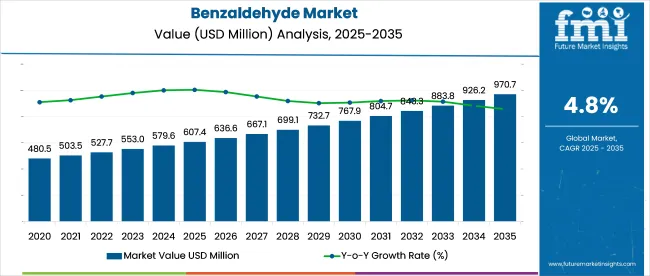
Quick Stats in Benzaldehyde Market

  • Market Size (2025): USD 607.4 million
  • Market Forecast (2035): USD 969.8 million
  • CAGR (2025 to 2035): 4.8%
  • Top Application Segment: Flavor and Fragrance (28.2% share in 2025)
  • Leading Derivative Segment: Benzoic Acid (24.6% share in 2025)
  • Top Growing Country: India (5.2% CAGR)

Benzaldehyde Market Market Value Analysis

Attributes Description
Estimated Industry Size (2025E) USD 607.4 million
Projected Industry Value (2035F) USD 969.8 million
Value-based CAGR (2025 to 2035) 4.8%

In Asia-Pacific, over 50,000 tons were processed in 2023, with China contributing nearly 45,000 tons due to its dominance in agrochemical intermediates and synthetic flavor production. India’s growing pharmaceutical sector is also boosting domestic benzaldehyde demand. In Europe, Germany alone processed around 8,000 tons, driven by strict purity requirements in cosmetics and personal care formulations.

North America’s usage is concentrated in USP-grade applications for food and pharma sectors, where compliance and consistency are critical. Manufacturers are increasingly adopting catalytic and green synthesis routes to meet tightening environmental standards, especially in OECD regions. Across the chain, demand visibility is improving due to long-term contracts with end users in dyes, fragrances, and veterinary products. This vertical alignment is improving throughput efficiency and allowing for better cost pass-through across regions.

As of 2025, the benzaldehyde market is being recognized as a key segment within its broader parent industries. Approximately 4-6% of the aromatic chemicals market is contributed by benzaldehyde, driven by its importance in perfumery and solvent applications.

In the flavor and fragrance ingredients market, a share of nearly 8-10% is maintained as benzaldehyde continues to be used in almond, cherry, and marzipan formulations. Around 3-4% of the pharmaceutical intermediates market is represented by benzaldehyde due to its use in active ingredient synthesis. Its share in the agrochemical ingredients market is estimated at 2-3%, while in the specialty chemicals space, the contribution reaches around 5-6% as it supports dye and resin production.

Analyzing Benzaldehyde Market by Top Investment Segments

The market is expanding steadily, fueled by its widespread use in technical-grade production, flavor and fragrance formulation, and benzoic acid derivatives. Growth is supported by rising demand in personal care, food preservation, and industrial coatings applications.
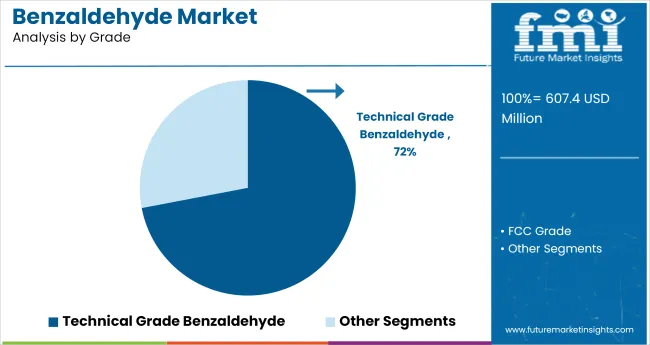
Technical Grade Benzaldehyde Dominates with 72% Market Share

Benzaldehyde Market Analysis By Grade

Technical grade benzaldehyde is projected to account for 72% of total market share by 2025. It is widely favored in chemical manufacturing due to its affordability and consistent quality. Its use in agrochemicals, dyes, and pharmaceuticals drives large-scale demand across industrial economies.
  • Agrochemical manufacturers use technical-grade benzaldehyde in herbicide and pesticide synthesis.
  • Large volumes are consumed in dye intermediates and aroma chemical production.
  • Strong manufacturing bases in China and India ensure consistent supply and price stability.

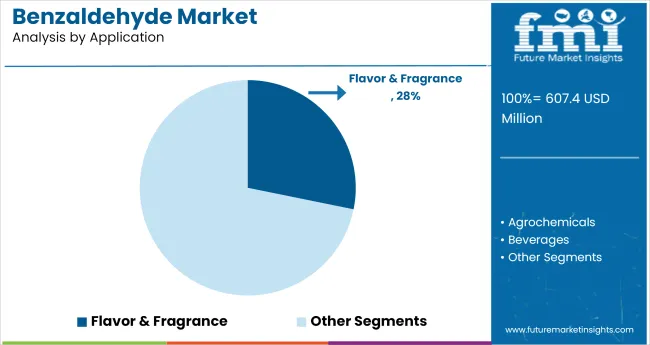
Flavor & Fragrance Segment Holds 28.2% Share in Application

Benzaldehyde Market Analysis By Application

Flavor and fragrance applications are expected to hold 28.2% of the total market by 2025. Benzaldehyde’s almond-like aroma makes it a key additive in food, beverages, and perfumes. Demand is supported by rising consumption of natural flavoring agents and expanding personal care markets.
  • Bakeries and beverage brands use benzaldehyde for nutty and fruity flavor profiles.
  • Personal care companies blend it in scented soaps, shampoos, and perfumes.
  • Growth is supported by regulatory preference for naturally derived aroma compounds.

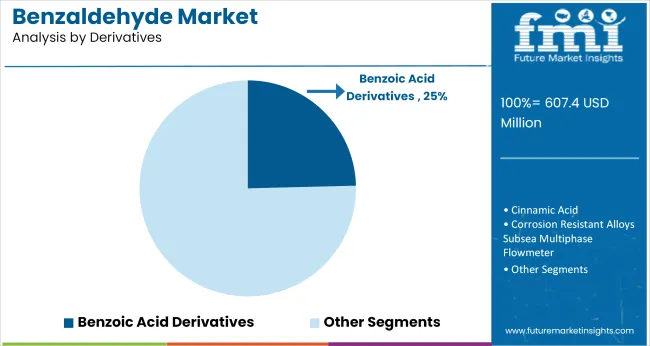
Benzoic Acid Derivatives Capture 24.6% Market Share

Benzaldehyde Market Analysis By Derivatives

Benzoic acid, derived from benzaldehyde, is projected to secure a 24.6% market share in 2025. It plays a crucial role in preservatives, coatings, and alkyd resins. Its antimicrobial properties and chemical resilience ensure widespread adoption across food processing and chemical coatings.

  • Used as a preservative in soft drinks, fruit juices, and packaged foods.
  • Enhances durability and gloss in industrial paints and coatings.
  • European producers are expanding benzoic acid capacity to meet export demand.

Top Benzaldehyde Market Dynamics

The market is growing steadily due to its widespread use in aroma chemicals, agrochemicals, and pharmaceutical intermediates. In 2024, global consumption crossed 105,000 metric tons, with Asia Pacific accounting for over 48% of total demand.

High Demand from Aroma Chemicals, Dyes, and Agrochemicals

Benzaldehyde is widely used in the synthesis of cinnamic acid, benzyl alcohol, and acridine dyes. In India and China, over 65% of benzaldehyde produced is consumed in agrochemical and dye sectors. In the EU, flavor-grade benzaldehyde is regulated under FEMA and EFFA standards, making it essential in almond, cherry, and nut flavor formulations.

  • Utilized in the manufacture of cinnamates, acridine dyes, and herbicides.
  • Used as a key intermediate in fungicides such as benomyl and dicloran.
  • Preferred in food and beverage applications for its natural almond aroma.

Technological Advancements Enhancing Purity and Processing Efficiency

Manufacturers are investing in catalytic oxidation and continuous distillation to improve purity (>99.5%) and reduce by-products. In 2024, over 40% of global benzaldehyde plants adopted vapor-phase oxidation to increase yield and reduce carbon emissions. Advanced separation units are helping in fine chemical production where purity is critical.
  • Vapor-phase oxidation processes installed to boost yield and lower emissions.
  • Continuous distillation lines deployed for pharma and F&F grade output.
  • Purity enhancement critical for high-end fragrance and API synthesis.

Top Countries Synthesizing, Utilizing, and Expanding Applications in the Benzaldehyde Market

Benzaldehyde Market Country Wise Analysis

Country CAGR (2025 to 2035)
India 5.2%
China 4.6%
USA 2.9%
Germany 1.8%
Japan 1.3%

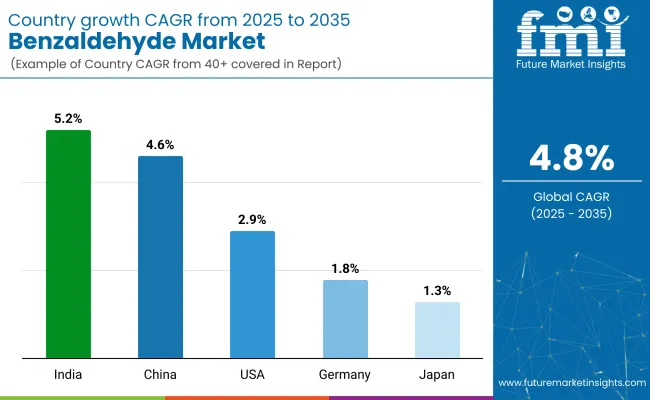
The global market is forecast to expand at a 4.8% CAGR from 2025 to 2035, yet significant variation exists across BRICS and OECD economies. India leads with a 5.2% CAGR, slightly outperforming the global average due to rapid downstream expansion in the agrochemical and aroma sectors. Gujarat-based chemical clusters are driving capacity additions, with over 40% of new investments targeting benzoate esters and cinnamic acid production.

China follows at 4.6%, just below the global mark, where demand from perfumery, pharmaceuticals, and dyes supports continued growth, though regulatory tightening under its dual-carbon policy is slowing new plant approvals. In contrast, OECD countries underperform.

The USA posts a 2.9% CAGR, limited by volatile toluene pricing and decelerating growth in legacy perfumery applications. Germany (1.8%) and Japan (1.3%) reflect structural stagnation, with weak R&D in benzaldehyde derivatives and tighter environmental thresholds disincentivizing scale-ups. ASEAN markets are emerging but remain underrepresented in capacity and trade volumes.

The report provides insights across 40+ countries. The five below are highlighted for their strategic influence and growth trajectory.

Analysis of Benzaldehyde Market in India

India is forecast to grow at a CAGR of 5.2% from 2025 to 2035. Growth is being supported by rising demand across agrochemicals, pharmaceuticals, and fragrance applications. Benzaldehyde is used as an intermediate in pesticides and plant growth regulators, which are widely produced in Gujarat and Maharashtra.

The country’s strong domestic chemical manufacturing base is helping meet internal consumption while also exporting derivatives. Additionally, the fragrance sector is expanding due to higher demand for incense sticks, soaps, and household care products that use benzaldehyde-based compounds.

  • Agrochemical usage supports consistent industrial offtake.
  • Fragrance and aroma chemicals drive regional production activity.
  • Government schemes encourage investment in bulk drug intermediates.

Demand Forecast for Benzaldehyde Market in China

China is expected to post a CAGR of 4.6% through 2035, driven by its large-scale manufacturing ecosystem and high consumption of resins and herbicide precursors. Benzaldehyde is widely used in southern provinces for coating resins and in agrochemical synthesis.

The country has ramped up local production with greater emphasis on process efficiency and pollution control. Domestic consumption is being bolstered by downstream demand in polymer, food additive, and personal care industries. Chinese exporters are also expanding their reach into Southeast Asia and the Middle East.

  • Resin applications in construction and electronics drive production.
  • Agrochemical synthesis benefits from domestic R&D investment.
  • Exporters gain competitive edge through low-cost processing routes.

Growth Analysis of Benzaldehyde Market in the United States

The United States is projected to grow at a CAGR of 2.9% from 2025 to 2035. This growth is led by demand in food flavoring, pharmaceutical synthesis, and personal care sectors. Benzaldehyde is used to manufacture artificial almond flavor, high-purity solvents, and active pharmaceutical ingredients. Industrial users prioritize quality and regulatory compliance, which gives domestic producers an advantage. In addition, the trend toward natural and bio-based benzaldehyde is gaining momentum as clean-label formulations gain market share.

  • Food-grade benzaldehyde demand is growing in confectionery and beverages.
  • Domestic producers invest in high-purity, pharma-compliant grades.
  • Natural and bio-based variants are preferred in clean-label products.

Outlook for Benzaldehyde Market in Germany

Germany is estimated to grow at a CAGR of 1.8% between 2025 and 2035. The country has a stable but specialized demand for benzaldehyde in fragrance, fine chemicals, and pharmaceutical applications. Imports dominate the supply chain, and most buyers prefer high-purity grades that meet strict EU safety regulations. The country’s chemical industry places strong emphasis on sustainability and traceability, making eco-friendly production methods more attractive. Custom synthesis services are also rising as users demand tailored derivatives.

  • Demand for fragrance-grade benzaldehyde remains steady among niche players.
  • Compliance with REACH standards limits import options.
  • Eco-compliant synthesis technologies gain traction among domestic users.

Benzaldehyde Market Outlook in Japan

Japan is forecast to expand at a CAGR of 1.3% from 2025 to 2035. Demand is mainly driven by its well-established cosmetics, food flavoring, and fine chemicals sectors. Local manufacturers focus on precision synthesis, requiring high-quality benzaldehyde inputs for specialized uses. Imports make up the majority of supply, with the United States and China being key suppliers. Benzaldehyde is used in skin-care formulations, fragrance compounds, and food essences. Consumer preferences for high-performance and clean-label products are influencing future procurement patterns.
  • Cosmetics and skincare drive demand for refined benzaldehyde.
  • Imports dominate due to limited local production capacity.
  • Consumer trends favor quality-assured and clean-label ingredients.

Leading Benzaldehyde Producers

Benzaldehyde Market Analysis By Company

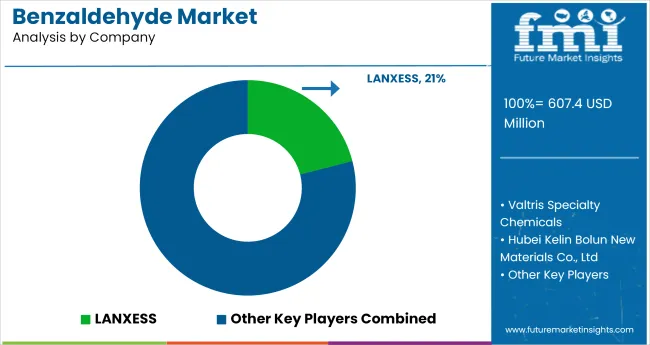
The industry is moderately consolidated, with key players specializing in either synthetic or natural-grade production. LANXESS holds a dominant global share, supplying high-purity benzaldehyde for agrochemicals and aroma chemicals, supported by backward integration and robust European infrastructure. Valtris Specialty Chemicals leverages strong USA manufacturing to serve the coatings and plastics sector.

India’s Shimmer Chemicals and KLJ Group cater to both domestic and Asian markets, offering cost-effective variants for dye and flavor applications. Kadillac Chemicals focuses on fine chemical intermediates, targeting pharmaceutical clients. In China, Lihai Chemical and Hubei Kelin Bolun lead with bulk exports, driven by low-cost synthesis methods. Axxence Aromatic GmbH serves premium natural benzaldehyde markets across Europe, emphasizing traceability and food-grade compliance.

Recent Benzaldehyde Industry News

  • In October 2024, Axxence Aromatic GmbH merged with USA-based Natural Advantage, expanding its global footprint and consolidating a portfolio of over 475 natural aroma ingredients. With combined revenues nearing €70 million, the move strengthens Axxence’s leadership in benzaldehyde derivatives and enhances its position in the global flavor and fragrance market.

Leading Players in Benzaldehyde Market

  • LANXESS
  • Valtris Specialty Chemicals
  • Hubei Kelin Bolun New Materials Co., Ltd
  • Lihai Chemical Industry Co., Ltd
  • Gujarat Alkalies & Chemicals Ltd
  • KLJ Group
  • Kadillac Chemicals Pvt. Ltd
  • Wuhan Dico Chemical Co., Ltd
  • Axxence Aromatic GmbH
  • Shimmer Chemicals Pvt. Ltd
  • Elan Chemical Co Inc.
  • Other Players

Report Coverage and Scope Summary

Report Attributes Details
Market Size (2025) USD 607.4 million
Projected Market Size (2035) USD 969.8 million
CAGR (2025 to 2035) 4.8%
Base Year for Estimation 2024
Historical Period 2020 to 2024
Projections Period 2025 to 2035
Quantitative Units USD million for market value
Grades Analyzed (Segment 1) FCC Grade, Technical Grade
Applications Analyzed (Segment 2) Agrochemicals (Crop Protection), Beverages (Alcoholic Beverages <15% ABV, Carbonated Soft Drinks, Fruit Juices, Other Soft Drinks), Dyes & Coatings, Flavor & Fragrance, Food (Bakery Goods, Confectionery & Chewing Gum, Ice Creams, Gelatins, Puddings), Pharmaceuticals & Intermediates, Others
Derivatives Analyzed (Segment 3) Cinnamic Acid, Benzoic Acid, Sodium Benzoate, Benzyl Alcohol, Others
Regions Covered North America, Latin America, Western Europe, Eastern Europe, Balkans & Baltic, Russia & Belarus, Central Asia, East Asia, South Asia & Pacific, Middle East & Africa
Countries Covered United States, Canada, Germany, United Kingdom, France, Japan, China, India, South Korea, Brazil
Key Players LANXESS, Valtris Specialty Chemicals, Hubei Kelin Bolun New Materials Co., Ltd, Lihai Chemical Industry Co., Ltd, Gujarat Alkalies & Chemicals Ltd, KLJ Group, Kadillac Chemicals Pvt. Ltd, Wuhan Dico Chemical Co., Ltd, Axxence Aromatic GmbH, Shimmer Chemicals Pvt. Ltd, Elan Chemical Co Inc., Other Players
Additional Attributes Dollar sales by grade and application, increased use in food and fragrance formulations, growing demand for derivatives like cinnamic acid and benzoic acid, and expanding production capacity across Asia and Europe.

Top Segments Studied in the Benzaldehyde Market

By Grade:

In this segment, the industry has been categorized into FCC Grade and Technical Grade.

By Application:

By application, the market is segmented into Agrochemicals (Crop Protection), Beverages (Alcoholic Beverages <15% ABV, Carbonated Soft Drinks, Fruit Juices and Other Soft Drinks), Dye and Coatings, Flavor and Fragrance, Food (Bakery Goods, Confectionery and Chewing Gum, Ice Creams, Gelatins, Puddings), Pharmaceutical and Intermediates, and Others.

By Derivatives:

Key derivatives include Cinnamic Acid, Benzoic Acid, Sodium Benzoate, Benzyl Alcohol, and Others.

By Region:

Industry analysis has been carried out in key countries of North America, Latin America, Western Europe, Eastern Europe, Balkans & Baltic, Russia & Belarus, Central Asia, East Asia, South Asia & Pacific, and the Middle East & Africa.

Table of Content

  1. Executive Summary
    • Global Market Outlook
    • Demand-side Trends
    • Supply-side Trends
    • Technology Roadmap Analysis
    • Analysis and Recommendations
  2. Market Overview
    • Market Coverage / Taxonomy
    • Market Definition / Scope / Limitations
  3. Market Background
    • Market Dynamics
      • Drivers
      • Restraints
      • Opportunity
      • Trends
    • Scenario Forecast
      • Demand in Optimistic Scenario
      • Demand in Likely Scenario
      • Demand in Conservative Scenario
    • Opportunity Map Analysis
    • Product Life Cycle Analysis
    • Supply Chain Analysis
      • Supply Side Participants and their Roles
        • Producers
        • Mid-Level Participants (Traders/ Agents/ Brokers)
        • Wholesalers and Distributors
      • Value Added and Value Created at Node in the Supply Chain
      • List of Raw Material Suppliers
      • List of Existing and Potential Buyer’s
    • Investment Feasibility Matrix
    • Value Chain Analysis
      • Profit Margin Analysis
      • Wholesalers and Distributors
      • Retailers
    • PESTLE and Porter’s Analysis
    • Regulatory Landscape
      • By Key Regions
      • By Key Countries
    • Regional Parent Market Outlook
    • Production and Consumption Statistics
    • Import and Export Statistics
  4. Global Market Analysis 2020 to 2024 and Forecast, 2025 to 2035
    • Historical Market Size Value (USD Million) & Volume (MT) Analysis, 2020 to 2024
    • Current and Future Market Size Value (USD Million) & Volume (MT) Projections, 2025 to 2035
      • Y-o-Y Growth Trend Analysis
      • Absolute $ Opportunity Analysis
  5. Global Market Pricing Analysis 2020 to 2024 and Forecast 2025 to 2035
  6. Global Market Analysis 2020 to 2024 and Forecast 2025 to 2035, By Grade
    • Introduction / Key Findings
    • Historical Market Size Value (USD Million) & Volume (MT) Analysis By Grade, 2020 to 2024
    • Current and Future Market Size Value (USD Million) & Volume (MT) Analysis and Forecast By Grade, 2025 to 2035
      • FCC Grade
      • Technical Grade
    • Y-o-Y Growth Trend Analysis By Grade, 2020 to 2024
    • Absolute $ Opportunity Analysis By Grade, 2025 to 2035
  7. Global Market Analysis 2020 to 2024 and Forecast 2025 to 2035, By Application
    • Introduction / Key Findings
    • Historical Market Size Value (USD Million) & Volume (MT) Analysis By Application, 2020 to 2024
    • Current and Future Market Size Value (USD Million) & Volume (MT) Analysis and Forecast By Application, 2025 to 2035
      • Agrochemicals
        • Crop Protection
      • Beverages
        • Alcoholic Beverages <15% ABV
        • Carbonated Soft Drinks
        • Fruit Juices
        • Other Soft Drinks
      • Dyes & Coatings
      • Flavor & Fragrance
      • Food
        • Bakery Goods
        • Confectionery & Chewing Gum
        • Ice Creams
        • Gelatins
        • Puddings
      • Pharmaceuticals & Intermediates
      • Others
    • Y-o-Y Growth Trend Analysis By Application, 2020 to 2024
    • Absolute $ Opportunity Analysis By Application, 2025 to 2035
  8. Global Market Analysis 2020 to 2024 and Forecast 2025 to 2035, By Derivatives
    • Introduction / Key Findings
    • Historical Market Size Value (USD Million) & Volume (MT) Analysis By Derivatives, 2020 to 2024
    • Current and Future Market Size Value (USD Million) & Volume (MT) Analysis and Forecast By Derivatives, 2025 to 2035
      • Cinnamic Acid
      • Benzoic Acid
      • Sodium Benzoate
      • Benzyl Alcohol
      • Others
    • Y-o-Y Growth Trend Analysis By Derivatives, 2020 to 2024
    • Absolute $ Opportunity Analysis By Derivatives, 2025 to 2035
  9. Global Market Analysis 2020 to 2024 and Forecast 2025 to 2035, By Region
    • Introduction
    • Historical Market Size Value (USD Million) & Volume (MT) Analysis By Region, 2020 to 2024
    • Current Market Size Value (USD Million) & Volume (MT) Analysis and Forecast By Region, 2025 to 2035
      • North America
      • Latin America
      • Western Europe
      • Eastern Europe
      • East Asia
      • South Asia & Pacific
      • Middle East and Africa
    • Market Attractiveness Analysis By Region
  10. North America Market Analysis 2020 to 2024 and Forecast 2025 to 2035, By Country
    • Historical Market Size Value (USD Million) & Volume (MT) Trend Analysis By Market Taxonomy, 2020 to 2024
    • Market Size Value (USD Million) & Volume (MT) Forecast By Market Taxonomy, 2025 to 2035
      • By Country
        • USA
        • Canada
        • Mexico
      • By Grade
      • By Application
      • By Derivatives
    • Market Attractiveness Analysis
      • By Country
      • By Grade
      • By Application
      • By Derivatives
    • Key Takeaways
  11. Latin America Market Analysis 2020 to 2024 and Forecast 2025 to 2035, By Country
    • Historical Market Size Value (USD Million) & Volume (MT) Trend Analysis By Market Taxonomy, 2020 to 2024
    • Market Size Value (USD Million) & Volume (MT) Forecast By Market Taxonomy, 2025 to 2035
      • By Country
        • Brazil
        • Argentina
        • Rest of LATAM
      • By Grade
      • By Application
      • By Derivatives
    • Market Attractiveness Analysis
      • By Country
      • By Grade
      • By Application
      • By Derivatives
    • Key Takeaways
  12. Western Europe Market Analysis 2020 to 2024 and Forecast 2025 to 2035, By Country
    • Historical Market Size Value (USD Million) & Volume (MT) Trend Analysis By Market Taxonomy, 2020 to 2024
    • Market Size Value (USD Million) & Volume (MT) Forecast By Market Taxonomy, 2025 to 2035
      • By Country
        • Germany
        • Italy
        • France
        • UK
        • Spain
        • BENELUX
        • Nordic
        • Rest of W.Europe
      • By Grade
      • By Application
      • By Derivatives
    • Market Attractiveness Analysis
      • By Country
      • By Grade
      • By Application
      • By Derivatives
    • Key Takeaways
  13. Eastern Europe Market Analysis 2020 to 2024 and Forecast 2025 to 2035, By Country
    • Historical Market Size Value (USD Million) & Volume (MT) Trend Analysis By Market Taxonomy, 2020 to 2024
    • Market Size Value (USD Million) & Volume (MT) Forecast By Market Taxonomy, 2025 to 2035
      • By Country
        • Russia
        • Hungary
        • Poland
        • Balkan & Baltics
        • Rest of E. Europe
      • By Grade
      • By Application
      • By Derivatives
    • Market Attractiveness Analysis
      • By Country
      • By Grade
      • By Application
      • By Derivatives
    • Key Takeaways
  14. East Asia Market Analysis 2020 to 2024 and Forecast 2025 to 2035, By Country
    • Historical Market Size Value (USD Million) & Volume (MT) Trend Analysis By Market Taxonomy, 2020 to 2024
    • Market Size Value (USD Million) & Volume (MT) Forecast By Market Taxonomy, 2025 to 2035
      • By Country
        • China
        • Japan
        • South Korea
      • By Grade
      • By Application
      • By Derivatives
    • Market Attractiveness Analysis
      • By Country
      • By Grade
      • By Application
      • By Derivatives
    • Key Takeaways
  15. South Asia & Pacific Market Analysis 2020 to 2024 and Forecast 2025 to 2035, By Country
    • Historical Market Size Value (USD Million) & Volume (MT) Trend Analysis By Market Taxonomy, 2020 to 2024
    • Market Size Value (USD Million) & Volume (MT) Forecast By Market Taxonomy, 2025 to 2035
      • By Country
        • India
        • Australia & New Zealand
        • ASEAN
        • Rest of SAP
      • By Grade
      • By Application
      • By Derivatives
    • Market Attractiveness Analysis
      • By Country
      • By Grade
      • By Application
      • By Derivatives
    • Key Takeaways
  16. Middle East and Africa Market Analysis 2020 to 2024 and Forecast 2025 to 2035, By Country
    • Historical Market Size Value (USD Million) & Volume (MT) Trend Analysis By Market Taxonomy, 2020 to 2024
    • Market Size Value (USD Million) & Volume (MT) Forecast By Market Taxonomy, 2025 to 2035
      • By Country
        • GCC Countries
        • Northern Africa
        • South Africa
        • Turkiye
        • Rest of MEA
      • By Grade
      • By Application
      • By Derivatives
    • Market Attractiveness Analysis
      • By Country
      • By Grade
      • By Application
      • By Derivatives
    • Key Takeaways
  17. Key Countries Market Analysis
    • USA
      • Pricing Analysis
      • Market Share Analysis, 2024
        • By Grade
        • By Application
        • By Derivatives
    • Canada
      • Pricing Analysis
      • Market Share Analysis, 2024
        • By Grade
        • By Application
        • By Derivatives
    • Brazil
      • Pricing Analysis
      • Market Share Analysis, 2024
        • By Grade
        • By Application
        • By Derivatives
    • Mexico
      • Pricing Analysis
      • Market Share Analysis, 2024
        • By Grade
        • By Application
        • By Derivatives
    • Argentina
      • Pricing Analysis
      • Market Share Analysis, 2024
        • By Grade
        • By Application
        • By Derivatives
  18. Market Structure Analysis
    • Competition Dashboard
    • Competition Benchmarking
    • Market Share Analysis of Top Players
      • By Regional
      • By Grade
      • By Application
      • By Derivatives
  19. Competition Analysis
    • Competition Deep Dive
      • LANXESS
        • Overview
        • Product Portfolio
        • Profitability by Market Segments (Product/Age /Sales Channel/Region)
        • Sales Footprint
        • Strategy Overview
          • Marketing Strategy
          • Product Strategy
          • Channel Strategy
      • Valtris Specialty Chemicals
        • Overview
        • Product Portfolio
        • Profitability by Market Segments (Product/Age /Sales Channel/Region)
        • Sales Footprint
        • Strategy Overview
          • Marketing Strategy
          • Product Strategy
          • Channel Strategy
      • Hubei Kelin Bolun New Materials Co., Ltd
        • Overview
        • Product Portfolio
        • Profitability by Market Segments (Product/Age /Sales Channel/Region)
        • Sales Footprint
        • Strategy Overview
          • Marketing Strategy
          • Product Strategy
          • Channel Strategy
      • Lihai Chemical Industry Co., Ltd
        • Overview
        • Product Portfolio
        • Profitability by Market Segments (Product/Age /Sales Channel/Region)
        • Sales Footprint
        • Strategy Overview
          • Marketing Strategy
          • Product Strategy
          • Channel Strategy
      • Gujarat Alkalies & Chemicals Ltd
        • Overview
        • Product Portfolio
        • Profitability by Market Segments (Product/Age /Sales Channel/Region)
        • Sales Footprint
        • Strategy Overview
          • Marketing Strategy
          • Product Strategy
          • Channel Strategy
      • KLJ Group
        • Overview
        • Product Portfolio
        • Profitability by Market Segments (Product/Age /Sales Channel/Region)
        • Sales Footprint
        • Strategy Overview
          • Marketing Strategy
          • Product Strategy
          • Channel Strategy
      • Kadillac Chemicals Pvt. Ltd
        • Overview
        • Product Portfolio
        • Profitability by Market Segments (Product/Age /Sales Channel/Region)
        • Sales Footprint
        • Strategy Overview
          • Marketing Strategy
          • Product Strategy
          • Channel Strategy
      • Wuhan Dico Chemical Co., Ltd
        • Overview
        • Product Portfolio
        • Profitability by Market Segments (Product/Age /Sales Channel/Region)
        • Sales Footprint
        • Strategy Overview
          • Marketing Strategy
          • Product Strategy
          • Channel Strategy
      • Axxence Aromatic GmbH
        • Overview
        • Product Portfolio
        • Profitability by Market Segments (Product/Age /Sales Channel/Region)
        • Sales Footprint
        • Strategy Overview
          • Marketing Strategy
          • Product Strategy
          • Channel Strategy
      • Shimmer Chemicals Pvt. Ltd
        • Overview
        • Product Portfolio
        • Profitability by Market Segments (Product/Age /Sales Channel/Region)
        • Sales Footprint
        • Strategy Overview
          • Marketing Strategy
          • Product Strategy
          • Channel Strategy
      • Elan Chemical Co Inc.
        • Overview
        • Product Portfolio
        • Profitability by Market Segments (Product/Age /Sales Channel/Region)
        • Sales Footprint
        • Strategy Overview
          • Marketing Strategy
          • Product Strategy
          • Channel Strategy
      • Other Players
        • Overview
        • Product Portfolio
        • Profitability by Market Segments (Product/Age /Sales Channel/Region)
        • Sales Footprint
        • Strategy Overview
          • Marketing Strategy
          • Product Strategy
          • Channel Strategy
  20. Assumptions & Acronyms Used
  21. Research Methodology

List of Tables

  • Table 1: Global Market Value (USD Million) Forecast by Region, 2020-2035
  • Table 2: Global Market Volume (MT) Forecast by Region, 2020-2035
  • Table 3: Global Market Value (USD Million) Forecast by Grade, 2020-2035
  • Table 4: Global Market Volume (MT) Forecast by Grade, 2020-2035
  • Table 5: Global Market Value (USD Million) Forecast by Application, 2020-2035
  • Table 6: Global Market Volume (MT) Forecast by Application, 2020-2035
  • Table 7: Global Market Value (USD Million) Forecast by Derivatives, 2020-2035
  • Table 8: Global Market Volume (MT) Forecast by Derivatives, 2020-2035
  • Table 9: North America Market Value (USD Million) Forecast by Country, 2020-2035
  • Table 10: North America Market Volume (MT) Forecast by Country, 2020-2035
  • Table 11: North America Market Value (USD Million) Forecast by Grade, 2020-2035
  • Table 12: North America Market Volume (MT) Forecast by Grade, 2020-2035
  • Table 13: North America Market Value (USD Million) Forecast by Application, 2020-2035
  • Table 14: North America Market Volume (MT) Forecast by Application, 2020-2035
  • Table 15: North America Market Value (USD Million) Forecast by Derivatives, 2020-2035
  • Table 16: North America Market Volume (MT) Forecast by Derivatives, 2020-2035
  • Table 17: Latin America Market Value (USD Million) Forecast by Country, 2020-2035
  • Table 18: Latin America Market Volume (MT) Forecast by Country, 2020-2035
  • Table 19: Latin America Market Value (USD Million) Forecast by Grade, 2020-2035
  • Table 20: Latin America Market Volume (MT) Forecast by Grade, 2020-2035
  • Table 21: Latin America Market Value (USD Million) Forecast by Application, 2020-2035
  • Table 22: Latin America Market Volume (MT) Forecast by Application, 2020-2035
  • Table 23: Latin America Market Value (USD Million) Forecast by Derivatives, 2020-2035
  • Table 24: Latin America Market Volume (MT) Forecast by Derivatives, 2020-2035
  • Table 25: Western Europe Market Value (USD Million) Forecast by Country, 2020-2035
  • Table 26: Western Europe Market Volume (MT) Forecast by Country, 2020-2035
  • Table 27: Western Europe Market Value (USD Million) Forecast by Grade, 2020-2035
  • Table 28: Western Europe Market Volume (MT) Forecast by Grade, 2020-2035
  • Table 29: Western Europe Market Value (USD Million) Forecast by Application, 2020-2035
  • Table 30: Western Europe Market Volume (MT) Forecast by Application, 2020-2035
  • Table 31: Western Europe Market Value (USD Million) Forecast by Derivatives, 2020-2035
  • Table 32: Western Europe Market Volume (MT) Forecast by Derivatives, 2020-2035
  • Table 33: Eastern Europe Market Value (USD Million) Forecast by Country, 2020-2035
  • Table 34: Eastern Europe Market Volume (MT) Forecast by Country, 2020-2035
  • Table 35: Eastern Europe Market Value (USD Million) Forecast by Grade, 2020-2035
  • Table 36: Eastern Europe Market Volume (MT) Forecast by Grade, 2020-2035
  • Table 37: Eastern Europe Market Value (USD Million) Forecast by Application, 2020-2035
  • Table 38: Eastern Europe Market Volume (MT) Forecast by Application, 2020-2035
  • Table 39: Eastern Europe Market Value (USD Million) Forecast by Derivatives, 2020-2035
  • Table 40: Eastern Europe Market Volume (MT) Forecast by Derivatives, 2020-2035
  • Table 41: East Asia Market Value (USD Million) Forecast by Country, 2020-2035
  • Table 42: East Asia Market Volume (MT) Forecast by Country, 2020-2035
  • Table 43: East Asia Market Value (USD Million) Forecast by Grade, 2020-2035
  • Table 44: East Asia Market Volume (MT) Forecast by Grade, 2020-2035
  • Table 45: East Asia Market Value (USD Million) Forecast by Application, 2020-2035
  • Table 46: East Asia Market Volume (MT) Forecast by Application, 2020-2035
  • Table 47: East Asia Market Value (USD Million) Forecast by Derivatives, 2020-2035
  • Table 48: East Asia Market Volume (MT) Forecast by Derivatives, 2020-2035
  • Table 49: South Asia & Pacific Market Value (USD Million) Forecast by Country, 2020-2035
  • Table 50: South Asia & Pacific Market Volume (MT) Forecast by Country, 2020-2035
  • Table 51: South Asia & Pacific Market Value (USD Million) Forecast by Grade, 2020-2035
  • Table 52: South Asia & Pacific Market Volume (MT) Forecast by Grade, 2020-2035
  • Table 53: South Asia & Pacific Market Value (USD Million) Forecast by Application, 2020-2035
  • Table 54: South Asia & Pacific Market Volume (MT) Forecast by Application, 2020-2035
  • Table 55: South Asia & Pacific Market Value (USD Million) Forecast by Derivatives, 2020-2035
  • Table 56: South Asia & Pacific Market Volume (MT) Forecast by Derivatives, 2020-2035
  • Table 57: Middle East and Africa Market Value (USD Million) Forecast by Country, 2020-2035
  • Table 58: Middle East and Africa Market Volume (MT) Forecast by Country, 2020-2035
  • Table 59: Middle East and Africa Market Value (USD Million) Forecast by Grade, 2020-2035
  • Table 60: Middle East and Africa Market Volume (MT) Forecast by Grade, 2020-2035
  • Table 61: Middle East and Africa Market Value (USD Million) Forecast by Application, 2020-2035
  • Table 62: Middle East and Africa Market Volume (MT) Forecast by Application, 2020-2035
  • Table 63: Middle East and Africa Market Value (USD Million) Forecast by Derivatives, 2020-2035
  • Table 64: Middle East and Africa Market Volume (MT) Forecast by Derivatives, 2020-2035

List of Figures

  • Figure 1: Global Market Volume (MT) Forecast 2020-2035
  • Figure 2: Global Market Pricing Analysis
  • Figure 3: Global Market Value (USD Million) Forecast 2020-2035
  • Figure 4: Global Market Value Share and BPS Analysis by Grade, 2025 and 2035
  • Figure 5: Global Market Y-o-Y Growth Comparison by Grade, 2025-2035
  • Figure 6: Global Market Attractiveness Analysis by Grade
  • Figure 7: Global Market Value Share and BPS Analysis by Application, 2025 and 2035
  • Figure 8: Global Market Y-o-Y Growth Comparison by Application, 2025-2035
  • Figure 9: Global Market Attractiveness Analysis by Application
  • Figure 10: Global Market Value Share and BPS Analysis by Derivatives, 2025 and 2035
  • Figure 11: Global Market Y-o-Y Growth Comparison by Derivatives, 2025-2035
  • Figure 12: Global Market Attractiveness Analysis by Derivatives
  • Figure 13: Global Market Value (USD Million) Share and BPS Analysis by Region, 2025 and 2035
  • Figure 14: Global Market Y-o-Y Growth Comparison by Region, 2025-2035
  • Figure 15: Global Market Attractiveness Analysis by Region
  • Figure 16: North America Market Incremental $ Opportunity, 2025-2035
  • Figure 17: Latin America Market Incremental $ Opportunity, 2025-2035
  • Figure 18: Western Europe Market Incremental $ Opportunity, 2025-2035
  • Figure 19: Eastern Europe Market Incremental $ Opportunity, 2025-2035
  • Figure 20: East Asia Market Incremental $ Opportunity, 2025-2035
  • Figure 21: South Asia & Pacific Market Incremental $ Opportunity, 2025-2035
  • Figure 22: Middle East and Africa Market Incremental $ Opportunity, 2025-2035
  • Figure 23: North America Market Value Share and BPS Analysis by Country, 2025 and 2035
  • Figure 24: North America Market Value Share and BPS Analysis by Grade, 2025 and 2035
  • Figure 25: North America Market Y-o-Y Growth Comparison by Grade, 2025-2035
  • Figure 26: North America Market Attractiveness Analysis by Grade
  • Figure 27: North America Market Value Share and BPS Analysis by Application, 2025 and 2035
  • Figure 28: North America Market Y-o-Y Growth Comparison by Application, 2025-2035
  • Figure 29: North America Market Attractiveness Analysis by Application
  • Figure 30: North America Market Value Share and BPS Analysis by Derivatives, 2025 and 2035
  • Figure 31: North America Market Y-o-Y Growth Comparison by Derivatives, 2025-2035
  • Figure 32: North America Market Attractiveness Analysis by Derivatives
  • Figure 33: Latin America Market Value Share and BPS Analysis by Country, 2025 and 2035
  • Figure 34: Latin America Market Value Share and BPS Analysis by Grade, 2025 and 2035
  • Figure 35: Latin America Market Y-o-Y Growth Comparison by Grade, 2025-2035
  • Figure 36: Latin America Market Attractiveness Analysis by Grade
  • Figure 37: Latin America Market Value Share and BPS Analysis by Application, 2025 and 2035
  • Figure 38: Latin America Market Y-o-Y Growth Comparison by Application, 2025-2035
  • Figure 39: Latin America Market Attractiveness Analysis by Application
  • Figure 40: Latin America Market Value Share and BPS Analysis by Derivatives, 2025 and 2035
  • Figure 41: Latin America Market Y-o-Y Growth Comparison by Derivatives, 2025-2035
  • Figure 42: Latin America Market Attractiveness Analysis by Derivatives
  • Figure 43: Western Europe Market Value Share and BPS Analysis by Country, 2025 and 2035
  • Figure 44: Western Europe Market Value Share and BPS Analysis by Grade, 2025 and 2035
  • Figure 45: Western Europe Market Y-o-Y Growth Comparison by Grade, 2025-2035
  • Figure 46: Western Europe Market Attractiveness Analysis by Grade
  • Figure 47: Western Europe Market Value Share and BPS Analysis by Application, 2025 and 2035
  • Figure 48: Western Europe Market Y-o-Y Growth Comparison by Application, 2025-2035
  • Figure 49: Western Europe Market Attractiveness Analysis by Application
  • Figure 50: Western Europe Market Value Share and BPS Analysis by Derivatives, 2025 and 2035
  • Figure 51: Western Europe Market Y-o-Y Growth Comparison by Derivatives, 2025-2035
  • Figure 52: Western Europe Market Attractiveness Analysis by Derivatives
  • Figure 53: Eastern Europe Market Value Share and BPS Analysis by Country, 2025 and 2035
  • Figure 54: Eastern Europe Market Value Share and BPS Analysis by Grade, 2025 and 2035
  • Figure 55: Eastern Europe Market Y-o-Y Growth Comparison by Grade, 2025-2035
  • Figure 56: Eastern Europe Market Attractiveness Analysis by Grade
  • Figure 57: Eastern Europe Market Value Share and BPS Analysis by Application, 2025 and 2035
  • Figure 58: Eastern Europe Market Y-o-Y Growth Comparison by Application, 2025-2035
  • Figure 59: Eastern Europe Market Attractiveness Analysis by Application
  • Figure 60: Eastern Europe Market Value Share and BPS Analysis by Derivatives, 2025 and 2035
  • Figure 61: Eastern Europe Market Y-o-Y Growth Comparison by Derivatives, 2025-2035
  • Figure 62: Eastern Europe Market Attractiveness Analysis by Derivatives
  • Figure 63: East Asia Market Value Share and BPS Analysis by Country, 2025 and 2035
  • Figure 64: East Asia Market Value Share and BPS Analysis by Grade, 2025 and 2035
  • Figure 65: East Asia Market Y-o-Y Growth Comparison by Grade, 2025-2035
  • Figure 66: East Asia Market Attractiveness Analysis by Grade
  • Figure 67: East Asia Market Value Share and BPS Analysis by Application, 2025 and 2035
  • Figure 68: East Asia Market Y-o-Y Growth Comparison by Application, 2025-2035
  • Figure 69: East Asia Market Attractiveness Analysis by Application
  • Figure 70: East Asia Market Value Share and BPS Analysis by Derivatives, 2025 and 2035
  • Figure 71: East Asia Market Y-o-Y Growth Comparison by Derivatives, 2025-2035
  • Figure 72: East Asia Market Attractiveness Analysis by Derivatives
  • Figure 73: South Asia & Pacific Market Value Share and BPS Analysis by Country, 2025 and 2035
  • Figure 74: South Asia & Pacific Market Value Share and BPS Analysis by Grade, 2025 and 2035
  • Figure 75: South Asia & Pacific Market Y-o-Y Growth Comparison by Grade, 2025-2035
  • Figure 76: South Asia & Pacific Market Attractiveness Analysis by Grade
  • Figure 77: South Asia & Pacific Market Value Share and BPS Analysis by Application, 2025 and 2035
  • Figure 78: South Asia & Pacific Market Y-o-Y Growth Comparison by Application, 2025-2035
  • Figure 79: South Asia & Pacific Market Attractiveness Analysis by Application
  • Figure 80: South Asia & Pacific Market Value Share and BPS Analysis by Derivatives, 2025 and 2035
  • Figure 81: South Asia & Pacific Market Y-o-Y Growth Comparison by Derivatives, 2025-2035
  • Figure 82: South Asia & Pacific Market Attractiveness Analysis by Derivatives
  • Figure 83: Middle East and Africa Market Value Share and BPS Analysis by Country, 2025 and 2035
  • Figure 84: Middle East and Africa Market Value Share and BPS Analysis by Grade, 2025 and 2035
  • Figure 85: Middle East and Africa Market Y-o-Y Growth Comparison by Grade, 2025-2035
  • Figure 86: Middle East and Africa Market Attractiveness Analysis by Grade
  • Figure 87: Middle East and Africa Market Value Share and BPS Analysis by Application, 2025 and 2035
  • Figure 88: Middle East and Africa Market Y-o-Y Growth Comparison by Application, 2025-2035
  • Figure 89: Middle East and Africa Market Attractiveness Analysis by Application
  • Figure 90: Middle East and Africa Market Value Share and BPS Analysis by Derivatives, 2025 and 2035
  • Figure 91: Middle East and Africa Market Y-o-Y Growth Comparison by Derivatives, 2025-2035
  • Figure 92: Middle East and Africa Market Attractiveness Analysis by Derivatives
  • Figure 93: Global Market - Tier Structure Analysis
  • Figure 94: Global Market - Company Share Analysis

Frequently Asked Questions

What is the projected size of the benzaldehyde market by 2035?

The market is expected to reach USD 969.8 million by 2035.

What is the growth rate forecast for the benzaldehyde market?

The market is projected to expand at a CAGR of 4.8% from 2025 to 2035.

Which is the leading application segment in the benzaldehyde market?

Flavor and fragrance leads with a 28.2% share in 2025.

Which derivative type accounts for the highest market share in the benzaldehyde market?

Benzoic acid dominates with a 24.6% share in 2025.

Which country is witnessing the fastest growth in the benzaldehyde market?

India is forecast to grow at the fastest rate, with a CAGR of 5.2% during the period.

Future Market Insights

Benzaldehyde Market