Bioinsecticides Market
A Detailed Analysis of Bioinsecticides Market on the basis of Microbials and Plants
Are Bioinsecticides the Key to Balancing Effective Pest Control and Eco-friendly Practices across Japan, Korea, the United States, Germany, the United Kingdom, and 30+ Countries? Read in FMI’s Report!
Bioinsecticides Market Outlook (2023 to 2033)
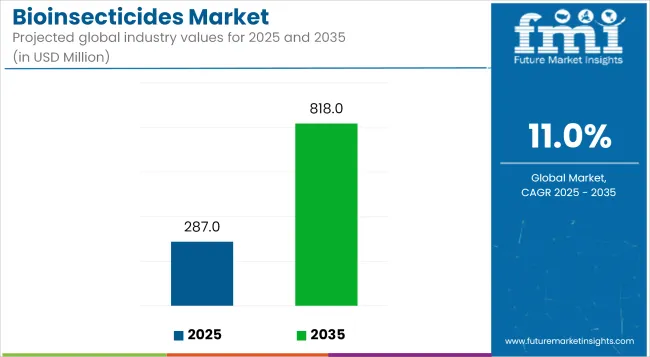
The global bioinsecticides market size is estimated to surpass a valuation of US$ 287 million by 2033. It is anticipated to cross a value of around US$ 101.3 million in 2023. A CAGR of 11.0% is expected for the market in the assessment period 2023 to 2033.
The global market for bioinsecticides stood at a valuation of about US$ 90.5 million in 2022. It is projected to create an absolute dollar opportunity of US$ 185.7 million in the forecast period.
Recent years have seen a steady increase in the market for bioinsecticides. It is mainly driven by a number of compelling considerations that underscore the changing nature of agriculture and pest control.
The pattern is a sign of a more general shift toward ecologically friendly and sustainable agricultural methods. Rising understanding of the detrimental effects of conventional chemical insecticides on human health, non-target creatures, and ecosystem is one of the key drivers.
Alternatives that are less detrimental to both the environment and human well-being are increasingly needed. This is attributed to rising concerns about these effects among consumers and authorities worldwide.
Need for bioinsecticides has increased due to the popularity of integrated pest management (IPM) techniques. IPM reduces the over-reliance on chemical solutions by emphasizing the use of diverse pest management techniques in a holistic strategy.
Since they are made from living things such as fungi, bacteria, and plants, bioinsecticides fit in well with IPM's guiding principles. They offer a powerful tool for managing pest populations. They can also help in preventing the target pests from developing resistance, a problem frequently connected to chemical pesticides.
Invasive pests have expanded to new areas as a result of greater trade and globalization, seriously harming ecosystems and agriculture. Bioinsecticides might have a distinct advantage in the fight against these invading species. They might be carefully formulated to kill these pests without affecting native species.
Bioinsecticides are considered a favored option for preserving biodiversity and ecological equilibrium in agricultural settings. These have a fine targeting capability and little negative effect on helpful insects such as pollinators and predators.
Use of chemical pesticides is subject to stronger laws, which is encouraging producers and landowners to look into more environmentally friendly options. Bioinsecticides are set to be a good option for crops destined for exporting and those subject to strict residue rules.
They frequently have shorter pre-harvest durations and reduced maximum residue levels. Rising use of bioinsecticides as a component of an all-encompassing pest management approach is a result of this regulatory pressure. High demand for food free of residues might also propel sales.
Discovery and creation of new bioinsecticide compositions that offer improved efficacy and extended shelf life is the result of advances in biotechnology & research. Farmers might be more inclined to include these items into their methods for managing pests.
Rising demand for bioinsecticides would reflect a wider shift toward sustainable agriculture. This is expected to put long-term ecological health and food security ahead of short-term concerns.
Attributes | Key Insights |
---|---|
Bioinsecticides Market Estimated Size (2023E) | US$ 101.3 million |
Projected Market Valuation (2033F) | US$ 287 million |
Value-based CAGR (2023 to 2033) | 11.0% |
United States Value-based CAGR (2023 to 2033) | 10.9% |
Don't pay for what you don't need
Customize your report by selecting specific countries or regions and save 30%!
2018 to 2022 Bioinsecticides Market Outlook Compared to Demand/Sales Forecast for/from 2023 to 2033
The global bioinsecticides market expanded at a considerable CAGR of 12.5% in the historical period from 2018 to 2022. It is anticipated to witness a CAGR of 11.0% in the review period.
Due to several criteria that highlight their efficiency and compatibility with contemporary agricultural practices, bioinsecticides are currently gaining headway on a global scale. Growing knowledge about the quality and safety of foods is a key factor promoting their acceptance.
Bioinsecticides might present a convincing response to the growing worries about possible health dangers linked to chemical residues in food. Need for safer and healthier produce is perfectly matched by the handful or nonexistent residues that these organic items leave behind.
Another important factor pushing bioinsecticide demand is the urgent need to tackle global warming and its effects on agriculture. Pests are adapting and expanding as weather conditions become more unpredictable, posing serious dangers to crops.
Bioinsecticides might provide flexible and evolving pest management techniques that can better deal with altering pest behavior brought on by climatic changes. These pesticides are frequently based on living creatures such as helpful insects or microorganisms. Their popularity as an eco-friendly and effective pest control method can be increased by their versatility.
Interconnection of the global market has enhanced knowledge sharing and public understanding of sustainable agriculture practices. Positive outcomes of bioinsecticides in one region of the world can quickly inspire and encourage adoption in other locations.
It is especially apt for developing nations as additional countries face comparable issues in controlling insects and environmental protection. Popularity of bioinsecticides as a tried-and-true substitute for traditional chemical pesticides might expand due to the global dissemination of information and expertise.
Bioinsecticides Market Trends, Restraints, and Opportunities
Attributes | Factors |
---|---|
Latest Trends |
|
Market Restraints |
|
Upcoming Opportunities |
|
Country-wise Insights
Government Support to Use Biological Pest Control Might Push Sales in South Korea
South Korea bioinsecticides market is likely to create an incremental opportunity of around US$ 10.7 million in the review period. It showcased an average CAGR of 12.1% in the historical period from 2018 to 2022.
Due to a confluence of elements particular to the agricultural environment and consumer tastes of the country, bioinsecticides are gaining popularity in South Korea. Increasing focus on the quality and safety of food in South Korea is one of the motivating factors.
Pesticide residues in food are causing customers to become more concerned, which has increased the desire for safer and better food options. Bioinsecticides fit in suitably with this consumer-driven desire for pure and healthy products. This is due to their low residual levels and negligible effect on non-target organisms.
Dense and varied farming geography of South Korea is a key factor in growth of bioinsecticide sales. There is a need for pest management methods that are both efficient and flexible as different crops are produced in comparatively small spaces.
Targeted approach offered by bioinsecticides is estimated to be ideal for the country's diverse agricultural terrain. These are renowned for their selectivity and capacity for targeting pests while protecting beneficial insects.
Growing importance of bioinsecticides is also influenced by government regulations and incentives. South Korea has been working to encourage organic farming and lessen the use of toxic pesticides.
Accordingly, the government has supported bioinsecticide research, production, and adoption with subsidies, grants, and educational programs. Increased usage of bioinsecticides is a result of the regulatory encouragement given to farmers to look into environmentally suitable alternatives.
For instance, in January 2021, a novel insecticide active ingredient's global registration process started at BASF. In Australia and Korea, the business submitted the Axalion insecticide's regulatory dossiers. The action represents a significant turning point in the growth of BASF's worldwide pesticide portfolio and the company's position as a provider of eco-friendly agricultural technologies.
Launch of Novel Plant-based Bioinsecticides in Japan to Augment Demand through 2033
Japan bioinsecticides market is projected to witness a CAGR of 10.9% in the evaluation period from 2023 to 2033. It is expected to top a valuation of US$ 41.6 million by 2033.
Rising use of bioinsecticides in Japan can be ascribed to a number of elements that are consistent with both the nation's agricultural and cultural norms. Japan's strong focus on preservation of the environment and sustainability is one important reason.
Bioinsecticides fit very well with the country’s dedication to upholding ecological balance and reducing harm to non-target organisms. This is a result of a long history of harmonious living with the environment and a fundamental appreciation for nature.
Japan's emphasis on precision and innovation in agriculture has benefited the development of bioinsecticides. Highly specialized character of bioinsecticides is complemented by the nation's cutting-edge technical landscape.
It includes robotics and precision agricultural methods. These products blend in perfectly with Japan's technologically advanced agricultural processes. These are also frequently tailored to particular pests and might help in enabling effective & precise pest management.
Widespread use of bioinsecticides in Japan has also been fueled by need for secure and natural products. There is a desire for produce free of chemical residues due to discriminating demand that places a premium on health and purity.
Bioinsecticides are expected to provide farmers looking to live up to consumer standards with an appealing choice. These are likely to be popular for leaving behind very little residue.
With the introduction of BASF's Sankei Kotetsu bait pesticide, Japan-based spinach growers will have a new choice for controlling insect pests. The new chemical offers long-term defense against tyrophagus similis. The chemical was created in partnership with Sankei Chemical Co., Ltd.
Another factor augmenting bioinsecticide demand is increasing aging of Japan's farming population. A growing number of people are interested in implementing environmentally friendly and sustainable techniques as younger generations enter the agricultural profession.
New farmers want to ensure the long-term wellbeing of their communities and lands. Bioinsecticides are expected to provide an alternative to traditional chemical pesticides. They are hence projected to be in line with their goals in this regard.
Category-wise Insights
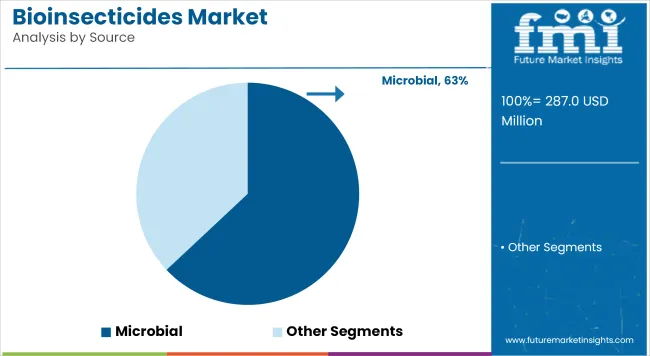
Microbials to be the Most Sought-after Source of Eco-friendly Pest Management Solution
Based on source, the microbials segment is anticipated to witness a CAGR of about 10.9% in the assessment period. It grew steadily at a CAGR of 12.4% in the historical period.
Demand for microbials is expected to surge in the bioinsecticides industry by 2033. Their environmental consciousness is one important aspect.
Microbial bioinsecticides are in accordance with the global movement toward ecologically conscious and sustainable agriculture. They are made from naturally existing microorganisms such as bacteria, fungus, and viruses.
Consumers and farmers looking for safer and more environmentally friendly pest management solutions are expected to push demand. This is attributed to their decreased effect on organisms that are not targeted and low residual levels, which might make them an enticing option.
The problem of pesticide resistance is yet another segment driving factor. Pests that have gained resistance to traditional chemical insecticides are becoming a bigger threat.
Microbial bioinsecticides might offer a new mode of action that would be able to reduce the emergence of resistance. As a result, they are useful tools in integrated pest control techniques. They might offer a novel strategy for reducing pest populations that doesn't only rely on chemicals.
Producers of Cereals and Grains to Look for Novel Biological Insecticides Worldwide
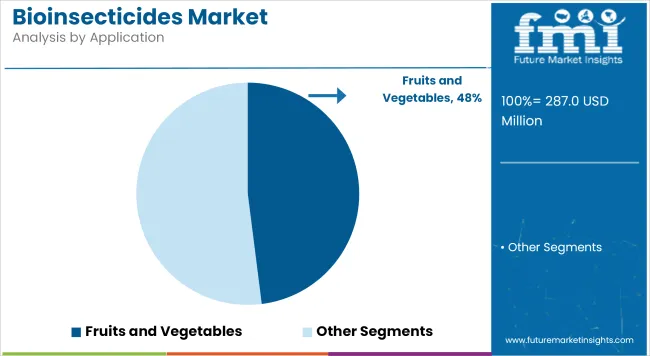
In terms of application, the cereals and grains segment registered a CAGR of 12.1% between 2018 and 2022. It is projected to record a 10.8% CAGR through 2033 in the bioinsecticides market.
Sensitivity of grains and cereals to a wide range of insect pests is a crucial factor pushing demand. Due to their great nutritional value and substantial surface area, these crops frequently serve as an ideal habitat for pests.
They are hence often considered desirable prey. With their specific targeting mechanisms, bioinsecticides might provide a precise and efficient way to eliminate these pests without endangering the crops.
Desire for bioinsecticides is influenced by the sizable area dedicated to growth of grains and cereals. Large-scale monoculture techniques can cause a quick rise in pest populations, raising the possibility of infestations.
With their potential to be used widely, bioinsecticides offer a workable approach for controlling pest pressures across extensive agricultural areas. At the same time, they are capable of preserving environmental integrity, which might aid demand.
Another motivating element for the use of bioinsecticides in grains and cereals is high demand for residue-free or low-residue crops. Pesticide residues found in food are subject to strict laws in several areas.
Laws are especially stringent when it comes to essentials of the human diet such as cereals and grains. Bioinsecticides fit the desire for a safer and healthier product as they frequently leave a small amount of residues and require shorter pre-harvest periods.
Get the data you need at a Fraction of the cost
Personalize your report by choosing insights you need
and save 40%!
Competitive Landscape
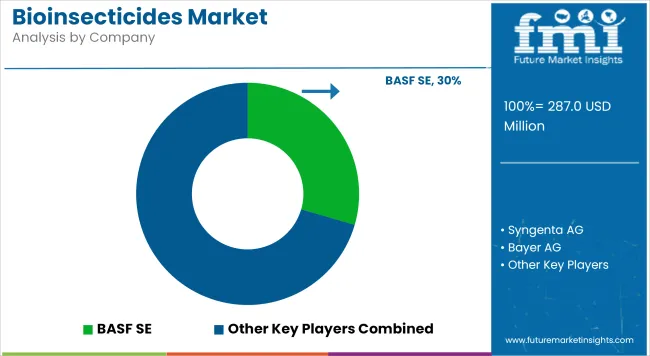
Bioinsecticide manufacturers are investing in research & development to create innovative formulations that improve the stability, shelf life, and effectiveness of products. This includes encapsulation technologies, adjuvants, and delivery systems that optimize the release of active ingredients.
They are leveraging biotechnology to engineer bioinsecticides with enhanced traits such as increased specificity, quicker action, and resistance to environmental factors. Genetic modifications would enable the production of bioinsecticides tailored to target specific pests effectively.
Small-scale manufacturers are investing in educational initiatives to inform farmers, agronomists, and consumers about the benefits of using bioinsecticides. Workshops, seminars, and online resources are being utilized to demonstrate proper application methods and highlight the environmental advantages.
A handful of other companies are obtaining certifications that validate their products' safety, efficacy, and environmental impact. Certifications such as organic certifications can enhance consumer trust and facilitate market access.
For instance,
- In February 2023, a prominent manufacturer of peptide-based bioinsecticides, Vestaron, introduced Spear RC, the latest member of the Spear family of products. This new product would help to kill lepidopteran pests such as armyworm, soybean looper, and cotton bollworm. It is meant for use in a wide range of crops such as rice, soybean, and cotton.
- In January 2022, NemaTrident and UniSpore, two next-generation bioinsecticides, were purchased by Syngenta Crop Protection AG from Bionema Limited. Customers will receive additional and complementary technologies from the new range to effectively control insect pests and resistance.
Scope of the Report
Attribute | Details |
---|---|
Estimated Market Size (2023) | US$ 101.3 million |
Projected Market Valuation (2033) | US$ 287 million |
Value-based CAGR (2023 to 2033) | 11.0% |
Historical Data | 2018 to 2022 |
Forecast Period | 2023 to 2033 |
Quantitative Units | Value (US$ million) |
Segments Covered |
|
Regions Covered | North America, Latin America, East Asia, South Asia Pacific, Western Europe, Eastern Europe, Middle East & Africa |
Key Countries Covered | United States, Canada, Brazil, Mexico, Germany, Italy, France, United Kingdom, Spain, Russia, GCC Countries, India, China, Japan and Australia |
Key Companies Profiled |
|
Report Coverage | Revenue Forecast, Volume Forecast, Company Ranking, Competitive Landscape, Growth Factors, Trends and Pricing Analysis |
Bioinsecticides Market Outlook by Category
By Source:
- Microbials
- Plants
- Others
By Application:
- Cereals & Grains
- Oilseed and Pulses
- Fruits and Vegetables
- Others
By Region:
- North America
- Latin America
- Western Europe
- Eastern Europe
- South Asia and Pacific
- East Asia
- Middle East and Africa
Frequently Asked Questions
How big is the bioinsecticides market?
The bioinsecticides industry is likely to top US$ 287 million in 2033.
At what CAGR would the market expand from 2023 to 2033?
The market is set to expand at 11.0% CAGR from 2023 to 2033.
At what CAGR did the market surge between 2018 and 2022?
The market exhibited a CAGR of 12.5% between 2018 and 2022.
At what CAGR will China market expand through 2033?
China market is estimated to expand at a CAGR of 10.9% through 2033.
Which is the dominant application segment in the market?
Cereals and grains segment might witness a CAGR of 10.8% from 2023 to 2033.
What is the United Kingdom market outlook?
The United Kingdom market is expected to exceed a valuation of US$ 6.5 million by 2033.
Table of Content
1. Executive Summary 1.1. Global Market Outlook 1.2. Demand-side Trends 1.3. Supply-side Trends 1.4. Technology Roadmap Analysis 1.5. Analysis and Recommendations 2. Market Overview 2.1. Market Coverage / Taxonomy 2.2. Market Definition / Scope / Limitations 3. Market Background 3.1. Market Dynamics 3.1.1. Drivers 3.1.2. Restraints 3.1.3. Opportunity 3.1.4. Trends 3.2. Scenario Forecast 3.2.1. Demand in Optimistic Scenario 3.2.2. Demand in Likely Scenario 3.2.3. Demand in Conservative Scenario 3.3. Opportunity Map Analysis 3.4. Product Life Cycle Analysis 3.5. Supply Chain Analysis 3.5.1. Supply Side Participants and their Roles 3.5.1.1. Producers 3.5.1.2. Mid-Level Participants (Traders/ Agents/ Brokers) 3.5.1.3. Wholesalers and Distributors 3.5.2. Value Added and Value Created at Node in the Supply Chain 3.5.3. List of Raw Material Suppliers 3.5.4. List of Existing and Potential Buyer’s 3.6. Investment Feasibility Matrix 3.7. Value Chain Analysis 3.7.1. Profit Margin Analysis 3.7.2. Wholesalers and Distributors 3.7.3. Retailers 3.8. PESTLE and Porter’s Analysis 3.9. Regulatory Landscape 3.9.1. By Key Regions 3.9.2. By Key Countries 3.10. Regional Parent Market Outlook 3.11. Production and Consumption Statistics 3.12. Import and Export Statistics 4. Global Market Analysis 2018 to 2022 and Forecast, 2023 to 2033 4.1. Historical Market Size Value (US$ million) & Volume (tons) Analysis, 2018 to 2022 4.2. Current and Future Market Size Value (US$ million) & Volume (tons) Projections, 2023 to 2033 4.2.1. Y-o-Y Growth Trend Analysis 4.2.2. Absolute $ Opportunity Analysis 5. Global Market Analysis 2018 to 2022 and Forecast 2023 to 2033, By Source 5.1. Introduction / Key Findings 5.2. Historical Market Size Value (US$ million) & Volume (tons) Analysis By Source, 2018 to 2022 5.3. Current and Future Market Size Value (US$ million) & Volume (tons) Analysis and Forecast By Source, 2023 to 2033 5.3.1. Microbials 5.3.2. Plants 5.3.3. Others 5.4. Y-o-Y Growth Trend Analysis By Source, 2018 to 2022 5.5. Absolute $ Opportunity Analysis By Source, 2023 to 2033 6. Global Market Analysis 2018 to 2022 and Forecast 2023 to 2033, By Application 6.1. Introduction / Key Findings 6.2. Historical Market Size Value (US$ million) & Volume (tons) Analysis By Application, 2018 to 2022 6.3. Current and Future Market Size Value (US$ million) & Volume (tons) Analysis and Forecast By Application, 2023 to 2033 6.3.1. Cereals & Grains 6.3.2. Oilseed and Pulses 6.3.3. Fruits and Vegetables 6.3.4. Others 6.4. Y-o-Y Growth Trend Analysis By Application, 2018 to 2022 6.5. Absolute $ Opportunity Analysis By Application, 2023 to 2033 7. Global Market Analysis 2018 to 2022 and Forecast 2023 to 2033, By Region 7.1. Introduction 7.2. Historical Market Size Value (US$ million) & Volume (tons) Analysis By Region, 2018 to 2022 7.3. Current Market Size Value (US$ million) & Volume (tons) Analysis and Forecast By Region, 2023 to 2033 7.3.1. North America 7.3.2. Latin America 7.3.3. Western Europe 7.3.4. Eastern Europe 7.3.5. South Asia and Pacific 7.3.6. East Asia 7.3.7. Middle East and Africa 7.4. Market Attractiveness Analysis By Region 8. North America Market Analysis 2018 to 2022 and Forecast 2023 to 2033, By Country 8.1. Historical Market Size Value (US$ million) & Volume (tons) Trend Analysis By Market Taxonomy, 2018 to 2022 8.2. Market Size Value (US$ million) & Volume (tons) Forecast By Market Taxonomy, 2023 to 2033 8.2.1. By Country 8.2.1.1. United States 8.2.1.2. Canada 8.2.2. By Source 8.2.3. By Application 8.3. Market Attractiveness Analysis 8.3.1. By Country 8.3.2. By Source 8.3.3. By Application 8.4. Key Takeaways 9. Latin America Market Analysis 2018 to 2022 and Forecast 2023 to 2033, By Country 9.1. Historical Market Size Value (US$ million) & Volume (tons) Trend Analysis By Market Taxonomy, 2018 to 2022 9.2. Market Size Value (US$ million) & Volume (tons) Forecast By Market Taxonomy, 2023 to 2033 9.2.1. By Country 9.2.1.1. Brazil 9.2.1.2. Mexico 9.2.1.3. Rest of Latin America 9.2.2. By Source 9.2.3. By Application 9.3. Market Attractiveness Analysis 9.3.1. By Country 9.3.2. By Source 9.3.3. By Application 9.4. Key Takeaways 10. Western Europe Market Analysis 2018 to 2022 and Forecast 2023 to 2033, By Country 10.1. Historical Market Size Value (US$ million) & Volume (tons) Trend Analysis By Market Taxonomy, 2018 to 2022 10.2. Market Size Value (US$ million) & Volume (tons) Forecast By Market Taxonomy, 2023 to 2033 10.2.1. By Country 10.2.1.1. Germany 10.2.1.2. United Kingdom 10.2.1.3. France 10.2.1.4. Spain 10.2.1.5. Italy 10.2.1.6. Rest of Western Europe 10.2.2. By Source 10.2.3. By Application 10.3. Market Attractiveness Analysis 10.3.1. By Country 10.3.2. By Source 10.3.3. By Application 10.4. Key Takeaways 11. Eastern Europe Market Analysis 2018 to 2022 and Forecast 2023 to 2033, By Country 11.1. Historical Market Size Value (US$ million) & Volume (tons) Trend Analysis By Market Taxonomy, 2018 to 2022 11.2. Market Size Value (US$ million) & Volume (tons) Forecast By Market Taxonomy, 2023 to 2033 11.2.1. By Country 11.2.1.1. Poland 11.2.1.2. Russia 11.2.1.3. Czech Republic 11.2.1.4. Romania 11.2.1.5. Rest of Eastern Europe 11.2.2. By Source 11.2.3. By Application 11.3. Market Attractiveness Analysis 11.3.1. By Country 11.3.2. By Source 11.3.3. By Application 11.4. Key Takeaways 12. South Asia and Pacific Market Analysis 2018 to 2022 and Forecast 2023 to 2033, By Country 12.1. Historical Market Size Value (US$ million) & Volume (tons) Trend Analysis By Market Taxonomy, 2018 to 2022 12.2. Market Size Value (US$ million) & Volume (tons) Forecast By Market Taxonomy, 2023 to 2033 12.2.1. By Country 12.2.1.1. India 12.2.1.2. Bangladesh 12.2.1.3. Australia 12.2.1.4. New Zealand 12.2.1.5. Rest of South Asia and Pacific 12.2.2. By Source 12.2.3. By Application 12.3. Market Attractiveness Analysis 12.3.1. By Country 12.3.2. By Source 12.3.3. By Application 12.4. Key Takeaways 13. East Asia Market Analysis 2018 to 2022 and Forecast 2023 to 2033, By Country 13.1. Historical Market Size Value (US$ million) & Volume (tons) Trend Analysis By Market Taxonomy, 2018 to 2022 13.2. Market Size Value (US$ million) & Volume (tons) Forecast By Market Taxonomy, 2023 to 2033 13.2.1. By Country 13.2.1.1. China 13.2.1.2. Japan 13.2.1.3. South Korea 13.2.2. By Source 13.2.3. By Application 13.3. Market Attractiveness Analysis 13.3.1. By Country 13.3.2. By Source 13.3.3. By Application 13.4. Key Takeaways 14. Middle East and Africa Market Analysis 2018 to 2022 and Forecast 2023 to 2033, By Country 14.1. Historical Market Size Value (US$ million) & Volume (tons) Trend Analysis By Market Taxonomy, 2018 to 2022 14.2. Market Size Value (US$ million) & Volume (tons) Forecast By Market Taxonomy, 2023 to 2033 14.2.1. By Country 14.2.1.1. GCC Countries 14.2.1.2. South Africa 14.2.1.3. Israel 14.2.1.4. Rest of Middle East and Africa 14.2.2. By Source 14.2.3. By Application 14.3. Market Attractiveness Analysis 14.3.1. By Country 14.3.2. By Source 14.3.3. By Application 14.4. Key Takeaways 15. Key Countries Market Analysis 15.1. United States 15.1.1. Pricing Analysis 15.1.2. Market Share Analysis, 2022 15.1.2.1. By Source 15.1.2.2. By Application 15.2. Canada 15.2.1. Pricing Analysis 15.2.2. Market Share Analysis, 2022 15.2.2.1. By Source 15.2.2.2. By Application 15.3. Brazil 15.3.1. Pricing Analysis 15.3.2. Market Share Analysis, 2022 15.3.2.1. By Source 15.3.2.2. By Application 15.4. Mexico 15.4.1. Pricing Analysis 15.4.2. Market Share Analysis, 2022 15.4.2.1. By Source 15.4.2.2. By Application 15.5. Germany 15.5.1. Pricing Analysis 15.5.2. Market Share Analysis, 2022 15.5.2.1. By Source 15.5.2.2. By Application 15.6. United Kingdom 15.6.1. Pricing Analysis 15.6.2. Market Share Analysis, 2022 15.6.2.1. By Source 15.6.2.2. By Application 15.7. France 15.7.1. Pricing Analysis 15.7.2. Market Share Analysis, 2022 15.7.2.1. By Source 15.7.2.2. By Application 15.8. Spain 15.8.1. Pricing Analysis 15.8.2. Market Share Analysis, 2022 15.8.2.1. By Source 15.8.2.2. By Application 15.9. Italy 15.9.1. Pricing Analysis 15.9.2. Market Share Analysis, 2022 15.9.2.1. By Source 15.9.2.2. By Application 15.10. Poland 15.10.1. Pricing Analysis 15.10.2. Market Share Analysis, 2022 15.10.2.1. By Source 15.10.2.2. By Application 15.11. Russia 15.11.1. Pricing Analysis 15.11.2. Market Share Analysis, 2022 15.11.2.1. By Source 15.11.2.2. By Application 15.12. Czech Republic 15.12.1. Pricing Analysis 15.12.2. Market Share Analysis, 2022 15.12.2.1. By Source 15.12.2.2. By Application 15.13. Romania 15.13.1. Pricing Analysis 15.13.2. Market Share Analysis, 2022 15.13.2.1. By Source 15.13.2.2. By Application 15.14. India 15.14.1. Pricing Analysis 15.14.2. Market Share Analysis, 2022 15.14.2.1. By Source 15.14.2.2. By Application 15.15. Bangladesh 15.15.1. Pricing Analysis 15.15.2. Market Share Analysis, 2022 15.15.2.1. By Source 15.15.2.2. By Application 15.16. Australia 15.16.1. Pricing Analysis 15.16.2. Market Share Analysis, 2022 15.16.2.1. By Source 15.16.2.2. By Application 15.17. New Zealand 15.17.1. Pricing Analysis 15.17.2. Market Share Analysis, 2022 15.17.2.1. By Source 15.17.2.2. By Application 15.18. China 15.18.1. Pricing Analysis 15.18.2. Market Share Analysis, 2022 15.18.2.1. By Source 15.18.2.2. By Application 15.19. Japan 15.19.1. Pricing Analysis 15.19.2. Market Share Analysis, 2022 15.19.2.1. By Source 15.19.2.2. By Application 15.20. South Korea 15.20.1. Pricing Analysis 15.20.2. Market Share Analysis, 2022 15.20.2.1. By Source 15.20.2.2. By Application 15.21. GCC Countries 15.21.1. Pricing Analysis 15.21.2. Market Share Analysis, 2022 15.21.2.1. By Source 15.21.2.2. By Application 15.22. South Africa 15.22.1. Pricing Analysis 15.22.2. Market Share Analysis, 2022 15.22.2.1. By Source 15.22.2.2. By Application 15.23. Israel 15.23.1. Pricing Analysis 15.23.2. Market Share Analysis, 2022 15.23.2.1. By Source 15.23.2.2. By Application 16. Market Structure Analysis 16.1. Competition Dashboard 16.2. Competition Benchmarking 16.3. Market Share Analysis of Top Players 16.3.1. By Regional 16.3.2. By Source 16.3.3. By Application 17. Competition Analysis 17.1. Competition Deep Dive 17.1.1. BASF SE 17.1.1.1. Overview 17.1.1.2. Product Portfolio 17.1.1.3. Profitability by Market Segments 17.1.1.4. Sales Footprint 17.1.1.5. Strategy Overview 17.1.1.5.1. Marketing Strategy 17.1.1.5.2. Product Strategy 17.1.1.5.3. Channel Strategy 17.1.2. Bayer AG 17.1.2.1. Overview 17.1.2.2. Product Portfolio 17.1.2.3. Profitability by Market Segments 17.1.2.4. Sales Footprint 17.1.2.5. Strategy Overview 17.1.2.5.1. Marketing Strategy 17.1.2.5.2. Product Strategy 17.1.2.5.3. Channel Strategy 17.1.3. Certis USA L.L.C. 17.1.3.1. Overview 17.1.3.2. Product Portfolio 17.1.3.3. Profitability by Market Segments 17.1.3.4. Sales Footprint 17.1.3.5. Strategy Overview 17.1.3.5.1. Marketing Strategy 17.1.3.5.2. Product Strategy 17.1.3.5.3. Channel Strategy 17.1.4. Novozymes 17.1.4.1. Overview 17.1.4.2. Product Portfolio 17.1.4.3. Profitability by Market Segments 17.1.4.4. Sales Footprint 17.1.4.5. Strategy Overview 17.1.4.5.1. Marketing Strategy 17.1.4.5.2. Product Strategy 17.1.4.5.3. Channel Strategy 17.1.5. Marrone Bio Innovations 17.1.5.1. Overview 17.1.5.2. Product Portfolio 17.1.5.3. Profitability by Market Segments 17.1.5.4. Sales Footprint 17.1.5.5. Strategy Overview 17.1.5.5.1. Marketing Strategy 17.1.5.5.2. Product Strategy 17.1.5.5.3. Channel Strategy 17.1.6. Syngenta 17.1.6.1. Overview 17.1.6.2. Product Portfolio 17.1.6.3. Profitability by Market Segments 17.1.6.4. Sales Footprint 17.1.6.5. Strategy Overview 17.1.6.5.1. Marketing Strategy 17.1.6.5.2. Product Strategy 17.1.6.5.3. Channel Strategy 17.1.7. Nufarm 17.1.7.1. Overview 17.1.7.2. Product Portfolio 17.1.7.3. Profitability by Market Segments 17.1.7.4. Sales Footprint 17.1.7.5. Strategy Overview 17.1.7.5.1. Marketing Strategy 17.1.7.5.2. Product Strategy 17.1.7.5.3. Channel Strategy 17.1.8. VALENT BioSciences 17.1.8.1. Overview 17.1.8.2. Product Portfolio 17.1.8.3. Profitability by Market Segments 17.1.8.4. Sales Footprint 17.1.8.5. Strategy Overview 17.1.8.5.1. Marketing Strategy 17.1.8.5.2. Product Strategy 17.1.8.5.3. Channel Strategy 17.1.9. BioWorks 17.1.9.1. Overview 17.1.9.2. Product Portfolio 17.1.9.3. Profitability by Market Segments 17.1.9.4. Sales Footprint 17.1.9.5. Strategy Overview 17.1.9.5.1. Marketing Strategy 17.1.9.5.2. Product Strategy 17.1.9.5.3. Channel Strategy 17.1.10. Vestaron Corporation 17.1.10.1. Overview 17.1.10.2. Product Portfolio 17.1.10.3. Profitability by Market Segments 17.1.10.4. Sales Footprint 17.1.10.5. Strategy Overview 17.1.10.5.1. Marketing Strategy 17.1.10.5.2. Product Strategy 17.1.10.5.3. Channel Strategy 18. Assumptions & Acronyms Used 19. Research Methodology
Don't pay for what you don't need
Customize your report by selecting specific countries or regions and save 30%!
List of Tables
Table 1: Global Market Value (US$ million) Forecast by Region, 2018 to 2033 Table 2: Global Market Volume (tons) Forecast by Region, 2018 to 2033 Table 3: Global Market Value (US$ million) Forecast by Source, 2018 to 2033 Table 4: Global Market Volume (tons) Forecast by Source, 2018 to 2033 Table 5: Global Market Value (US$ million) Forecast by Application, 2018 to 2033 Table 6: Global Market Volume (tons) Forecast by Application, 2018 to 2033 Table 7: North America Market Value (US$ million) Forecast by Country, 2018 to 2033 Table 8: North America Market Volume (tons) Forecast by Country, 2018 to 2033 Table 9: North America Market Value (US$ million) Forecast by Source, 2018 to 2033 Table 10: North America Market Volume (tons) Forecast by Source, 2018 to 2033 Table 11: North America Market Value (US$ million) Forecast by Application, 2018 to 2033 Table 12: North America Market Volume (tons) Forecast by Application, 2018 to 2033 Table 13: Latin America Market Value (US$ million) Forecast by Country, 2018 to 2033 Table 14: Latin America Market Volume (tons) Forecast by Country, 2018 to 2033 Table 15: Latin America Market Value (US$ million) Forecast by Source, 2018 to 2033 Table 16: Latin America Market Volume (tons) Forecast by Source, 2018 to 2033 Table 17: Latin America Market Value (US$ million) Forecast by Application, 2018 to 2033 Table 18: Latin America Market Volume (tons) Forecast by Application, 2018 to 2033 Table 19: Western Europe Market Value (US$ million) Forecast by Country, 2018 to 2033 Table 20: Western Europe Market Volume (tons) Forecast by Country, 2018 to 2033 Table 21: Western Europe Market Value (US$ million) Forecast by Source, 2018 to 2033 Table 22: Western Europe Market Volume (tons) Forecast by Source, 2018 to 2033 Table 23: Western Europe Market Value (US$ million) Forecast by Application, 2018 to 2033 Table 24: Western Europe Market Volume (tons) Forecast by Application, 2018 to 2033 Table 25: Eastern Europe Market Value (US$ million) Forecast by Country, 2018 to 2033 Table 26: Eastern Europe Market Volume (tons) Forecast by Country, 2018 to 2033 Table 27: Eastern Europe Market Value (US$ million) Forecast by Source, 2018 to 2033 Table 28: Eastern Europe Market Volume (tons) Forecast by Source, 2018 to 2033 Table 29: Eastern Europe Market Value (US$ million) Forecast by Application, 2018 to 2033 Table 30: Eastern Europe Market Volume (tons) Forecast by Application, 2018 to 2033 Table 31: South Asia and Pacific Market Value (US$ million) Forecast by Country, 2018 to 2033 Table 32: South Asia and Pacific Market Volume (tons) Forecast by Country, 2018 to 2033 Table 33: South Asia and Pacific Market Value (US$ million) Forecast by Source, 2018 to 2033 Table 34: South Asia and Pacific Market Volume (tons) Forecast by Source, 2018 to 2033 Table 35: South Asia and Pacific Market Value (US$ million) Forecast by Application, 2018 to 2033 Table 36: South Asia and Pacific Market Volume (tons) Forecast by Application, 2018 to 2033 Table 37: East Asia Market Value (US$ million) Forecast by Country, 2018 to 2033 Table 38: East Asia Market Volume (tons) Forecast by Country, 2018 to 2033 Table 39: East Asia Market Value (US$ million) Forecast by Source, 2018 to 2033 Table 40: East Asia Market Volume (tons) Forecast by Source, 2018 to 2033 Table 41: East Asia Market Value (US$ million) Forecast by Application, 2018 to 2033 Table 42: East Asia Market Volume (tons) Forecast by Application, 2018 to 2033 Table 43: Middle East and Africa Market Value (US$ million) Forecast by Country, 2018 to 2033 Table 44: Middle East and Africa Market Volume (tons) Forecast by Country, 2018 to 2033 Table 45: Middle East and Africa Market Value (US$ million) Forecast by Source, 2018 to 2033 Table 46: Middle East and Africa Market Volume (tons) Forecast by Source, 2018 to 2033 Table 47: Middle East and Africa Market Value (US$ million) Forecast by Application, 2018 to 2033 Table 48: Middle East and Africa Market Volume (tons) Forecast by Application, 2018 to 2033
List of Charts
Figure 1: Global Market Value (US$ million) by Source, 2023 to 2033 Figure 2: Global Market Value (US$ million) by Application, 2023 to 2033 Figure 3: Global Market Value (US$ million) by Region, 2023 to 2033 Figure 4: Global Market Value (US$ million) Analysis by Region, 2018 to 2033 Figure 5: Global Market Volume (tons) Analysis by Region, 2018 to 2033 Figure 6: Global Market Value Share (%) and BPS Analysis by Region, 2023 to 2033 Figure 7: Global Market Y-o-Y Growth (%) Projections by Region, 2023 to 2033 Figure 8: Global Market Value (US$ million) Analysis by Source, 2018 to 2033 Figure 9: Global Market Volume (tons) Analysis by Source, 2018 to 2033 Figure 10: Global Market Value Share (%) and BPS Analysis by Source, 2023 to 2033 Figure 11: Global Market Y-o-Y Growth (%) Projections by Source, 2023 to 2033 Figure 12: Global Market Value (US$ million) Analysis by Application, 2018 to 2033 Figure 13: Global Market Volume (tons) Analysis by Application, 2018 to 2033 Figure 14: Global Market Value Share (%) and BPS Analysis by Application, 2023 to 2033 Figure 15: Global Market Y-o-Y Growth (%) Projections by Application, 2023 to 2033 Figure 16: Global Market Attractiveness by Source, 2023 to 2033 Figure 17: Global Market Attractiveness by Application, 2023 to 2033 Figure 18: Global Market Attractiveness by Region, 2023 to 2033 Figure 19: North America Market Value (US$ million) by Source, 2023 to 2033 Figure 20: North America Market Value (US$ million) by Application, 2023 to 2033 Figure 21: North America Market Value (US$ million) by Country, 2023 to 2033 Figure 22: North America Market Value (US$ million) Analysis by Country, 2018 to 2033 Figure 23: North America Market Volume (tons) Analysis by Country, 2018 to 2033 Figure 24: North America Market Value Share (%) and BPS Analysis by Country, 2023 to 2033 Figure 25: North America Market Y-o-Y Growth (%) Projections by Country, 2023 to 2033 Figure 26: North America Market Value (US$ million) Analysis by Source, 2018 to 2033 Figure 27: North America Market Volume (tons) Analysis by Source, 2018 to 2033 Figure 28: North America Market Value Share (%) and BPS Analysis by Source, 2023 to 2033 Figure 29: North America Market Y-o-Y Growth (%) Projections by Source, 2023 to 2033 Figure 30: North America Market Value (US$ million) Analysis by Application, 2018 to 2033 Figure 31: North America Market Volume (tons) Analysis by Application, 2018 to 2033 Figure 32: North America Market Value Share (%) and BPS Analysis by Application, 2023 to 2033 Figure 33: North America Market Y-o-Y Growth (%) Projections by Application, 2023 to 2033 Figure 34: North America Market Attractiveness by Source, 2023 to 2033 Figure 35: North America Market Attractiveness by Application, 2023 to 2033 Figure 36: North America Market Attractiveness by Country, 2023 to 2033 Figure 37: Latin America Market Value (US$ million) by Source, 2023 to 2033 Figure 38: Latin America Market Value (US$ million) by Application, 2023 to 2033 Figure 39: Latin America Market Value (US$ million) by Country, 2023 to 2033 Figure 40: Latin America Market Value (US$ million) Analysis by Country, 2018 to 2033 Figure 41: Latin America Market Volume (tons) Analysis by Country, 2018 to 2033 Figure 42: Latin America Market Value Share (%) and BPS Analysis by Country, 2023 to 2033 Figure 43: Latin America Market Y-o-Y Growth (%) Projections by Country, 2023 to 2033 Figure 44: Latin America Market Value (US$ million) Analysis by Source, 2018 to 2033 Figure 45: Latin America Market Volume (tons) Analysis by Source, 2018 to 2033 Figure 46: Latin America Market Value Share (%) and BPS Analysis by Source, 2023 to 2033 Figure 47: Latin America Market Y-o-Y Growth (%) Projections by Source, 2023 to 2033 Figure 48: Latin America Market Value (US$ million) Analysis by Application, 2018 to 2033 Figure 49: Latin America Market Volume (tons) Analysis by Application, 2018 to 2033 Figure 50: Latin America Market Value Share (%) and BPS Analysis by Application, 2023 to 2033 Figure 51: Latin America Market Y-o-Y Growth (%) Projections by Application, 2023 to 2033 Figure 52: Latin America Market Attractiveness by Source, 2023 to 2033 Figure 53: Latin America Market Attractiveness by Application, 2023 to 2033 Figure 54: Latin America Market Attractiveness by Country, 2023 to 2033 Figure 55: Western Europe Market Value (US$ million) by Source, 2023 to 2033 Figure 56: Western Europe Market Value (US$ million) by Application, 2023 to 2033 Figure 57: Western Europe Market Value (US$ million) by Country, 2023 to 2033 Figure 58: Western Europe Market Value (US$ million) Analysis by Country, 2018 to 2033 Figure 59: Western Europe Market Volume (tons) Analysis by Country, 2018 to 2033 Figure 60: Western Europe Market Value Share (%) and BPS Analysis by Country, 2023 to 2033 Figure 61: Western Europe Market Y-o-Y Growth (%) Projections by Country, 2023 to 2033 Figure 62: Western Europe Market Value (US$ million) Analysis by Source, 2018 to 2033 Figure 63: Western Europe Market Volume (tons) Analysis by Source, 2018 to 2033 Figure 64: Western Europe Market Value Share (%) and BPS Analysis by Source, 2023 to 2033 Figure 65: Western Europe Market Y-o-Y Growth (%) Projections by Source, 2023 to 2033 Figure 66: Western Europe Market Value (US$ million) Analysis by Application, 2018 to 2033 Figure 67: Western Europe Market Volume (tons) Analysis by Application, 2018 to 2033 Figure 68: Western Europe Market Value Share (%) and BPS Analysis by Application, 2023 to 2033 Figure 69: Western Europe Market Y-o-Y Growth (%) Projections by Application, 2023 to 2033 Figure 70: Western Europe Market Attractiveness by Source, 2023 to 2033 Figure 71: Western Europe Market Attractiveness by Application, 2023 to 2033 Figure 72: Western Europe Market Attractiveness by Country, 2023 to 2033 Figure 73: Eastern Europe Market Value (US$ million) by Source, 2023 to 2033 Figure 74: Eastern Europe Market Value (US$ million) by Application, 2023 to 2033 Figure 75: Eastern Europe Market Value (US$ million) by Country, 2023 to 2033 Figure 76: Eastern Europe Market Value (US$ million) Analysis by Country, 2018 to 2033 Figure 77: Eastern Europe Market Volume (tons) Analysis by Country, 2018 to 2033 Figure 78: Eastern Europe Market Value Share (%) and BPS Analysis by Country, 2023 to 2033 Figure 79: Eastern Europe Market Y-o-Y Growth (%) Projections by Country, 2023 to 2033 Figure 80: Eastern Europe Market Value (US$ million) Analysis by Source, 2018 to 2033 Figure 81: Eastern Europe Market Volume (tons) Analysis by Source, 2018 to 2033 Figure 82: Eastern Europe Market Value Share (%) and BPS Analysis by Source, 2023 to 2033 Figure 83: Eastern Europe Market Y-o-Y Growth (%) Projections by Source, 2023 to 2033 Figure 84: Eastern Europe Market Value (US$ million) Analysis by Application, 2018 to 2033 Figure 85: Eastern Europe Market Volume (tons) Analysis by Application, 2018 to 2033 Figure 86: Eastern Europe Market Value Share (%) and BPS Analysis by Application, 2023 to 2033 Figure 87: Eastern Europe Market Y-o-Y Growth (%) Projections by Application, 2023 to 2033 Figure 88: Eastern Europe Market Attractiveness by Source, 2023 to 2033 Figure 89: Eastern Europe Market Attractiveness by Application, 2023 to 2033 Figure 90: Eastern Europe Market Attractiveness by Country, 2023 to 2033 Figure 91: South Asia and Pacific Market Value (US$ million) by Source, 2023 to 2033 Figure 92: South Asia and Pacific Market Value (US$ million) by Application, 2023 to 2033 Figure 93: South Asia and Pacific Market Value (US$ million) by Country, 2023 to 2033 Figure 94: South Asia and Pacific Market Value (US$ million) Analysis by Country, 2018 to 2033 Figure 95: South Asia and Pacific Market Volume (tons) Analysis by Country, 2018 to 2033 Figure 96: South Asia and Pacific Market Value Share (%) and BPS Analysis by Country, 2023 to 2033 Figure 97: South Asia and Pacific Market Y-o-Y Growth (%) Projections by Country, 2023 to 2033 Figure 98: South Asia and Pacific Market Value (US$ million) Analysis by Source, 2018 to 2033 Figure 99: South Asia and Pacific Market Volume (tons) Analysis by Source, 2018 to 2033 Figure 100: South Asia and Pacific Market Value Share (%) and BPS Analysis by Source, 2023 to 2033 Figure 101: South Asia and Pacific Market Y-o-Y Growth (%) Projections by Source, 2023 to 2033 Figure 102: South Asia and Pacific Market Value (US$ million) Analysis by Application, 2018 to 2033 Figure 103: South Asia and Pacific Market Volume (tons) Analysis by Application, 2018 to 2033 Figure 104: South Asia and Pacific Market Value Share (%) and BPS Analysis by Application, 2023 to 2033 Figure 105: South Asia and Pacific Market Y-o-Y Growth (%) Projections by Application, 2023 to 2033 Figure 106: South Asia and Pacific Market Attractiveness by Source, 2023 to 2033 Figure 107: South Asia and Pacific Market Attractiveness by Application, 2023 to 2033 Figure 108: South Asia and Pacific Market Attractiveness by Country, 2023 to 2033 Figure 109: East Asia Market Value (US$ million) by Source, 2023 to 2033 Figure 110: East Asia Market Value (US$ million) by Application, 2023 to 2033 Figure 111: East Asia Market Value (US$ million) by Country, 2023 to 2033 Figure 112: East Asia Market Value (US$ million) Analysis by Country, 2018 to 2033 Figure 113: East Asia Market Volume (tons) Analysis by Country, 2018 to 2033 Figure 114: East Asia Market Value Share (%) and BPS Analysis by Country, 2023 to 2033 Figure 115: East Asia Market Y-o-Y Growth (%) Projections by Country, 2023 to 2033 Figure 116: East Asia Market Value (US$ million) Analysis by Source, 2018 to 2033 Figure 117: East Asia Market Volume (tons) Analysis by Source, 2018 to 2033 Figure 118: East Asia Market Value Share (%) and BPS Analysis by Source, 2023 to 2033 Figure 119: East Asia Market Y-o-Y Growth (%) Projections by Source, 2023 to 2033 Figure 120: East Asia Market Value (US$ million) Analysis by Application, 2018 to 2033 Figure 121: East Asia Market Volume (tons) Analysis by Application, 2018 to 2033 Figure 122: East Asia Market Value Share (%) and BPS Analysis by Application, 2023 to 2033 Figure 123: East Asia Market Y-o-Y Growth (%) Projections by Application, 2023 to 2033 Figure 124: East Asia Market Attractiveness by Source, 2023 to 2033 Figure 125: East Asia Market Attractiveness by Application, 2023 to 2033 Figure 126: East Asia Market Attractiveness by Country, 2023 to 2033 Figure 127: Middle East and Africa Market Value (US$ million) by Source, 2023 to 2033 Figure 128: Middle East and Africa Market Value (US$ million) by Application, 2023 to 2033 Figure 129: Middle East and Africa Market Value (US$ million) by Country, 2023 to 2033 Figure 130: Middle East and Africa Market Value (US$ million) Analysis by Country, 2018 to 2033 Figure 131: Middle East and Africa Market Volume (tons) Analysis by Country, 2018 to 2033 Figure 132: Middle East and Africa Market Value Share (%) and BPS Analysis by Country, 2023 to 2033 Figure 133: Middle East and Africa Market Y-o-Y Growth (%) Projections by Country, 2023 to 2033 Figure 134: Middle East and Africa Market Value (US$ million) Analysis by Source, 2018 to 2033 Figure 135: Middle East and Africa Market Volume (tons) Analysis by Source, 2018 to 2033 Figure 136: Middle East and Africa Market Value Share (%) and BPS Analysis by Source, 2023 to 2033 Figure 137: Middle East and Africa Market Y-o-Y Growth (%) Projections by Source, 2023 to 2033 Figure 138: Middle East and Africa Market Value (US$ million) Analysis by Application, 2018 to 2033 Figure 139: Middle East and Africa Market Volume (tons) Analysis by Application, 2018 to 2033 Figure 140: Middle East and Africa Market Value Share (%) and BPS Analysis by Application, 2023 to 2033 Figure 141: Middle East and Africa Market Y-o-Y Growth (%) Projections by Application, 2023 to 2033 Figure 142: Middle East and Africa Market Attractiveness by Source, 2023 to 2033 Figure 143: Middle East and Africa Market Attractiveness by Application, 2023 to 2033 Figure 144: Middle East and Africa Market Attractiveness by Country, 2023 to 2033
Recommendations
Explore Chemicals & Materials Insights
View Reports