Biosimulation Market Outlook (2022 to 2032)

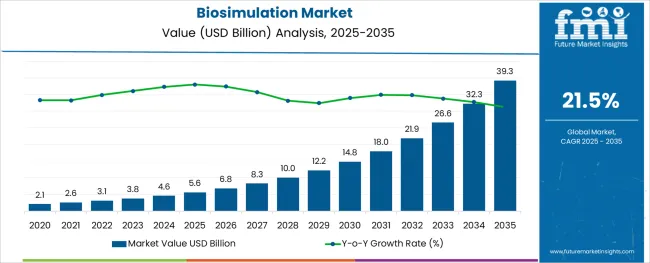
The Global Biosimulation Market was valued at around US$ 2.6 billion in 2021, with a projected CAGR of 21.5% for the next ten years the market is likely to reach a valuation of US$ 20.9 Billion by the end of 2032. The need for developing new drugs to compact the developing diseases will drive the demand for biosimulation.

Report Attributes Details
Estimated Market Value (2022E) US$ 3.1 Billion
Forecasted Market Value (2032F) US$ 20.9 Billion
Global Market Growth Rate (2022 to 2032) 21.5% CAGR
United States Growth Rate (2022 to 2032) ~21.6% CAGR
Key Companies Covered
  • Certara
  • Dassault Systemes
  • Advanced Chemistry Development
  • Simulation Plus Inc
  • Schrodinger, Inc.
  • Chemical Computing Group
  • Physiomics Plc
  • Rosa & Co. LLC
  • BioSimulation Consulting Inc.
  • Genedata AG
  • Instem Group of Companies
  • PPD, Inc.
  • Insilico Biotechnology AG
  • Rhenovia Pharma
  • LeadInvent Technologies
  • Nuventra Pharma
  • In Silico Biosciences

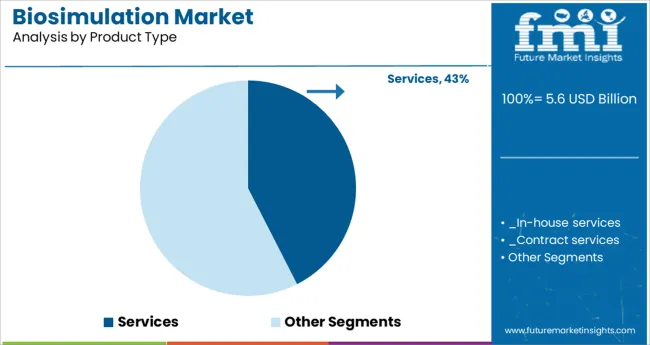
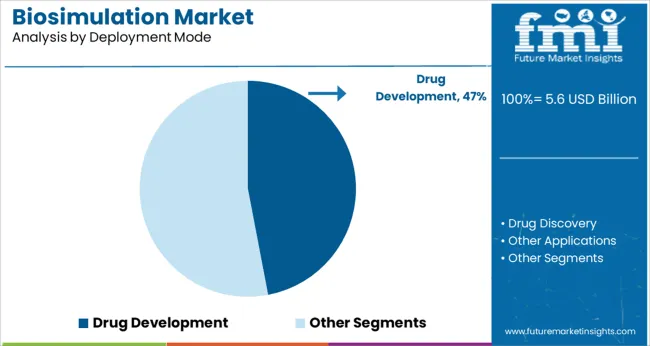
Future Market Insight’s analysis reveals that most of the revenue is generated from biosimulation software. On the other hand, drug development in deployment mode will be the most lucrative with a CAGR of 22.8% during the forecast period.

Don't pay for what you don't need

Customize your report by selecting specific countries or regions and save 30%!

Sale Analysis of Biosimulation from 2015 to 2021 Vs Market Outlook For 2022 to 2032

The global market for Biosimulation registered a CAGR of 15.8% from 2015 to 2021. The market growth is projected to surge due to technological advancement in software for biosimulation. In 2021, the global market size of biosimulation was valued at US$ 2.6 Billion and is estimated to increase to a valuation of US$ 3.1 Billion in 2022.

Biosimulation is the use of computer-aided mathematical models to simulate biological processes. Biosimulation has various applications like developing new drugs and discovering new drugs. The drug discovery and development process is expensive, and the failure of a therapeutic molecule in the late stages of drug development results in a massive waste of time, money, and other resources. As a result, a predictive tool is required to aid in predicting the future results of drug development through simulation of the biological processes involved.

Biosimulation helps to simulate the effect of drugs on the body with the help of simulation. Pharmaceutical manufacturers are using biosimulation throughout the drug development process to identify the positive and negative effects of their drug can have on the people if the drug is used.

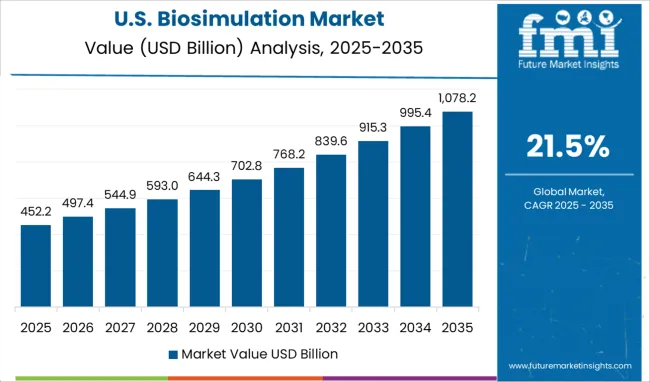
The global biosimulation market has predicted to surge ahead at a CAGR of 21.5% and record sales worth US$ 20.9 Billion by the end of 2032. US will continue to be the largest procurer of biosimulation throughout the analysis period accounting for over US$ 7.5 Billion absolute dollar opportunity in the coming 10-year epoch.

How will the Reduction in Operating Costs of Pharmaceutical Companies through Biosimulation Stimulate Market Growth?

Rising global healthcare spending will increase spending on developing drugs, which will drive revenue for biosimulation. Many drugs for mimic diseases are developed using biosimulation. Computers operating sickness simulations with the aid of biosimulation software can be used to conduct virtual clinical trials for new pharmaceutical treatments. Developing a new drug requires significant research and studies. Every stage of drug development from clinical trials to the approval of the drug has a serious chance of failure. Biosimulation lowers these odds by predicting these failures in the development process. Also, it lowers the cost of pharmaceutical companies by lowering the number of clinical trials.

Sabyasachi Ghosh
Sabyasachi Ghosh

Principal Consultant

Talk to Analyst

Find your sweet spots for generating winning opportunities in this market.

What factors are Restraining the Biosimulation Market?

Biosimulation uses mathematical equations to depict a real-life process that occurs within the human body. Researchers may simulate a wide range of scenarios and examine the behavior of a human system in diverse settings since it can duplicate human biological elements and their interactions with medications when they are put into the system.

In order to obtain a better result, skilled expertise is required to perform the biosimulation software. The demand for skilled expertise is high in research laboratories and companies. In addition, this process is very complex and highly technical as they involve various laboratory documentation systems. In order to overcome this issue, researchers must receive proper training and assistance. These factors make biosimulation development time-consuming, thus limiting its adoption among researchers.
Regional-wise Insights

How is the demand for Biosimulation shaping up in North America?

North America holds the largest market for biosimulation. The rising chronic disease among the population in the region and regulations implemented by the governments for patient safety and treatment standards is driving the demand for biosimulation in the region. In silico modeling is being used to boost the standard of patient care and safety. This is particularly true for the implementation of regulatory laws that have high standards for the safety and care of patients.
Get the data you need at a Fraction of the cost

Personalize your report by choosing insights you need
and save 40%!

Country-wise Insights

The USA Biosimulation Market Analysis

The encouraging government policies in the USA and the rising healthcare expenditure due to the dominance of chronic diseases are key factors that are rising drug development and discovery in the USA. The market for biosimulation in the USA has projected to reach a valuation of US$ 8.7 Billion in 2032.

China Biosimulation Market Analysis

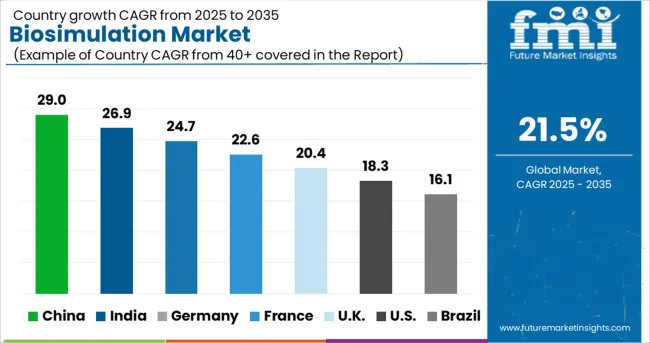
The government policies for developing quality pharmaceutical drugs and the Chinese government‘s commitment to develop and increase innovation in its healthcare system are driving the market for biosimulation in China. Chinese government’s plan to be a global leader in drug development is attracting drug development and pharmaceutical companies to China for the development of new drugs, which will further increase the demand for the biosimulation market over the years. The market for biosimulation in China is forecasted to reach a valuation of US$ 1.7 Billion by 2032.

the United Kingdom Biosimulation Market Analysis

The market in the United Kingdom is projected to reach a valuation of US$ 880 million by 2032. The market is expected to grow at a CAGR of 20.6% from 2022 to 2032 to gross an absolute dollar opportunity of US$ 336 million.

Japan Biosimulation Market Analysis

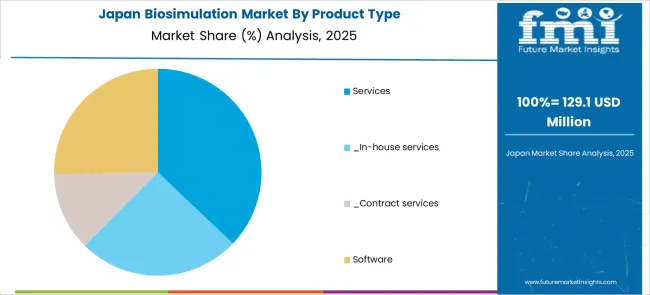
The market for biosimulation in Japan is expected to reach US$ 1.2 Billion by 2032. Growing at a CAGR of 25.1% during the forecast period, the market is likely to garner an absolute dollar opportunity of US$ 1.1 Billion.

Category-wise Insights

How is Biosimulation revenue through CROs going to perform over the forecast years?

The market through the CROs segment is anticipated to grow at the fastest rate during the forecast period. The growing tendency of firms to cut total spending is expected to drive segment growth. Other factors like increased efficiency and the ability to focus on core areas for company development will also drive the use of biosimulation in CROs.
Competitive Landscape

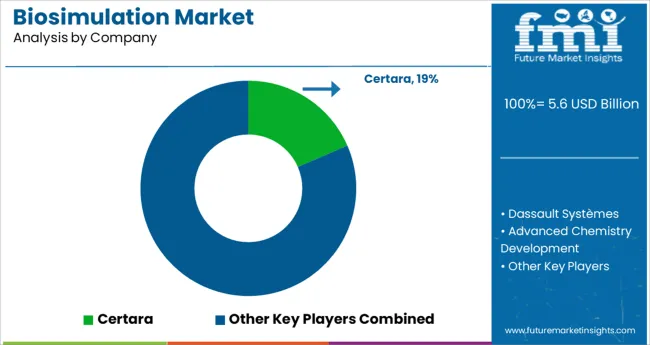
The key companies operating in the biosimulation market include Certara, Dassault Systemes, Advanced Chemistry Development, Simulation Plus Inc., Schrodinger, Inc., Chemical Computing Group, Physiomics Plc, Rosa & Co. LLC, BioSimulation Consulting Inc., Genedata AG, Instem Group of Companies, PPD, Inc., Insilico Biotechnology AG, Rhenovia Pharma, LeadInvent Technologies, Nuventra Pharma, and In Silico Biosciences.

Some of the recent developments by key providers of biosimulation are as follows:

  • In June 2022, Certara announced its new version of Biosimulation software for the progress of Novel Biologics. The new version includes Immunogenicity (IG), Immuno-Oncology (IO), and Vaccine simulators to understand and predict how drugs work and point out the key questions in the development of novel biologic therapies.
  • In June 2022, Genedata AG announced that Syros Pharmaceuticals has chosen Genedata AG’s Genedata Profiler as its data integration and investigative platform to accelerate its translational research strategy.
  • In March 2022, Advanced Chemistry labs announced that Pharmaron Inc. has chosen its NMR processing and interpretation software.
  • In March 2022, Simulation Plus, Inc. released its Membrane Plus 3.0 software. The new software includes improved data handling and simulation performance for in vitro-in vivo extrapolation (IVIVE) for permeability, skin penetration, and release assay systems.
  • In February 2022, the US Food and Drug Administration (FDA) approved the license for Certara’s Immunogenicity (IG) stimulator to research and assess immunogenicity in protein-based remedies.
  • In February 2022, Physiomics Plc updated a new agreement with ValiRx plc. According to the new agreement, ValiRx will be able to use Physiomics Plc’s latest version of its Virtual Tumour technology. Physiomics Plc will also help ValiRx in modeling the use of VAL201 peptide in endometriosis (VAL301) and Coronavirus (BC201).
  • In December 2021, Certara announced the release of Pinnacle 21 enterprise 5.1.0, which advances the software for making Clinical trial data for biosimulation and regulatory submission.
  • In September 2021, Instem Group of Companies acquired PDS Life Sciences (PDS). This acquisition will help Instem Group of Companies increase their research and development process and enable them to quickly develop and deliver solutions to their clients.
  • In March 2021, Instem Group of Companies acquired d-wise a clinical trial and technology and consulting company. Through this acquisition, Instem Group of Companies plans to bring their products faster to the market. The consolidation will also accelerate their research and development process in Insilico modeling and prediction solutions.

Similarly, the team at Future Market Insights has tracked recent developments related to companies offering Biosimulation, which is available in the full report.

Key Segments Covered in Biosimulation Industry Survey

Biosimulation Market by Product Type:

  • Services
    • In-house services
    • Contract services
  • Software

Biosimulation Market by Deployment Mode:

  • Drug Development
  • Drug Discovery
  • Other Applications

Biosimulation Market by End-use:

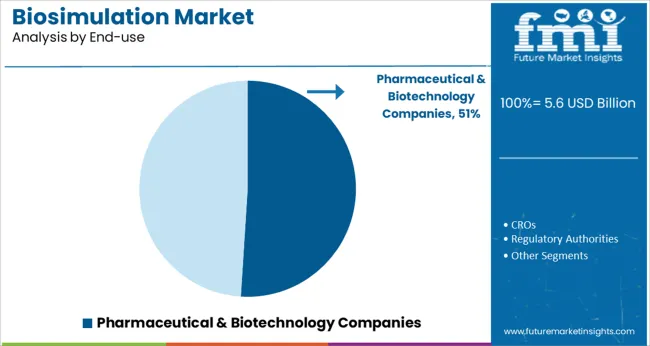
  • Pharmaceutical &Biotechnology Companies
  • CROs
  • Regulatory Authorities
  • Academic Research Institutions

Biosimulation Market by Region:

  • North America
  • Latin America
  • Europe
  • Asia Pacific
  • Middle East and Africa

Frequently Asked Questions

How much is the global Biosimulation market currently worth?

The global biosimulation market was valued at US$ 2.6 billion in 2021.

What is the Biosimulation Market Forecast through 2032?

The biosimulation industry is set to witness a high growth rate of 21.5% over the forecasted period and be valued at US$ 20.9 billion by 2032.

At what rate did demand Biosimulation increase over the past 7years?

The Biosimulation Market expanded at a CAGR of 15.8% from 2015 through 2021.

Who are the key players shaping the Biosimulation industry?

Certara, Dassault Systemes, Advanced Chemistry Development, Simulation Plus Inc, and Schrodinger, Inc. are the key providers of biosimulation.

Which are the top 5 countries driving the highest sales of Biosimulation?

The USA, United Kingdom, China Japan, and South Korea are expected to drive the most sales growth of Biosimulation.

What is the USA market share for Biosimulation over the forecasted period?

The market in the USA has forecasted to account for over 40% of the global market share in 2032.

Table of Content
1. Executive Summary | Biosimulation Market
    1.1. Global Market Outlook
    1.2. Demand-side Trends
    1.3. Supply-side Trends
    1.4. Technology Roadmap Analysis
    1.5. Analysis and Recommendations
2. Market Overview
    2.1. Market Coverage / Taxonomy
    2.2. Market Definition / Scope / Limitations
3. Market Background
    3.1. Market Dynamics
        3.1.1. Drivers
        3.1.2. Restraints
        3.1.3. Opportunity
        3.1.4. Trends
    3.2. Scenario Forecast
        3.2.1. Demand in Optimistic Scenario
        3.2.2. Demand in Likely Scenario
        3.2.3. Demand in Conservative Scenario
    3.3. Investment Feasibility Matrix
    3.4. Regulatory Landscape
        3.4.1. By Key Regions
        3.4.2. By Key Countries
4. Global Market Analysis 2015 to 2021 and Forecast, 2022 to 2032
    4.1. Historical Market Size Value (US$ million) Analysis, 2015 to 2021
    4.2. Current and Future Market Size Value (US$ million) Projections, 2022 to 2032
        4.2.1. Y-o-Y Growth Trend Analysis
        4.2.2. Absolute $ Opportunity Analysis
5. Global Market Analysis 2015 to 2021 and Forecast 2022 to 2032, By Product Type
    5.1. Introduction / Key Findings
    5.2. Historical Market Size Value (US$ million) Analysis By Product Type, 2015 to 2021
    5.3. Current and Future Market Size Value (US$ million) Analysis and Forecast By Product Type, 2022 to 2032
        5.3.1. Software
        5.3.2. Services
            5.3.2.1. In-house Services
            5.3.2.2. Contract Services
    5.4. Y-o-Y Growth Trend Analysis By Product Type, 2015 to 2021
    5.5. Absolute $ Opportunity Analysis By Product Type, 2022 to 2032
6. Global Market Analysis 2015 to 2021 and Forecast 2022 to 2032, By Deployment Mode
    6.1. Introduction / Key Findings
    6.2. Historical Market Size Value (US$ million) Analysis By Deployment Mode, 2015 to 2021
    6.3. Current and Future Market Size Value (US$ million) Analysis and Forecast By Deployment Mode, 2022 to 2032
        6.3.1. Drug Development
        6.3.2. Drug Discovery
        6.3.3. Other Applications
    6.4. Y-o-Y Growth Trend Analysis By Deployment Mode, 2015 to 2021
    6.5. Absolute $ Opportunity Analysis By Deployment Mode, 2022 to 2032
7. Global Market Analysis 2015 to 2021 and Forecast 2022 to 2032, By End Use
    7.1. Introduction / Key Findings
    7.2. Historical Market Size Value (US$ million) Analysis By End Use, 2015 to 2021
    7.3. Current and Future Market Size Value (US$ million) Analysis and Forecast By End Use, 2022 to 2032
        7.3.1. Pharmaceutical & Biotechnology Companies
        7.3.2. CROs
        7.3.3. Regulatory Authorities
        7.3.4. Academic Research Institutions
    7.4. Y-o-Y Growth Trend Analysis By End Use, 2015 to 2021
    7.5. Absolute $ Opportunity Analysis By End Use, 2022 to 2032
8. Global Market Analysis 2015 to 2021 and Forecast 2022 to 2032, By Region
    8.1. Introduction
    8.2. Historical Market Size Value (US$ million) Analysis By Region, 2015 to 2021
    8.3. Current Market Size Value (US$ million) Analysis and Forecast By Region, 2022 to 2032
        8.3.1. North America
        8.3.2. Latin America
        8.3.3. Europe
        8.3.4. East Asia
        8.3.5. South Asia
        8.3.6. Oceania
        8.3.7. Middle East and Africa (MEA)
    8.4. Market Attractiveness Analysis By Region
9. North America Market Analysis 2015 to 2021 and Forecast 2022 to 2032, By Country
    9.1. Historical Market Size Value (US$ million) Trend Analysis By Market Taxonomy, 2015 to 2021
    9.2. Market Size Value (US$ million) Forecast By Market Taxonomy, 2022 to 2032
        9.2.1. By Country
            9.2.1.1. The USA
            9.2.1.2. Canada
        9.2.2. By Product Type
        9.2.3. By Deployment Mode
        9.2.4. By End Use
    9.3. Market Attractiveness Analysis
        9.3.1. By Country
        9.3.2. By Product Type
        9.3.3. By Deployment Mode
        9.3.4. By End Use
    9.4. Key Takeaways
10. Latin America Market Analysis 2015 to 2021 and Forecast 2022 to 2032, By Country
    10.1. Historical Market Size Value (US$ million) Trend Analysis By Market Taxonomy, 2015 to 2021
    10.2. Market Size Value (US$ million) Forecast By Market Taxonomy, 2022 to 2032
        10.2.1. By Country
            10.2.1.1. Brazil
            10.2.1.2. Mexico
            10.2.1.3. Argentina
            10.2.1.4. Rest of Latin America
        10.2.2. By Product Type
        10.2.3. By Deployment Mode
        10.2.4. By End Use
    10.3. Market Attractiveness Analysis
        10.3.1. By Country
        10.3.2. By Product Type
        10.3.3. By Deployment Mode
        10.3.4. By End Use
    10.4. Key Takeaways
11. Europe Market Analysis 2015 to 2021 and Forecast 2022 to 2032, By Country
    11.1. Historical Market Size Value (US$ million) Trend Analysis By Market Taxonomy, 2015 to 2021
    11.2. Market Size Value (US$ million) Forecast By Market Taxonomy, 2022 to 2032
        11.2.1. By Country
            11.2.1.1. Germany
            11.2.1.2. Italy
            11.2.1.3. France
            11.2.1.4. The United Kingdom
            11.2.1.5. Spain
            11.2.1.6. Russia
            11.2.1.7. BENELUX
            11.2.1.8. Rest of Europe
        11.2.2. By Product Type
        11.2.3. By Deployment Mode
        11.2.4. By End Use
    11.3. Market Attractiveness Analysis
        11.3.1. By Country
        11.3.2. By Product Type
        11.3.3. By Deployment Mode
        11.3.4. By End Use
    11.4. Key Takeaways
12. East Asia Market Analysis 2015 to 2021 and Forecast 2022 to 2032, By Country
    12.1. Historical Market Size Value (US$ million) Trend Analysis By Market Taxonomy, 2015 to 2021
    12.2. Market Size Value (US$ million) Forecast By Market Taxonomy, 2022 to 2032
        12.2.1. By Country
            12.2.1.1. China
            12.2.1.2. Japan
            12.2.1.3. South Korea
        12.2.2. By Product Type
        12.2.3. By Deployment Mode
        12.2.4. By End Use
    12.3. Market Attractiveness Analysis
        12.3.1. By Country
        12.3.2. By Product Type
        12.3.3. By Deployment Mode
        12.3.4. By End Use
    12.4. Key Takeaways
13. South Asia Market Analysis 2015 to 2021 and Forecast 2022 to 2032, By Country
    13.1. Historical Market Size Value (US$ million) Trend Analysis By Market Taxonomy, 2015 to 2021
    13.2. Market Size Value (US$ million) Forecast By Market Taxonomy, 2022 to 2032
        13.2.1. By Country
            13.2.1.1. India
            13.2.1.2. Thailand
            13.2.1.3. Malaysia
            13.2.1.4. Indonesia
            13.2.1.5. Rest of South Asia
        13.2.2. By Product Type
        13.2.3. By Deployment Mode
        13.2.4. By End Use
    13.3. Market Attractiveness Analysis
        13.3.1. By Country
        13.3.2. By Product Type
        13.3.3. By Deployment Mode
        13.3.4. By End Use
    13.4. Key Takeaways
14. Oceania Market Analysis 2015 to 2021 and Forecast 2022 to 2032, By Country
    14.1. Historical Market Size Value (US$ million) Trend Analysis By Market Taxonomy, 2015 to 2021
    14.2. Market Size Value (US$ million) Forecast By Market Taxonomy, 2022 to 2032
        14.2.1. By Country
            14.2.1.1. Australia
            14.2.1.2. New Zealand
        14.2.2. By Product Type
        14.2.3. By Deployment Mode
        14.2.4. By End Use
    14.3. Market Attractiveness Analysis
        14.3.1. By Country
        14.3.2. By Product Type
        14.3.3. By Deployment Mode
        14.3.4. By End Use
    14.4. Key Takeaways
15. MEA Market Analysis 2015 to 2021 and Forecast 2022 to 2032, By Country
    15.1. Historical Market Size Value (US$ million) Trend Analysis By Market Taxonomy, 2015 to 2021
    15.2. Market Size Value (US$ million) Forecast By Market Taxonomy, 2022 to 2032
        15.2.1. By Country
            15.2.1.1. GCC
            15.2.1.2. Rest of MEA
        15.2.2. By Product Type
        15.2.3. By Deployment Mode
        15.2.4. By End Use
    15.3. Market Attractiveness Analysis
        15.3.1. By Country
        15.3.2. By Product Type
        15.3.3. By Deployment Mode
        15.3.4. By End Use
    15.4. Key Takeaways
16. Key Countries Market Analysis
    16.1. The USA
        16.1.1. Pricing Analysis
        16.1.2. Market Share Analysis, 2021
            16.1.2.1. By Product Type
            16.1.2.2. By Deployment Mode
            16.1.2.3. By End Use
    16.2. Canada
        16.2.1. Pricing Analysis
        16.2.2. Market Share Analysis, 2021
            16.2.2.1. By Product Type
            16.2.2.2. By Deployment Mode
            16.2.2.3. By End Use
    16.3. Brazil
        16.3.1. Pricing Analysis
        16.3.2. Market Share Analysis, 2021
            16.3.2.1. By Product Type
            16.3.2.2. By Deployment Mode
            16.3.2.3. By End Use
    16.4. Mexico
        16.4.1. Pricing Analysis
        16.4.2. Market Share Analysis, 2021
            16.4.2.1. By Product Type
            16.4.2.2. By Deployment Mode
            16.4.2.3. By End Use
    16.5. Argentina
        16.5.1. Pricing Analysis
        16.5.2. Market Share Analysis, 2021
            16.5.2.1. By Product Type
            16.5.2.2. By Deployment Mode
            16.5.2.3. By End Use
    16.6. Germany
        16.6.1. Pricing Analysis
        16.6.2. Market Share Analysis, 2021
            16.6.2.1. By Product Type
            16.6.2.2. By Deployment Mode
            16.6.2.3. By End Use
    16.7. Italy
        16.7.1. Pricing Analysis
        16.7.2. Market Share Analysis, 2021
            16.7.2.1. By Product Type
            16.7.2.2. By Deployment Mode
            16.7.2.3. By End Use
    16.8. France
        16.8.1. Pricing Analysis
        16.8.2. Market Share Analysis, 2021
            16.8.2.1. By Product Type
            16.8.2.2. By Deployment Mode
            16.8.2.3. By End Use
    16.9. The United Kingdom
        16.9.1. Pricing Analysis
        16.9.2. Market Share Analysis, 2021
            16.9.2.1. By Product Type
            16.9.2.2. By Deployment Mode
            16.9.2.3. By End Use
    16.10. Spain
        16.10.1. Pricing Analysis
        16.10.2. Market Share Analysis, 2021
            16.10.2.1. By Product Type
            16.10.2.2. By Deployment Mode
            16.10.2.3. By End Use
    16.11. Russia
        16.11.1. Pricing Analysis
        16.11.2. Market Share Analysis, 2021
            16.11.2.1. By Product Type
            16.11.2.2. By Deployment Mode
            16.11.2.3. By End Use
    16.12. BENELUX
        16.12.1. Pricing Analysis
        16.12.2. Market Share Analysis, 2021
            16.12.2.1. By Product Type
            16.12.2.2. By Deployment Mode
            16.12.2.3. By End Use
    16.13. China
        16.13.1. Pricing Analysis
        16.13.2. Market Share Analysis, 2021
            16.13.2.1. By Product Type
            16.13.2.2. By Deployment Mode
            16.13.2.3. By End Use
    16.14. Japan
        16.14.1. Pricing Analysis
        16.14.2. Market Share Analysis, 2021
            16.14.2.1. By Product Type
            16.14.2.2. By Deployment Mode
            16.14.2.3. By End Use
    16.15. South Korea
        16.15.1. Pricing Analysis
        16.15.2. Market Share Analysis, 2021
            16.15.2.1. By Product Type
            16.15.2.2. By Deployment Mode
            16.15.2.3. By End Use
    16.16. India
        16.16.1. Pricing Analysis
        16.16.2. Market Share Analysis, 2021
            16.16.2.1. By Product Type
            16.16.2.2. By Deployment Mode
            16.16.2.3. By End Use
    16.17. Thailand
        16.17.1. Pricing Analysis
        16.17.2. Market Share Analysis, 2021
            16.17.2.1. By Product Type
            16.17.2.2. By Deployment Mode
            16.17.2.3. By End Use
    16.18. Malaysia
        16.18.1. Pricing Analysis
        16.18.2. Market Share Analysis, 2021
            16.18.2.1. By Product Type
            16.18.2.2. By Deployment Mode
            16.18.2.3. By End Use
    16.19. Indonesia
        16.19.1. Pricing Analysis
        16.19.2. Market Share Analysis, 2021
            16.19.2.1. By Product Type
            16.19.2.2. By Deployment Mode
            16.19.2.3. By End Use
    16.20. Australia
        16.20.1. Pricing Analysis
        16.20.2. Market Share Analysis, 2021
            16.20.2.1. By Product Type
            16.20.2.2. By Deployment Mode
            16.20.2.3. By End Use
    16.21. New Zealand
        16.21.1. Pricing Analysis
        16.21.2. Market Share Analysis, 2021
            16.21.2.1. By Product Type
            16.21.2.2. By Deployment Mode
            16.21.2.3. By End Use
    16.22. GCC Countries
        16.22.1. Pricing Analysis
        16.22.2. Market Share Analysis, 2021
            16.22.2.1. By Product Type
            16.22.2.2. By Deployment Mode
            16.22.2.3. By End Use
17. Market Structure Analysis
    17.1. Competition Dashboard
    17.2. Competition Benchmarking
    17.3. Market Share Analysis of Top Players
        17.3.1. By Regional
        17.3.2. By Product Type
        17.3.3. By Deployment Mode
        17.3.4. By End Use
18. Competition Analysis
    18.1. Competition Deep Dive
        18.1.1. Certara
            18.1.1.1. Overview
            18.1.1.2. Product Portfolio
            18.1.1.3. Profitability by Market Segments
            18.1.1.4. Sales Footprint
            18.1.1.5. Strategy Overview
                18.1.1.5.1. Marketing Strategy
                18.1.1.5.2. Product Strategy
                18.1.1.5.3. Channel Strategy
        18.1.2. Dassault Systemes
            18.1.2.1. Overview
            18.1.2.2. Product Portfolio
            18.1.2.3. Profitability by Market Segments
            18.1.2.4. Sales Footprint
            18.1.2.5. Strategy Overview
                18.1.2.5.1. Marketing Strategy
                18.1.2.5.2. Product Strategy
                18.1.2.5.3. Channel Strategy
        18.1.3. Advanced Chemistry Development
            18.1.3.1. Overview
            18.1.3.2. Product Portfolio
            18.1.3.3. Profitability by Market Segments
            18.1.3.4. Sales Footprint
            18.1.3.5. Strategy Overview
                18.1.3.5.1. Marketing Strategy
                18.1.3.5.2. Product Strategy
                18.1.3.5.3. Channel Strategy
        18.1.4. Simulation Plus Inc
            18.1.4.1. Overview
            18.1.4.2. Product Portfolio
            18.1.4.3. Profitability by Market Segments
            18.1.4.4. Sales Footprint
            18.1.4.5. Strategy Overview
                18.1.4.5.1. Marketing Strategy
                18.1.4.5.2. Product Strategy
                18.1.4.5.3. Channel Strategy
        18.1.5. Schrodinger, Inc.
            18.1.5.1. Overview
            18.1.5.2. Product Portfolio
            18.1.5.3. Profitability by Market Segments
            18.1.5.4. Sales Footprint
            18.1.5.5. Strategy Overview
                18.1.5.5.1. Marketing Strategy
                18.1.5.5.2. Product Strategy
                18.1.5.5.3. Channel Strategy
        18.1.6. Chemical Computing Group
            18.1.6.1. Overview
            18.1.6.2. Product Portfolio
            18.1.6.3. Profitability by Market Segments
            18.1.6.4. Sales Footprint
            18.1.6.5. Strategy Overview
                18.1.6.5.1. Marketing Strategy
                18.1.6.5.2. Product Strategy
                18.1.6.5.3. Channel Strategy
        18.1.7. Physiomics Plc
            18.1.7.1. Overview
            18.1.7.2. Product Portfolio
            18.1.7.3. Profitability by Market Segments
            18.1.7.4. Sales Footprint
            18.1.7.5. Strategy Overview
                18.1.7.5.1. Marketing Strategy
                18.1.7.5.2. Product Strategy
                18.1.7.5.3. Channel Strategy
        18.1.8. Rosa & Co. LLC
            18.1.8.1. Overview
            18.1.8.2. Product Portfolio
            18.1.8.3. Profitability by Market Segments
            18.1.8.4. Sales Footprint
            18.1.8.5. Strategy Overview
                18.1.8.5.1. Marketing Strategy
                18.1.8.5.2. Product Strategy
                18.1.8.5.3. Channel Strategy
        18.1.9. Consulting Inc.
            18.1.9.1. Overview
            18.1.9.2. Product Portfolio
            18.1.9.3. Profitability by Market Segments
            18.1.9.4. Sales Footprint
            18.1.9.5. Strategy Overview
                18.1.9.5.1. Marketing Strategy
                18.1.9.5.2. Product Strategy
                18.1.9.5.3. Channel Strategy
        18.1.10. Genedata AG
            18.1.10.1. Overview
            18.1.10.2. Product Portfolio
            18.1.10.3. Profitability by Market Segments
            18.1.10.4. Sales Footprint
            18.1.10.5. Strategy Overview
                18.1.10.5.1. Marketing Strategy
                18.1.10.5.2. Product Strategy
                18.1.10.5.3. Channel Strategy
        18.1.11. Instem Group of Companies
            18.1.11.1. Overview
            18.1.11.2. Product Portfolio
            18.1.11.3. Profitability by Market Segments
            18.1.11.4. Sales Footprint
            18.1.11.5. Strategy Overview
                18.1.11.5.1. Marketing Strategy
                18.1.11.5.2. Product Strategy
                18.1.11.5.3. Channel Strategy
        18.1.12. PPD, Inc.
            18.1.12.1. Overview
            18.1.12.2. Product Portfolio
            18.1.12.3. Profitability by Market Segments
            18.1.12.4. Sales Footprint
            18.1.12.5. Strategy Overview
                18.1.12.5.1. Marketing Strategy
                18.1.12.5.2. Product Strategy
                18.1.12.5.3. Channel Strategy
        18.1.13. Insilico Biotechnology AG
            18.1.13.1. Overview
            18.1.13.2. Product Portfolio
            18.1.13.3. Profitability by Market Segments
            18.1.13.4. Sales Footprint
            18.1.13.5. Strategy Overview
                18.1.13.5.1. Marketing Strategy
                18.1.13.5.2. Product Strategy
                18.1.13.5.3. Channel Strategy
        18.1.14. Rhenovia Pharma
            18.1.14.1. Overview
            18.1.14.2. Product Portfolio
            18.1.14.3. Profitability by Market Segments
            18.1.14.4. Sales Footprint
            18.1.14.5. Strategy Overview
                18.1.14.5.1. Marketing Strategy
                18.1.14.5.2. Product Strategy
                18.1.14.5.3. Channel Strategy
        18.1.15. LeadInvent Technologies
            18.1.15.1. Overview
            18.1.15.2. Product Portfolio
            18.1.15.3. Profitability by Market Segments
            18.1.15.4. Sales Footprint
            18.1.15.5. Strategy Overview
                18.1.15.5.1. Marketing Strategy
                18.1.15.5.2. Product Strategy
                18.1.15.5.3. Channel Strategy
        18.1.16. Nuventra Pharma
            18.1.16.1. Overview
            18.1.16.2. Product Portfolio
            18.1.16.3. Profitability by Market Segments
            18.1.16.4. Sales Footprint
            18.1.16.5. Strategy Overview
                18.1.16.5.1. Marketing Strategy
                18.1.16.5.2. Product Strategy
                18.1.16.5.3. Channel Strategy
        18.1.17. In Silico Biosciences
            18.1.17.1. Overview
            18.1.17.2. Product Portfolio
            18.1.17.3. Profitability by Market Segments
            18.1.17.4. Sales Footprint
            18.1.17.5. Strategy Overview
                18.1.17.5.1. Marketing Strategy
                18.1.17.5.2. Product Strategy
                18.1.17.5.3. Channel Strategy
19. Assumptions & Acronyms Used
20. Research Methodology
Recommendations

Chemicals & Materials

Bio-plastic Market

October 2023

REP-GB--69

95 pages

Chemicals & Materials

Biobased Biodegradable Plastic Market

October 2023

REP-GB--89

90 pages

Chemicals & Materials

Biophotonics Market

March 2023

REP-GB-92

342 pages

Chemicals & Materials

Asia Pacific Bio Composites Market

September 2022

REP-AP-77

250 pages

Explore Healthcare Insights

View Reports
Future Market Insights

Biosimulation Market

Schedule a Call