Reports

- Global Locations -

Headquarters

Future Market Insights, Inc.

Christiana Corporate, 200
Continental Drive, Suite 401,
Newark, Delaware - 19713,
United States

T: +1-845-579-5705

Americas

Future Market Insights, Inc.

616 Corporate Way, Suite 2-9018,
Valley Cottage, NY 10989, United States

T: +1-347-918-3531

MEA

Future Market Insights

1602-6 Jumeirah Bay X2 Tower, Plot No: JLT-PH2-X2A,
Jumeirah Lakes Towers, Dubai,
United Arab Emirates

Europe

Future Market Insights

3rd Floor, 207 Regent Street,
W1B 3HH London
United Kingdom

T: + 44 (0) 20 8123 9659
D: +44 (0) 20 3287 4268

Asia Pacific

Future Market Insights

IndiaLand Global Tech Park, Unit UG-1, Behind Grand HighStreet, Phase 1, Hinjawadi, MH, Pune – 411057, India

Brachytherapy Market Overview (2022 to 2032)

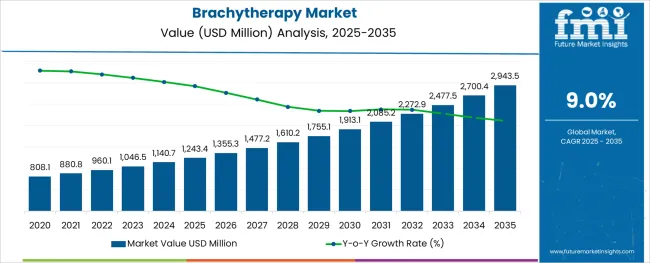
Newly-released Brachytherapy Market analysis report by Future Market Insights shows that global sales of the Brachytherapy Market in 2021 were held at US$ 892.9 million. With a CAGR of 8.3% from 2022 to 2032, the market is projected to reach a valuation of US$ 2.1 Bn by 2032. Applicators and Afterloaders are expected to be the highest revenue-generating segment, projected to grow at a CAGR of over 8.6% from 2022 to 2032.

Attribute Details
Global Brachytherapy Market (2022) US$ 960.1 million
Global Brachytherapy Market (2032) US$ 2.1 billion
Global Brachytherapy Market CAGR (2022 to 2032) 8.3%
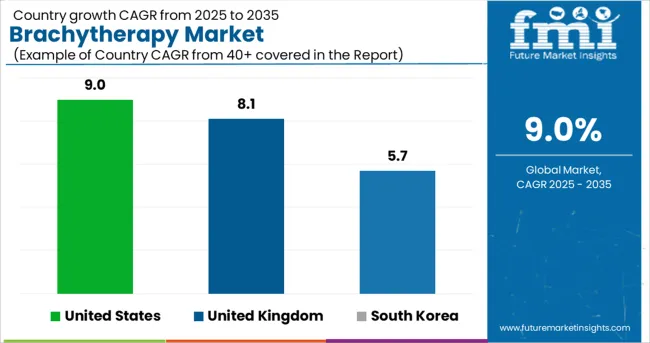
USA Brachytherapy Market CAGR (2022 to 2032) 9%
Key Companies Profiled
  • Eckert and Ziegler Group
  • Isoray Inc.
  • Elekta AB
  • Theragenics Corp.
  • Becton, Dickinson, and Co.
  • Varian Medical Systems Inc.
  • iCAD Inc.
  • CIVCO Medical Solutions
  • Sun Nuclear Corp.
  • Huiheng Medical Inc.
  • AngioDynamics Inc.
  • Hologic, Inc.

Don't pay for what you don't need

Customize your report by selecting specific countries or regions and save 30%!

Revenue of Brachytherapy Market from 2017 to 2021 Compared to Demand Outlook for 2022 to 2032

As per the Brachytherapy Market research by Future Market Insights - a market research and competitive intelligence provider, historically, from 2017 to 2021, the market value of Brachytherapy increased at around 7.2% CAGR.

During the projected period, the market is likely to develop due to rising cancer incidences, and technical improvements in brachytherapy. The variety of imaging techniques available, many of which can be utilized in real-time, has substantially extended the brachytherapy options. Ultrasound, Power Doppler imaging, positron emission tomography, and magnetic resonance imaging techniques are some of the techniques of brachytherapy.

As per the American Cancer Society, the number of new cancer cases globally is anticipated to reach 21.6 million by 2030, with more than 13 million cancer fatalities. According to the reports presented by WHO, cancer claimed the lives of around 10 million people in 2020. Breast cancer is also one of the most frequent cancers, with an estimated 2.26 million new cases in 2020.

Radiation treatment can be used to treat cancer in three ways: preventive, palliative, and curative. It can also be used on its own or in combination with other therapies including surgery, immunotherapy, and chemotherapy. Radiation's wide range of applications has raised its appeal among doctors. The most recent breakthroughs in radiation treatment enable a high dosage to be delivered to the target location while causing minimal harm to neighboring healthy tissues. This has increased the possibility of localized tumor management and improved cure rates, leading to an increase in the demand for radiation treatment.

Which Factors are Propelling Brachytherapy Demand?

Advances in the healthcare IT industry, expanding healthcare infrastructure, increased public-private partnerships, investments in cancer treatment, and rising demand for advanced care solutions are driving the market expansion.

Radiation treatment is constantly changing and advancing owing to the advancement of groundbreaking technologies. People are being educated about cancer and its treatments through new initiatives and awareness activities. For example, on 7 April 2022, also regarded as World Health Day, as per the strategy of WHO, the International Agency for cancer and research. Alongside, the Union for International Cancer Control and African Cancer Registry Network launched a publication to commemorate the occasion. The report presents the effort dedicated to the annihilation of cervical cancer in African countries.

Sabyasachi Ghosh
Sabyasachi Ghosh

Principal Consultant

Talk to Analyst

Find your sweet spots for generating winning opportunities in this market.

Which Region is projected to Offer the Largest Opportunity for Brachytherapy Market?

In 2021, North America held the largest share of the global Brachytherapy Market. It accounted for over 35% of the global revenue derived from Brachytherapy. The surge is being fuelled by rising cancer rates combined with an aging population. Some of the key factors for regional market expansion are government support for the healthcare sector's development, a high level of cancer awareness, easy access to high-quality medical facilities, and advantageous reimbursement policies.

The growing number of cancer-care product advancements is assisting in the reduction of cancer-related mortality in North America. For example, as per the report published by the American Cancer Society, to overcome treatment resistance in cancers, researchers used a DNA origami/trojan approach. Also, techniques like self-eradication of cancer during meiosis or electro-permeabilizing the cancer cell membrane are also developed in America.
Country-wise Analysis

The USA Brachytherapy Market Analysis

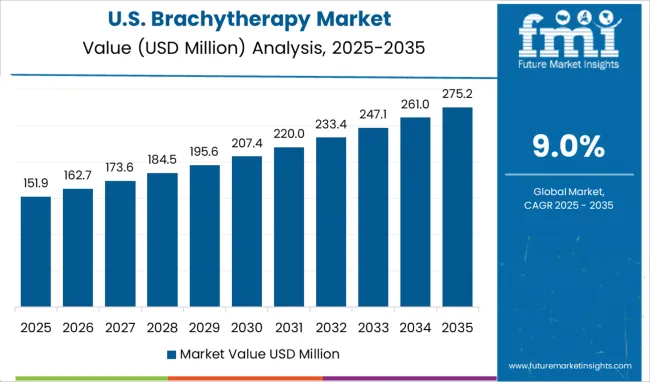
The United States is expected to account for the highest market of US$ 850.1 million by 2032. The market in the country is expected to register an absolute dollar opportunity of US$ 486 million and a projected CAGR of 9%. Due to many variables such as Research and Development (R&D) spending, high healthcare expenditures, the existence of significant companies, and the growing number of cancer patients, the United States is the largest market for brachytherapy.

AngioDynamics, Inc., Hologic, Inc., Isoray, Inc., and Sun Nuclear Corp. are among the leading companies operating in the USA brachytherapy market. To stay competitive in the market, players are using different strategies such as mergers and acquisitions, and collaborations to significantly contribute to market growth.

The United Kingdom Brachytherapy Market Analysis

The brachytherapy market in the United Kingdom is projected to reach a valuation of US$ 83 million by 2032. Growing at a CAGR of 8.1%, the market in the country is expected to gross an absolute dollar opportunity of around US$ 45 million from 2022 to 2032.

Japan Brachytherapy Market Analysis

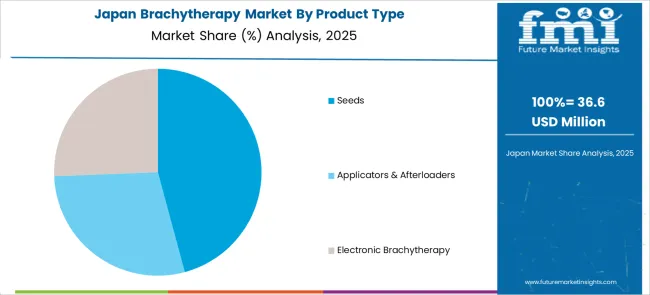
In Japan, the market for brachytherapy is projected to garner US$ 71.4 million by 2032. During the forecast period, the market is expected to garner an absolute dollar opportunity of US$ 37 million, registering an absolute dollar opportunity of US$ 37 million.

South Korea Brachytherapy Market Analysis

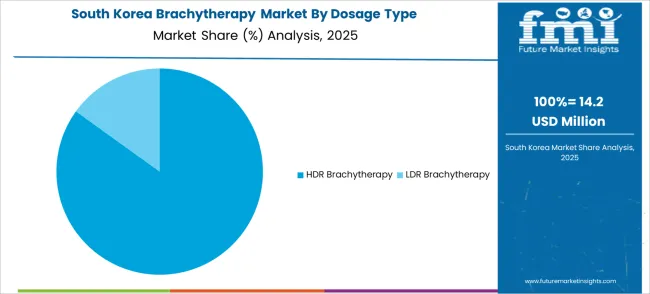
The market in South Korea is expected to reach US$ 31 million by 2032 growing at a CAGR of 5.7% during the forecast period. From 2022 to 2032, the market is expected to register an absolute dollar opportunity of US$ 13.3 million.

Get the data you need at a Fraction of the cost

Personalize your report by choosing insights you need
and save 40%!

Category-wise Insights

Why are Applicators and Afterloaders projected to offer Significant Opportunities for Brachytherapy Market?

The market revenue through Applicators and Afterloaders is expected to grow at a CAGR of 8.6% during the projection period. Because they are more efficient and are utilized for patient guidance across the cancer care continuum, this therapy plays a crucial role in cancer treatment. Increased investment in cancer research and development also contributes to rising demand for the therapy.

Why Market revenue through Breast Cancer is Expected to Swell Significantly?

The market revenue through the Breast Cancer application is forecasted to grow at the highest CAGR from 2022 to 2032. This is mostly due to the rising incidence of breast cancer globally. Breast cancer has affected 2.5 million people worldwide in 2020, with 690,000 fatalities. Breast cancer has affected almost 8 million women during the period between 2016 to 20, making it the most common disease in the world.

The most frequent type of brachytherapy for breast cancer patients is intracavitary brachytherapy. In this method, a radioactive substance-containing device is implanted into the body and remains there until the therapy is finished. Furthermore, increased government initiatives to raise awareness and technical breakthroughs in minimally invasive surgical treatments contribute to the market's growth.

Which Dosage Type of Brachytherapy is expected to Score the Highest Growth in the Coming Years?

HDR (High-Dose Rate) Brachytherapy commanded the largest revenue as well as a CAGR of nearly 8.3%, during the forecast period. The reason pertains to the advantages it provides to cancer patients. HDR brachytherapy is a type of radiation therapy in which a large dose of radiation is delivered directly to the prostate. This implies that neighboring healthy tissue receives a low dosage of radiation and is less likely to be harmed or produce negative effects.

HDR brachytherapy can be used to treat a wide range of illnesses, including delivering accurate radiation to cancerous tumors while preventing radiation damage to surrounding tissue, instead of the five to seven weeks that regular radiation usually takes.
Competitive Analysis

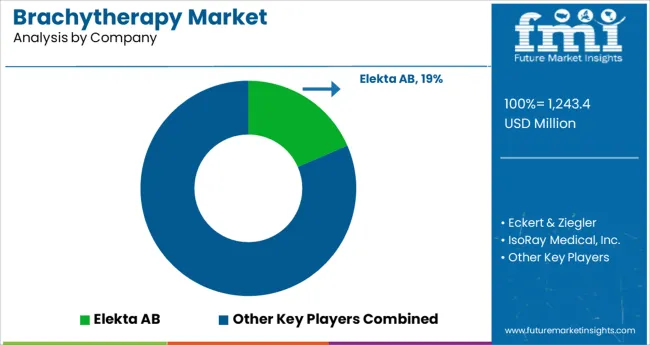
Some of the key players in the brachytherapy market include Eckert and Ziegler Group, Isoray Inc., Elekta AB, Theragenics Corp., Becton, Dickinson and Co., Varian Medical Systems Inc., iCAD Inc., CIVCO Medical Solutions, Sun Nuclear Corp., Huiheng Medical Inc., AngioDynamics Inc., and Hologic, Inc.

Some of the recent developments of key Brachytherapy providers are as follows:

  • In April 2022, iCAD highlights additional patients treated in the GLIOX trial and continued global momentum for Xoft System’s intraoperative radiation therapy for the treatment of brain, rectal, head, and neck tumors.
  • In October 2021, Blue Wolf Capital Partners LLC, a New York-based private equity company, announced that it has reached a deal with Roper Technologies, Inc. to buy CIVCO Radiation, a provider of radiotherapy patient placement and immobilization technology.
  • In December 2021, Allegheny Health Network, a Highmark Health Company, has chosen Sun Nuclear as their radiation treatment Quality Assurance solutions partner.
  • In November 2020, Vivos Inc stated that it has submitted its application for Breakthrough Device Designation for Radiogel to the FDA. The business has successfully developed supplies for brachytherapy, which facilitates the treatment of tumors in mice and humans, based on Ytrium-90.
  • In August 2020, Elekta announced that the Geneva brachytherapy applicator it created has obtained FDA approval in the United States, indicating that it would now permit cancer patients to use the applicator in the United States to access its precise treatment capabilities.

Similarly, recent developments related to companies in the Brachytherapy market have been tracked by the team at Future Market Insights, which are available in the full report.

Market Segments Covered in Brachytherapy Market Analysis

By Product Type:

  • Seeds
  • Applicators and Afterloaders
  • Electronic Brachytherapy

By Dosage Type:

  • HDR Brachytherapy
  • LDR Brachytherapy

By Application:

  • Prostate Cancer
  • Gynaecological Cancer
  • Breast Cancer
  • Other Applications

By Region:

  • North America
  • Latin America
  • Europe
  • APAC
  • Middle East and Africa (MEA)

Frequently Asked Questions

How much is the current worth of the Brachytherapy Market?

The global Brachytherapy Market is worth more than US$ 892.9 million at present.

What is the sales forecast for Brachytherapy Market?

The value of the Brachytherapy Market is projected to increase at a CAGR of around 8.3% from 2022 to 2032.

What was the last 5 year’s market CAGR?

The value of the Brachytherapy Market increased at a CAGR of around 7.2% from 2017 to 2021.

What is a key trend shaping the growth of the market for Brachytherapy Market?

Advanced solutions designed for specific requirements of cancer care facilities delivering financial, clinical, operational, and administrative services are bolstering the growth of the Brachytherapy Market.

At what percentage is sales of the Brachytherapy Market going to register growth in China?

Brachytherapy Market in China is projected to expand at a CAGR of around 9.9% from 2022 to 2032.

What do statistics for South Korea and Japan reveal?

While the market in South Korea is expected to grow at nearly 5.7%, the market in Japan is projected to register a CAGR of nearly 7.4% from 2022 to 2032.

Table of Content

1. Executive Summary | Brachytherapy Market

    1.1. Global Market Outlook

    1.2. Demand-side Trends

    1.3. Supply-side Trends

    1.4. Technology Roadmap Analysis

    1.5. Analysis and Recommendations

2. Market Overview

    2.1. Market Coverage / Taxonomy

    2.2. Market Definition / Scope / Limitations

3. Market Background

    3.1. Market Dynamics

        3.1.1. Drivers

        3.1.2. Restraints

        3.1.3. Opportunity

        3.1.4. Trends

    3.2. Scenario Forecast

        3.2.1. Demand in Optimistic Scenario

        3.2.2. Demand in Likely Scenario

        3.2.3. Demand in Conservative Scenario

    3.3. Opportunity Map Analysis

    3.4. Product Life Cycle Analysis

    3.5. Investment Feasibility Matrix

    3.6. PESTLE and Porter’s Analysis

    3.7. Regulatory Landscape 3.9.1. By Key Regions 3.9.2. By Key Countries

    3.8. Regional Parent Market Outlook

4. Global Market Analysis 2017-2021 and Forecast, 2022-2032

    4.1. Historical Market Size Value (US$ million) Analysis, 2017-2021

    4.2. Current and Future Market Size Value (US$ million) Projections, 2022-2032

        4.2.1. Y-o-Y Growth Trend Analysis

        4.2.2. Absolute $ Opportunity Analysis

5. Global Market Analysis 2017-2021 and Forecast 2022-2032, By Product Type

    5.1. Introduction / Key Findings

    5.2. Historical Market Size Value (US$ million) Analysis By Product Type, 2017-2021

    5.3. Current and Future Market Size Value (US$ million) Analysis and Forecast By Product Type, 2022-2032

        5.3.1. Seeds

        5.3.2. Applicators & Afterloaders

        5.3.3. Electronic Brachytherapy

    5.4. Y-o-Y Growth Trend Analysis By Product Type, 2017-2021

    5.5. Absolute $ Opportunity Analysis By Product Type, 2022-2032

6. Global Market Analysis 2017-2021 and Forecast 2022-2032, By Dosage Type

    6.1. Introduction / Key Findings

    6.2. Historical Market Size Value (US$ million) Analysis By Dosage Type, 2017-2021

    6.3. Current and Future Market Size Value (US$ million) Analysis and Forecast By Dosage Type, 2022-2032

        6.3.1. HDR Brachytherapy

        6.3.2. LDR Brachytherapy

    6.4. Y-o-Y Growth Trend Analysis By Dosage Type, 2017-2021

    6.5. Absolute $ Opportunity Analysis By Dosage Type, 2022-2032

7. Global Market Analysis 2017-2021 and Forecast 2022-2032, By Application

    7.1. Introduction / Key Findings

    7.2. Historical Market Size Value (US$ million) Analysis By Application, 2017-2021

    7.3. Current and Future Market Size Value (US$ million) Analysis and Forecast By Application, 2022-2032

        7.3.1. Prostate Cancer

        7.3.2. Gynecological Cancer

        7.3.3. Breast Cancer

        7.3.4. Other Applications

    7.4. Y-o-Y Growth Trend Analysis By Application, 2017-2021

    7.5. Absolute $ Opportunity Analysis By Application, 2022-2032

8. Global Market Analysis 2017-2021 and Forecast 2022-2032, By Region

    8.1. Introduction

    8.2. Historical Market Size Value (US$ million) Analysis By Region, 2017-2021

    8.3. Current Market Size Value (US$ million) Analysis and Forecast By Region, 2022-2032

        8.3.1. North America

        8.3.2. Latin America

        8.3.3. Europe

        8.3.4. Asia Pacific

        8.3.5. Middle East and Africa

    8.4. Market Attractiveness Analysis By Region

9. North America Market Analysis 2017-2021 and Forecast 2022-2032, By Country

    9.1. Historical Market Size Value (US$ million) Trend Analysis By Market Taxonomy, 2017-2021

    9.2. Market Size Value (US$ million) Forecast By Market Taxonomy, 2022-2032

        9.2.1. By Country

            9.2.1.1. the USA

            9.2.1.2. Canada

        9.2.2. By Product Type

        9.2.3. By Dosage Type

        9.2.4. By Application

    9.3. Market Attractiveness Analysis

        9.3.1. By Country

        9.3.2. By Product Type

        9.3.3. By Dosage Type

        9.3.4. By Application

    9.4. Key Takeaways

10. Latin America Market Analysis 2017-2021 and Forecast 2022-2032, By Country

    10.1. Historical Market Size Value (US$ million) Trend Analysis By Market Taxonomy, 2017-2021

    10.2. Market Size Value (US$ million) Forecast By Market Taxonomy, 2022-2032

        10.2.1. By Country

            10.2.1.1. Brazil

            10.2.1.2. Mexico

            10.2.1.3. Rest of Latin America

        10.2.2. By Product Type

        10.2.3. By Dosage Type

        10.2.4. By Application

    10.3. Market Attractiveness Analysis

        10.3.1. By Country

        10.3.2. By Product Type

        10.3.3. By Dosage Type

        10.3.4. By Application

    10.4. Key Takeaways

11. Europe Market Analysis 2017-2021 and Forecast 2022-2032, By Country

    11.1. Historical Market Size Value (US$ million) Trend Analysis By Market Taxonomy, 2017-2021

    11.2. Market Size Value (US$ million) Forecast By Market Taxonomy, 2022-2032

        11.2.1. By Country

            11.2.1.1. Germany

            11.2.1.2. The United Kingdom

            11.2.1.3. France

            11.2.1.4. Spain

            11.2.1.5. Italy

            11.2.1.6. Russia

            11.2.1.7. Rest of Europe

        11.2.2. By Product Type

        11.2.3. By Dosage Type

        11.2.4. By Application

    11.3. Market Attractiveness Analysis

        11.3.1. By Country

        11.3.2. By Product Type

        11.3.3. By Dosage Type

        11.3.4. By Application

    11.4. Key Takeaways

12. Asia Pacific Market Analysis 2017-2021 and Forecast 2022-2032, By Country

    12.1. Historical Market Size Value (US$ million) Trend Analysis By Market Taxonomy, 2017-2021

    12.2. Market Size Value (US$ million) Forecast By Market Taxonomy, 2022-2032

        12.2.1. By Country

            12.2.1.1. China

            12.2.1.2. Japan

            12.2.1.3. India

            12.2.1.4. South Korea

            12.2.1.5. Australia

            12.2.1.6. Rest of APAC

        12.2.2. By Product Type

        12.2.3. By Dosage Type

        12.2.4. By Application

    12.3. Market Attractiveness Analysis

        12.3.1. By Country

        12.3.2. By Product Type

        12.3.3. By Dosage Type

        12.3.4. By Application

    12.4. Key Takeaways

13. Middle East and Africa Market Analysis 2017-2021 and Forecast 2022-2032, By Country

    13.1. Historical Market Size Value (US$ million) Trend Analysis By Market Taxonomy, 2017-2021

    13.2. Market Size Value (US$ million) Forecast By Market Taxonomy, 2022-2032

        13.2.1. By Country

            13.2.1.1. South Africa

            13.2.1.2. Saudi Arabia

            13.2.1.3. UAE

            13.2.1.4. Israel

            13.2.1.5. Rest of MEA

        13.2.2. By Product Type

        13.2.3. By Dosage Type

        13.2.4. By Application

    13.3. Market Attractiveness Analysis

        13.3.1. By Country

        13.3.2. By Product Type

        13.3.3. By Dosage Type

        13.3.4. By Application

    13.4. Key Takeaways

14. Key Countries Market Analysis

    14.1. The USA

        14.1.1. Pricing Analysis

        14.1.2. Market Share Analysis, 2021

            14.1.2.1. By Product Type

            14.1.2.2. By Dosage Type

            14.1.2.3. By Application

    14.2. Canada

        14.2.1. Pricing Analysis

        14.2.2. Market Share Analysis, 2021

            14.2.2.1. By Product Type

            14.2.2.2. By Dosage Type

            14.2.2.3. By Application

    14.3. Brazil

        14.3.1. Pricing Analysis

        14.3.2. Market Share Analysis, 2021

            14.3.2.1. By Product Type

            14.3.2.2. By Dosage Type

            14.3.2.3. By Application

    14.4. Mexico

        14.4.1. Pricing Analysis

        14.4.2. Market Share Analysis, 2021

            14.4.2.1. By Product Type

            14.4.2.2. By Dosage Type

            14.4.2.3. By Application

    14.5. Germany

        14.5.1. Pricing Analysis

        14.5.2. Market Share Analysis, 2021

            14.5.2.1. By Product Type

            14.5.2.2. By Dosage Type

            14.5.2.3. By Application

    14.6. The United Kingdom

        14.6.1. Pricing Analysis

        14.6.2. Market Share Analysis, 2021

            14.6.2.1. By Product Type

            14.6.2.2. By Dosage Type

            14.6.2.3. By Application

    14.7. France

        14.7.1. Pricing Analysis

        14.7.2. Market Share Analysis, 2021

            14.7.2.1. By Product Type

            14.7.2.2. By Dosage Type

            14.7.2.3. By Application

    14.8. Spain

        14.8.1. Pricing Analysis

        14.8.2. Market Share Analysis, 2021

            14.8.2.1. By Product Type

            14.8.2.2. By Dosage Type

            14.8.2.3. By Application

    14.9. Italy

        14.9.1. Pricing Analysis

        14.9.2. Market Share Analysis, 2021

            14.9.2.1. By Product Type

            14.9.2.2. By Dosage Type

            14.9.2.3. By Application

    14.10. Russia

        14.10.1. Pricing Analysis

        14.10.2. Market Share Analysis, 2021

            14.10.2.1. By Product Type

            14.10.2.2. By Dosage Type

            14.10.2.3. By Application

    14.11. China

        14.11.1. Pricing Analysis

        14.11.2. Market Share Analysis, 2021

            14.11.2.1. By Product Type

            14.11.2.2. By Dosage Type

            14.11.2.3. By Application

    14.12. Japan

        14.12.1. Pricing Analysis

        14.12.2. Market Share Analysis, 2021

            14.12.2.1. By Product Type

            14.12.2.2. By Dosage Type

            14.12.2.3. By Application

    14.13. India

        14.13.1. Pricing Analysis

        14.13.2. Market Share Analysis, 2021

            14.13.2.1. By Product Type

            14.13.2.2. By Dosage Type

            14.13.2.3. By Application

    14.14. South Korea

        14.14.1. Pricing Analysis

        14.14.2. Market Share Analysis, 2021

            14.14.2.1. By Product Type

            14.14.2.2. By Dosage Type

            14.14.2.3. By Application

    14.15. Australia

        14.15.1. Pricing Analysis

        14.15.2. Market Share Analysis, 2021

            14.15.2.1. By Product Type

            14.15.2.2. By Dosage Type

            14.15.2.3. By Application

    14.16. South Africa

        14.16.1. Pricing Analysis

        14.16.2. Market Share Analysis, 2021

            14.16.2.1. By Product Type

            14.16.2.2. By Dosage Type

            14.16.2.3. By Application

    14.17. Saudi Arabia

        14.17.1. Pricing Analysis

        14.17.2. Market Share Analysis, 2021

            14.17.2.1. By Product Type

            14.17.2.2. By Dosage Type

            14.17.2.3. By Application

    14.18. UAE

        14.18.1. Pricing Analysis

        14.18.2. Market Share Analysis, 2021

            14.18.2.1. By Product Type

            14.18.2.2. By Dosage Type

            14.18.2.3. By Application

    14.19. Israel

        14.19.1. Pricing Analysis

        14.19.2. Market Share Analysis, 2021

            14.19.2.1. By Product Type

            14.19.2.2. By Dosage Type

            14.19.2.3. By Application

15. Market Structure Analysis

    15.1. Competition Dashboard

    15.2. Competition Benchmarking

    15.3. Market Share Analysis of Top Players

        15.3.1. By Regional

        15.3.2. By Product Type

        15.3.3. By Dosage Type

        15.3.4. By Application

16. Competition Analysis

    16.1. Competition Deep Dive

        16.1.1. Eckert & Ziegler

            16.1.1.1. Overview

            16.1.1.2. Product Portfolio

            16.1.1.3. Profitability by Market Segments

            16.1.1.4. Sales Footprint

            16.1.1.5. Strategy Overview

                16.1.1.5.1. Marketing Strategy

        16.1.2. IsoRay Medical, Inc. 

            16.1.2.1. Overview

            16.1.2.2. Product Portfolio

            16.1.2.3. Profitability by Market Segments

            16.1.2.4. Sales Footprint

            16.1.2.5. Strategy Overview

                16.1.2.5.1. Marketing Strategy

        16.1.3. Elekta AB

            16.1.3.1. Overview

            16.1.3.2. Product Portfolio

            16.1.3.3. Profitability by Market Segments

            16.1.3.4. Sales Footprint

            16.1.3.5. Strategy Overview

                16.1.3.5.1. Marketing Strategy

        16.1.4. Theragenics Corporation

            16.1.4.1. Overview

            16.1.4.2. Product Portfolio

            16.1.4.3. Profitability by Market Segments

            16.1.4.4. Sales Footprint

            16.1.4.5. Strategy Overview

                16.1.4.5.1. Marketing Strategy

        16.1.5. Becton, Dickinson and Company

            16.1.5.1. Overview

            16.1.5.2. Product Portfolio

            16.1.5.3. Profitability by Market Segments

            16.1.5.4. Sales Footprint

            16.1.5.5. Strategy Overview

                16.1.5.5.1. Marketing Strategy

        16.1.6. CIVCO Medical Solutions

            16.1.6.1. Overview

            16.1.6.2. Product Portfolio

            16.1.6.3. Profitability by Market Segments

            16.1.6.4. Sales Footprint

            16.1.6.5. Strategy Overview

                16.1.6.5.1. Marketing Strategy

        16.1.7. Sun Nuclear Corporation

            16.1.7.1. Overview

            16.1.7.2. Product Portfolio

            16.1.7.3. Profitability by Market Segments

            16.1.7.4. Sales Footprint

            16.1.7.5. Strategy Overview

                16.1.7.5.1. Marketing Strategy

        16.1.8. ICAD, Inc.

            16.1.8.1. Overview

            16.1.8.2. Product Portfolio

            16.1.8.3. Profitability by Market Segments

            16.1.8.4. Sales Footprint

            16.1.8.5. Strategy Overview

                16.1.8.5.1. Marketing Strategy

        16.1.9. Varian Medical Systems, Inc. 

            16.1.9.1. Overview

            16.1.9.2. Product Portfolio

            16.1.9.3. Profitability by Market Segments

            16.1.9.4. Sales Footprint

            16.1.9.5. Strategy Overview

                16.1.9.5.1. Marketing Strategy

17. Assumptions & Acronyms Used

18. Research Methodology

Don't pay for what you don't need

Customize your report by selecting specific countries or regions and save 30%!

List of Tables

Table 1: Global Market Value (US$ million) Forecast by Region, 2017-2032

Table 2: Global Market Value (US$ million) Forecast by Product Type, 2017-2032

Table 3: Global Market Value (US$ million) Forecast by Dosage Type, 2017-2032

Table 4: Global Market Value (US$ million) Forecast by Application, 2017-2032

Table 5: North America Market Value (US$ million) Forecast by Country, 2017-2032

Table 6: North America Market Value (US$ million) Forecast by Product Type, 2017-2032

Table 7: North America Market Value (US$ million) Forecast by Dosage Type, 2017-2032

Table 8: North America Market Value (US$ million) Forecast by Application, 2017-2032

Table 9: Latin America Market Value (US$ million) Forecast by Country, 2017-2032

Table 10: Latin America Market Value (US$ million) Forecast by Product Type, 2017-2032

Table 11: Latin America Market Value (US$ million) Forecast by Dosage Type, 2017-2032

Table 12: Latin America Market Value (US$ million) Forecast by Application, 2017-2032

Table 13: Europe Market Value (US$ million) Forecast by Country, 2017-2032

Table 14: Europe Market Value (US$ million) Forecast by Product Type, 2017-2032

Table 15: Europe Market Value (US$ million) Forecast by Dosage Type, 2017-2032

Table 16: Europe Market Value (US$ million) Forecast by Application, 2017-2032

Table 17: Asia Pacific Market Value (US$ million) Forecast by Country, 2017-2032

Table 18: Asia Pacific Market Value (US$ million) Forecast by Product Type, 2017-2032

Table 19: Asia Pacific Market Value (US$ million) Forecast by Dosage Type, 2017-2032

Table 20: Asia Pacific Market Value (US$ million) Forecast by Application, 2017-2032

Table 21: Middle East and Africa Market Value (US$ million) Forecast by Country, 2017-2032

Table 22: Middle East and Africa Market Value (US$ million) Forecast by Product Type, 2017-2032

Table 23: Middle East and Africa Market Value (US$ million) Forecast by Dosage Type, 2017-2032

Table 24: Middle East and Africa Market Value (US$ million) Forecast by Application, 2017-2032
Sabyasachi Ghosh
Sabyasachi Ghosh

Principal Consultant

Talk to Analyst

Find your sweet spots for generating winning opportunities in this market.

List of Charts

Figure 1: Global Market Value (US$ million) by Product Type, 2022-2032

Figure 2: Global Market Value (US$ million) by Dosage Type, 2022-2032

Figure 3: Global Market Value (US$ million) by Application, 2022-2032

Figure 4: Global Market Value (US$ million) by Region, 2022-2032

Figure 5: Global Market Value (US$ million) Analysis by Region, 2017-2032

Figure 6: Global Market Value Share (%) and BPS Analysis by Region, 2022-2032

Figure 7: Global Market Y-o-Y Growth (%) Projections by Region, 2022-2032

Figure 8: Global Market Value (US$ million) Analysis by Product Type, 2017-2032

Figure 9: Global Market Value Share (%) and BPS Analysis by Product Type, 2022-2032

Figure 10: Global Market Y-o-Y Growth (%) Projections by Product Type, 2022-2032

Figure 11: Global Market Value (US$ million) Analysis by Dosage Type, 2017-2032

Figure 12: Global Market Value Share (%) and BPS Analysis by Dosage Type, 2022-2032

Figure 13: Global Market Y-o-Y Growth (%) Projections by Dosage Type, 2022-2032

Figure 14: Global Market Value (US$ million) Analysis by Application, 2017-2032

Figure 15: Global Market Value Share (%) and BPS Analysis by Application, 2022-2032

Figure 16: Global Market Y-o-Y Growth (%) Projections by Application, 2022-2032

Figure 17: Global Market Attractiveness by Product Type, 2022-2032

Figure 18: Global Market Attractiveness by Dosage Type, 2022-2032

Figure 19: Global Market Attractiveness by Application, 2022-2032

Figure 20: Global Market Attractiveness by Region, 2022-2032

Figure 21: North America Market Value (US$ million) by Product Type, 2022-2032

Figure 22: North America Market Value (US$ million) by Dosage Type, 2022-2032

Figure 23: North America Market Value (US$ million) by Application, 2022-2032

Figure 24: North America Market Value (US$ million) by Country, 2022-2032

Figure 25: North America Market Value (US$ million) Analysis by Country, 2017-2032

Figure 26: North America Market Value Share (%) and BPS Analysis by Country, 2022-2032

Figure 27: North America Market Y-o-Y Growth (%) Projections by Country, 2022-2032

Figure 28: North America Market Value (US$ million) Analysis by Product Type, 2017-2032

Figure 29: North America Market Value Share (%) and BPS Analysis by Product Type, 2022-2032

Figure 30: North America Market Y-o-Y Growth (%) Projections by Product Type, 2022-2032

Figure 31: North America Market Value (US$ million) Analysis by Dosage Type, 2017-2032

Figure 32: North America Market Value Share (%) and BPS Analysis by Dosage Type, 2022-2032

Figure 33: North America Market Y-o-Y Growth (%) Projections by Dosage Type, 2022-2032

Figure 34: North America Market Value (US$ million) Analysis by Application, 2017-2032

Figure 35: North America Market Value Share (%) and BPS Analysis by Application, 2022-2032

Figure 36: North America Market Y-o-Y Growth (%) Projections by Application, 2022-2032

Figure 37: North America Market Attractiveness by Product Type, 2022-2032

Figure 38: North America Market Attractiveness by Dosage Type, 2022-2032

Figure 39: North America Market Attractiveness by Application, 2022-2032

Figure 40: North America Market Attractiveness by Country, 2022-2032

Figure 41: Latin America Market Value (US$ million) by Product Type, 2022-2032

Figure 42: Latin America Market Value (US$ million) by Dosage Type, 2022-2032

Figure 43: Latin America Market Value (US$ million) by Application, 2022-2032

Figure 44: Latin America Market Value (US$ million) by Country, 2022-2032

Figure 45: Latin America Market Value (US$ million) Analysis by Country, 2017-2032

Figure 46: Latin America Market Value Share (%) and BPS Analysis by Country, 2022-2032

Figure 47: Latin America Market Y-o-Y Growth (%) Projections by Country, 2022-2032

Figure 48: Latin America Market Value (US$ million) Analysis by Product Type, 2017-2032

Figure 49: Latin America Market Value Share (%) and BPS Analysis by Product Type, 2022-2032

Figure 50: Latin America Market Y-o-Y Growth (%) Projections by Product Type, 2022-2032

Figure 51: Latin America Market Value (US$ million) Analysis by Dosage Type, 2017-2032

Figure 52: Latin America Market Value Share (%) and BPS Analysis by Dosage Type, 2022-2032

Figure 53: Latin America Market Y-o-Y Growth (%) Projections by Dosage Type, 2022-2032

Figure 54: Latin America Market Value (US$ million) Analysis by Application, 2017-2032

Figure 55: Latin America Market Value Share (%) and BPS Analysis by Application, 2022-2032

Figure 56: Latin America Market Y-o-Y Growth (%) Projections by Application, 2022-2032

Figure 57: Latin America Market Attractiveness by Product Type, 2022-2032

Figure 58: Latin America Market Attractiveness by Dosage Type, 2022-2032

Figure 59: Latin America Market Attractiveness by Application, 2022-2032

Figure 60: Latin America Market Attractiveness by Country, 2022-2032

Figure 61: Europe Market Value (US$ million) by Product Type, 2022-2032

Figure 62: Europe Market Value (US$ million) by Dosage Type, 2022-2032

Figure 63: Europe Market Value (US$ million) by Application, 2022-2032

Figure 64: Europe Market Value (US$ million) by Country, 2022-2032

Figure 65: Europe Market Value (US$ million) Analysis by Country, 2017-2032

Figure 66: Europe Market Value Share (%) and BPS Analysis by Country, 2022-2032

Figure 67: Europe Market Y-o-Y Growth (%) Projections by Country, 2022-2032

Figure 68: Europe Market Value (US$ million) Analysis by Product Type, 2017-2032

Figure 69: Europe Market Value Share (%) and BPS Analysis by Product Type, 2022-2032

Figure 70: Europe Market Y-o-Y Growth (%) Projections by Product Type, 2022-2032

Figure 71: Europe Market Value (US$ million) Analysis by Dosage Type, 2017-2032

Figure 72: Europe Market Value Share (%) and BPS Analysis by Dosage Type, 2022-2032

Figure 73: Europe Market Y-o-Y Growth (%) Projections by Dosage Type, 2022-2032

Figure 74: Europe Market Value (US$ million) Analysis by Application, 2017-2032

Figure 75: Europe Market Value Share (%) and BPS Analysis by Application, 2022-2032

Figure 76: Europe Market Y-o-Y Growth (%) Projections by Application, 2022-2032

Figure 77: Europe Market Attractiveness by Product Type, 2022-2032

Figure 78: Europe Market Attractiveness by Dosage Type, 2022-2032

Figure 79: Europe Market Attractiveness by Application, 2022-2032

Figure 80: Europe Market Attractiveness by Country, 2022-2032

Figure 81: Asia Pacific Market Value (US$ million) by Product Type, 2022-2032

Figure 82: Asia Pacific Market Value (US$ million) by Dosage Type, 2022-2032

Figure 83: Asia Pacific Market Value (US$ million) by Application, 2022-2032

Figure 84: Asia Pacific Market Value (US$ million) by Country, 2022-2032

Figure 85: Asia Pacific Market Value (US$ million) Analysis by Country, 2017-2032

Figure 86: Asia Pacific Market Value Share (%) and BPS Analysis by Country, 2022-2032

Figure 87: Asia Pacific Market Y-o-Y Growth (%) Projections by Country, 2022-2032

Figure 88: Asia Pacific Market Value (US$ million) Analysis by Product Type, 2017-2032

Figure 89: Asia Pacific Market Value Share (%) and BPS Analysis by Product Type, 2022-2032

Figure 90: Asia Pacific Market Y-o-Y Growth (%) Projections by Product Type, 2022-2032

Figure 91: Asia Pacific Market Value (US$ million) Analysis by Dosage Type, 2017-2032

Figure 92: Asia Pacific Market Value Share (%) and BPS Analysis by Dosage Type, 2022-2032

Figure 93: Asia Pacific Market Y-o-Y Growth (%) Projections by Dosage Type, 2022-2032

Figure 94: Asia Pacific Market Value (US$ million) Analysis by Application, 2017-2032

Figure 95: Asia Pacific Market Value Share (%) and BPS Analysis by Application, 2022-2032

Figure 96: Asia Pacific Market Y-o-Y Growth (%) Projections by Application, 2022-2032

Figure 97: Asia Pacific Market Attractiveness by Product Type, 2022-2032

Figure 98: Asia Pacific Market Attractiveness by Dosage Type, 2022-2032

Figure 99: Asia Pacific Market Attractiveness by Application, 2022-2032

Figure 100: Asia Pacific Market Attractiveness by Country, 2022-2032

Figure 101: Middle East and Africa Market Value (US$ million) by Product Type, 2022-2032

Figure 102: Middle East and Africa Market Value (US$ million) by Dosage Type, 2022-2032

Figure 103: Middle East and Africa Market Value (US$ million) by Application, 2022-2032

Figure 104: Middle East and Africa Market Value (US$ million) by Country, 2022-2032

Figure 105: Middle East and Africa Market Value (US$ million) Analysis by Country, 2017-2032

Figure 106: Middle East and Africa Market Value Share (%) and BPS Analysis by Country, 2022-2032

Figure 107: Middle East and Africa Market Y-o-Y Growth (%) Projections by Country, 2022-2032

Figure 108: Middle East and Africa Market Value (US$ million) Analysis by Product Type, 2017-2032

Figure 109: Middle East and Africa Market Value Share (%) and BPS Analysis by Product Type, 2022-2032

Figure 110: Middle East and Africa Market Y-o-Y Growth (%) Projections by Product Type, 2022-2032

Figure 111: Middle East and Africa Market Value (US$ million) Analysis by Dosage Type, 2017-2032

Figure 112: Middle East and Africa Market Value Share (%) and BPS Analysis by Dosage Type, 2022-2032

Figure 113: Middle East and Africa Market Y-o-Y Growth (%) Projections by Dosage Type, 2022-2032

Figure 114: Middle East and Africa Market Value (US$ million) Analysis by Application, 2017-2032

Figure 115: Middle East and Africa Market Value Share (%) and BPS Analysis by Application, 2022-2032

Figure 116: Middle East and Africa Market Y-o-Y Growth (%) Projections by Application, 2022-2032

Figure 117: Middle East and Africa Market Attractiveness by Product Type, 2022-2032

Figure 118: Middle East and Africa Market Attractiveness by Dosage Type, 2022-2032

Figure 119: Middle East and Africa Market Attractiveness by Application, 2022-2032

Figure 120: Middle East and Africa Market Attractiveness by Country, 2022-2032

Explore Healthcare Insights

View Reports