Bullous Keratopathy Market
Explore FMI’s in-depth Coverage on the Bullous Keratopathy Market, offering Key Insights across Major Regions and Segments
Bullous Keratopathy Market by Therapies, Treatment, & Region | Forecast 2023 to 2033
Bullous Keratopathy Market Snapshot (2023 to 2033)
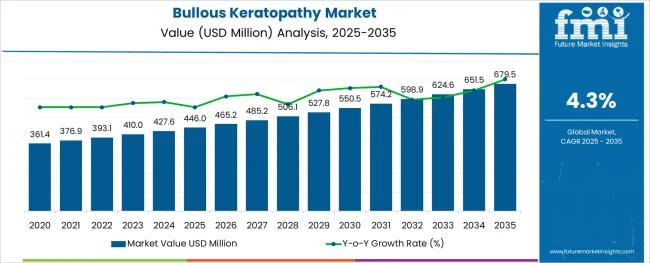
The global bullous keratopathy market was valued at US$ 410 Million in 2022. By 2023, the market is forecast to reach a valuation of US$ 427.54 Million. During the 2023 to 2033 assessment period, a CAGR of 4.3% is anticipated, with an anticipated closing value of US$ 650 Million.
Bullous keratopathies are much less common than they used to be as surgery techniques and implants have enhanced. Complications from cataract surgery used to be the most common cause of bullous keratopathy. Currently, the most common cause of bullous keratopathy is complications due to glaucoma surgery.
Occasionally, bullous keratopathy may be caused by corneal dystrophy. Corneal dystrophies are a group of genetic conditions that result in abnormal material accumulating within the cornea. Rarely, a few other eye conditions or blunt-force trauma to the eye can result in bullous keratopathy.
The ultimate method of curing bullous keratopathy is a corneal transplant. A corneal transplant replaces the affected cornea with a donor. This may include transplant techniques such as a penetrating keratoplasty to replace the entire cornea, a Descemet Stripping Endothelial Keratoplasty (DSEK), Descemet Stripping Automated Endothelial Keratoplasty (DSAEK), or Descemet Membrane Endothelial Keratoplasty (DMEK) to replace the just the Descemet membrane.
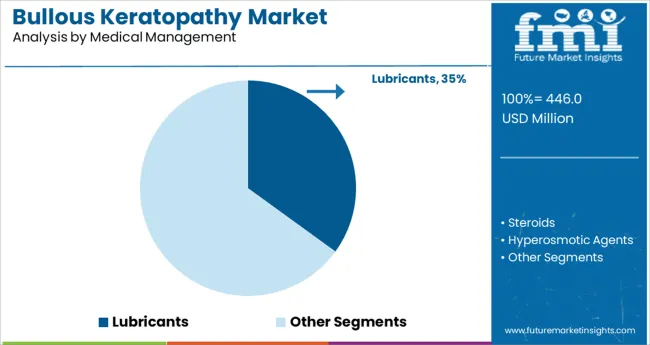
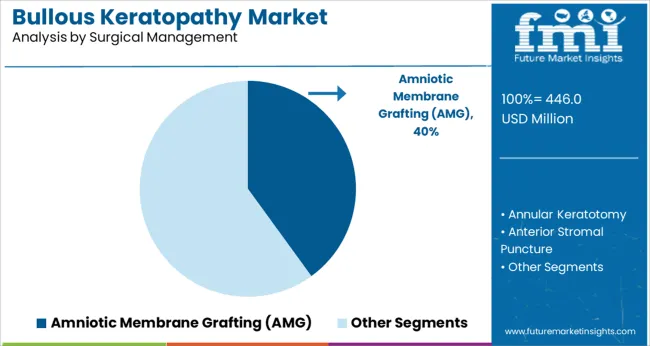
Bullous keratopathy has many treatment options including both medicinal and surgical. Medical management options for bullous keratopathy include lubricants, steroids, hyperosmotic agents in the form of sodium chloride drops and ointment, anti-glaucoma drugs, and antibiotics. Other surgical management options for bullous keratopathy include Amniotic membrane grafting (AMG), annular keratotomy, anterior stromal puncture, and basement membrane polishing, among others.
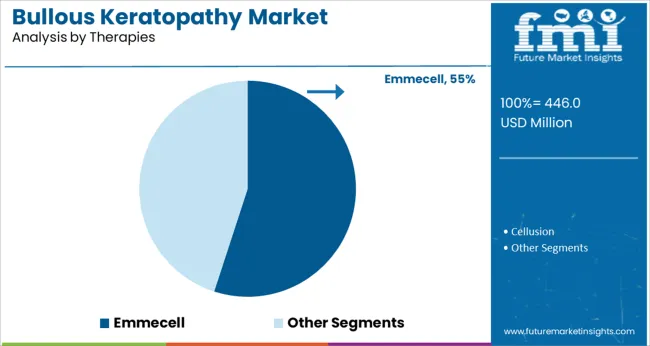
EO2002, a first-in-class, non-surgical, magnetic cell-based therapy with the ability to modify disease, was developed by Emmecell through its exclusive Magnetic Cell Delivery (MCD) nanoparticle platform. It provides easier access to treatment before the disease becomes disabling and painful, and has the potential to prevent or delay the onset of more serious and invasive surgical procedures, including corneal transplantation. EO2002 is being evaluated in Phase I, a prospective, multicenter, open-label, dose-escalation study (EMME-01″) designed to assess the safety and tolerability of EO2002 with and without endothelial brushing (EB) or Descemet stripping (DS) in eyes with corneal edema secondary to corneal endothelial dysfunction that qualifies for surgery involving full-thickness corneal transplantation or endothelial keratoplasty.
Report Attribute |
Details |
Market Value in 2022 |
US$ 410 Million |
Expected Market Value (2023) |
US$ 427.54 Million |
Anticipated Forecast Value (2033) |
US$ 650 Million |
Projected Growth Rate (2023 to 2033) |
CAGR 4.3% |
Don't pay for what you don't need
Customize your report by selecting specific countries or regions and save 30%!
2017 to 2022 Bullous Keratopathy Demand Analysis vs. Forecast 2023 to 2033
The bullous keratopathy market was valued at US$ 410 Million in 2022 and expanded with a CAGR of 4.2% between 2018 and 2022. Rising cases of cataract surgeries and the advent of advanced technologies in corneal transplant and implant surgeries are proving to be game changers in market expansion. Considering these factors, the bullous Keratopathy market is expected to possess a valuation of US$ 650 Million, growing with a CAGR of 4.3%.
Which are Some Prominent Drivers of the Bullous Keratopathy market?
Complications from Cataract Surgeries augmenting Market Growth
Rising complications from cataract surgeries and glaucoma surgeries and the growing prevalence of eye disorders are driving the market of bullous keratopathy. Furthermore, the adoption of surgical management options for bullous keratopathy including Amniotic membrane grafting (AMG), annular keratotomy, anterior stromal puncture, basement membrane polishing, etc. is boosting the growth of this market. Cataract surgery remained the leading cause of endothelial dysfunction/bullous keratopathy (39.9%), followed by combined surgery (23.0%) and FED (11.1%). FED, Fuchs’ endothelial dystrophy.
Find your sweet spots for generating winning opportunities in this market.
Talk to AnalystWhat are the Challenges Projected to be Faced by the Market?
Increased risk factors of the surgery
Most people do well with bullous Keratopathy surgery. But complications can happen. Possible complications are Keratitis, perforation of the eye, extrusion of your ring, eye swelling, movement of your ring, night halos or glare, chronic eye pain, infections, etc. are expected to hamper the growth of the market during the forecast period. Furthermore, the high cost of ophthalmology devices and surgical procedures is anticipated to restrain the growth of this market during the forecast period.
Increase in risk of surgery failure
There is a risk that surgery might not correct the vision as much as expected. It might cause another vision problem like Astigmatism, where the curvature of the cornea becomes irregular. Some people who have corneal ring implantation may need an adjustment surgery to get a better outcome which will restrict the market growth.
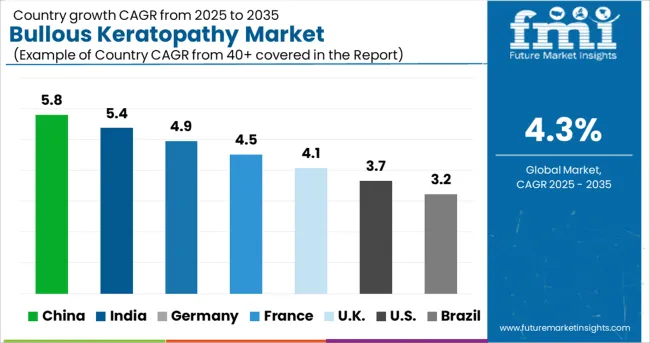
Region-Wise Insights
What are the growth avenues for Bullous Keratopathy in North America?
Favorable Reimbursement policies driving the market
North America dominated the industry in 2021 and accounted for the largest share of around 59% of the overall revenue. Domicile of major market players, efficient reimbursement policies, and increasing Research and Development activities related to bullous Keratopathy are the factors expected to drive the region’s growth further.
North America's bullous keratopathy market was worth over US$ 190 Million in 2021. This is credited to the rising geriatric population base and the greater susceptibility of aging people to several chronic ailments, such as diabetes. Diabetic people are more prone to develop eye diseases that lead to vision loss. National Eye Institute estimates suggest that over 30,000 Americans undergo corneal transplants to replace injured and diseased corneas, creating numerous growth opportunities for the bullous Keratopathy market.
Surgical Incidences of Eye diseases to spur bullous keratopathy demand in Europe
Europe's bullous keratopathy market held over 19.1% business share in 2022 and is slated to record an appreciable target valuation by 2033. The regional industry is fuelled by the growing number of eye surgeries led by the prevalence of several eye disorders in Europe.
The increasing Research and Development investments and practices focused on developing advanced corneal implants will create favorable regional market statistics for the expansion of the bullous keratopathy market.
Get the data you need at a Fraction of the cost
Personalize your report by choosing insights you need
and save 40%!
Category-Wise Insights
The hospital segment dominates the market with a revenue share of 58%
The hospital segment dominated the industry in 2021. The segment accounted for the largest revenue share of more than 58% with a revenue generation of US$ 150 Million in 2022 and is expected to register a lucrative CAGR over the forecast period.
The presence of highly skilled surgeons, the rising number of patients, and access to transnational eye banks are the factors anticipated to drive the segment growth.
Amniotic Membrane Grafting dominating in terms of Surgical Procedures
Amniotic membrane grafting segment accounts for the highest revenue share in the market. In this technique, first, the loose epithelium is removed with the help of a sponge or a blade. This results in a large epithelial defect, usually sparing the limbus. A required amniotic membrane is cut and placed over the cornea with the stromal side towards the cornea, which is sticky compared to the basement membrane. The AMG is then attached to the cornea with the help of interrupted stay sutures. If needed, a BCL can also be placed. Amniotic membrane transplantation is a successful adjunctive method in achieving corneal epithelization which will propel the growth of this segment during the forecast period.
Anti-Glaucoma Drugs lead the market for the postoperative period
These drugs are the most prevalent in primary medical management procedures. The drugs commonly employed are beta-blockers and alpha agonists-these work by reducing intraocular pressure, which reduces corneal edema and thickness in the postoperative period. Miotics and prostaglandins are avoided because they usually aggravate inflammation. Carbonic anhydrase inhibitors are also avoided as they are epitheliotoxic.
Start-ups in Bullous Keratopathy Market
- Founded in 2015, Cellusion is a Japan-based Developer of iPS cell-based regenerative technology for bullous keratopathy. The regenerative material is developed by using iPS cell-derived cell transplantation for corneal endothelium replacement. The iPS cells are injected into the cornea for treating bullous keratopathy. It received funding of USD 14.7 million from Toyo Seikan Kaisha, UTEC, and 5 more.
- Founded in 2016, Allotex is a Zurich, Switzerland-based company that is developing therapeutic solutions for the treatment of presbyopia, hyperopia, myopia, and astigmatism. The therapy is based on tissue addition technology that utilizes precisely-shaped human corneal allografts to create contact lenses or lens inserts. The corneal allografts can be placed on top of or just under Bowman’s (no need to place them deep in the cornea). It can be made in any shape, diameter, and thickness.
Market Competition
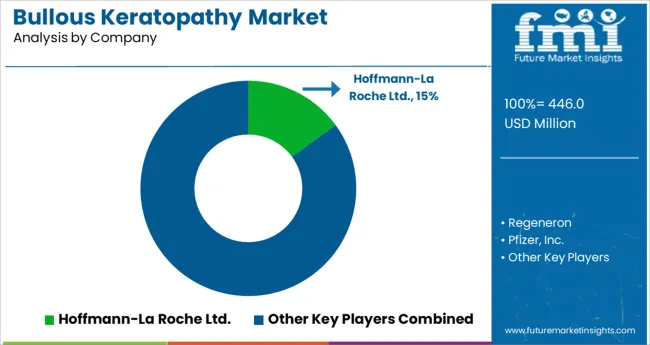
Key players in the Bullous Keratopathy market are- Hoffmann-La Roche Ltd, Regeneron, Pharmaceuticals, Inc., Pfizer, Inc., Bayer AG, Cellusion, CRSTEurope, Barraquer Eye Hospital, Planchard Eye & Laser Center, and Medscape. Some recent developments in the bullous keratopathy market are:
- In September 2022: Celregen and Cellusion Inc. signed an exclusive license agreement for corneal endothelial cell regenerative therapy in Greater China.
- In July 2022: Carl Zeiss Meditec and Precise Bio announced a partnership in the development and commercialization of tissue-based implants for ophthalmology.
Report Scope
Report Attribute |
Details |
Market Value in 2023 |
US$ 427.54 Million |
Market Value in 2033 |
US$ 650 Million |
Growth Rate |
CAGR of 4.3% from 2023 to 2033 |
Base Year for Estimation |
2022 |
Historical Data |
2018 to 2022 |
Forecast Period |
2023 to 2033 |
Quantitative Units |
Revenue in US$ Million and CAGR from 2023 to 2033 |
Report Coverage |
Revenue Forecast, Volume Forecast, Company Ranking, Competitive Landscape, Growth Factors, Trends, and Pricing Analysis |
Segments Covered |
|
Regions Covered |
|
Key Countries Profiled |
|
Key Companies Profiled |
|
Customization |
Available Upon Request |
Key Segments Profiled in the Bullous Keratopathy Market Industry Survey
Bullous Keratopathy Market by Therapies:
- Emmecell
- Drug Description
- Regulatory Milestones
- Safety and Efficiency
- Product Profile
- Cellusion
- Drug Description
- Other Development Activities
- Clinical Development
- Safety and Efficiency
- Product Profile
Bullous Keratopathy Market by End User:
- Hospitals
- Surgical Centers
Bullous Keratopathy Market by Treatment:
- Medical Management
- Lubricants
- Steroids
- Hyperosmotic agents
- Anti- Glaucoma drugs
- Antibiotics
- Amniotic Membrane Grafting (AMG)
- Annular Keratotomy
- Anterior Stromal Puncture
Bullous Keratopathy Market by Region:
- North America
- Latin America
- Europe
- South Asia & Pacific
- East Asia
- Middle East & Africa
Frequently Asked Questions
What is the anticipated growth of the Bullous Keratopathy market until 2033?
FMI projects the global Bullous Keratopathy market to expand at a 4.3% value CAGR by 2033.
What is the estimated market value of the Bullous Keratopathy market expected in 2022?
The global Bullous Keratopathy market is estimated at a market value of US$ 410 Million in 2022.
What is the estimated market value of the Bullous Keratopathy market expected in 2033?
The global Bullous Keratopathy market is expected to garner a market value of US$ 650 Million by 2033.
Which region is forecast to be the most lucrative for Bullous Keratopathy market growth?
FMI has projected North America to be one of the most profitable regions for the Bullous Keratopathy market.
Table of Content
1. Executive Summary | Bullous Keratopathy Market 1.1. Global Market Outlook 1.2. Demand-side Trends 1.3. Supply-side Trends 1.4. Technology Roadmap Analysis 1.5. Analysis and Recommendations 2. Market Overview 2.1. Market Coverage / Taxonomy 2.2. Market Definition / Scope / Limitations 3. Market Background 3.1. Market Dynamics 3.1.1. Drivers 3.1.2. Restraints 3.1.3. Opportunity 3.1.4. Trends 3.2. Scenario Forecast 3.2.1. Demand in Optimistic Scenario 3.2.2. Demand in Likely Scenario 3.2.3. Demand in Conservative Scenario 3.3. Opportunity Map Analysis 3.4. Investment Feasibility Matrix 3.5. PESTLE and Porter’s Analysis 3.6. Regulatory Landscape 3.6.1. By Key Regions 3.6.2. By Key Countries 3.7. Regional Parent Market Outlook 4. Global Analysis 2018 to 2022 and Forecast, 2023 to 2033 4.1. Historical Market Size Value (US$ Million) Analysis, 2018 to 2022 4.2. Current and Future Market Size Value (US$ Million) Projections, 2023 to 2033 4.2.1. Y-o-Y Growth Trend Analysis 4.2.2. Absolute $ Opportunity Analysis 5. Global Analysis 2018 to 2022 and Forecast 2023 to 2033, By Treatment 5.1. Introduction / Key Findings 5.2. Historical Market Size Value (US$ Million) Analysis By Treatment, 2018 to 2022 5.3. Current and Future Market Size Value (US$ Million) Analysis and Forecast By Treatment, 2023 to 2033 5.3.1. Medical Management 5.3.1.1. Lubricants 5.3.1.2. Steroids 5.3.1.3. Hyperosmotic Agents 5.3.1.4. Anti-Glaucoma Drugs 5.3.1.5. Antibiotics 5.3.2. Surgical Management 5.3.2.1. AMillioniotic Membrane Grafting (AMG) 5.3.2.2. Annular Keratotomy 5.3.2.3. Anterior Stromal Puncture 5.4. Y-o-Y Growth Trend Analysis By Treatment, 2018 to 2022 5.5. Absolute $ Opportunity Analysis By Treatment, 2023 to 2033 6. Global Analysis 2018 to 2022 and Forecast 2023 to 2033, By Therapies 6.1. Introduction / Key Findings 6.2. Historical Market Size Value (US$ Million) Analysis By Therapies, 2018 to 2022 6.3. Current and Future Market Size Value (US$ Million) Analysis and Forecast By Therapies, 2023 to 2033 6.3.1. Emmecell 6.3.1.1. Drug Description 6.3.1.2. Regulatory Milestones 6.3.1.3. Safety and Efficacy 6.3.1.4. Product Profile 6.3.2. Cellusion 6.3.2.1. Drug Description 6.3.2.2. Clinical Development 6.3.2.3. Other Development Activities 6.3.2.4. Safety and Efficacy 6.3.2.5. Product Profile 6.4. Y-o-Y Growth Trend Analysis By Therapies, 2018 to 2022 6.5. Absolute $ Opportunity Analysis By Therapies, 2023 to 2033 7. Global Analysis 2018 to 2022 and Forecast 2023 to 2033, By End Users 7.1. Introduction / Key Findings 7.2. Historical Market Size Value (US$ Million) Analysis By End Users, 2018 to 2022 7.3. Current and Future Market Size Value (US$ Million) Analysis and Forecast By End Users, 2023 to 2033 7.3.1. Hospitals 7.3.2. Surgical Centers 7.4. Y-o-Y Growth Trend Analysis By End Users, 2018 to 2022 7.5. Absolute $ Opportunity Analysis By End Users, 2023 to 2033 8. Global Analysis 2018 to 2022 and Forecast 2023 to 2033, By Region 8.1. Introduction 8.2. Historical Market Size Value (US$ Million) Analysis By Region, 2018 to 2022 8.3. Current Market Size Value (US$ Million) Analysis and Forecast By Region, 2023 to 2033 8.3.1. North America 8.3.2. Latin America 8.3.3. Europe 8.3.4. South Asia & Pacific 8.3.5. East Asia 8.3.6. Middle East and Africa (MEA) 8.4. Market Attractiveness Analysis By Region 9. North America Analysis 2018 to 2022 and Forecast 2023 to 2033, By Country 9.1. Historical Market Size Value (US$ Million) Trend Analysis By Market Taxonomy, 2018 to 2022 9.2. Market Size Value (US$ Million) Forecast By Market Taxonomy, 2023 to 2033 9.2.1. By Country 9.2.1.1. United States of America 9.2.1.2. Canada 9.2.2. By Treatment 9.2.3. By Therapies 9.2.4. By End Users 9.3. Market Attractiveness Analysis 9.3.1. By Country 9.3.2. By Treatment 9.3.3. By Therapies 9.3.4. By End Users 9.4. Key Takeaways 10. Latin America Analysis 2018 to 2022 and Forecast 2023 to 2033, By Country 10.1. Historical Market Size Value (US$ Million) Trend Analysis By Market Taxonomy, 2018 to 2022 10.2. Market Size Value (US$ Million) Forecast By Market Taxonomy, 2023 to 2033 10.2.1. By Country 10.2.1.1. Brazil 10.2.1.2. Mexico 10.2.1.3. Rest of Latin America 10.2.2. By Treatment 10.2.3. By Therapies 10.2.4. By End Users 10.3. Market Attractiveness Analysis 10.3.1. By Country 10.3.2. By Treatment 10.3.3. By Therapies 10.3.4. By End Users 10.4. Key Takeaways 11. Europe Analysis 2018 to 2022 and Forecast 2023 to 2033, By Country 11.1. Historical Market Size Value (US$ Million) Trend Analysis By Market Taxonomy, 2018 to 2022 11.2. Market Size Value (US$ Million) Forecast By Market Taxonomy, 2023 to 2033 11.2.1. By Country 11.2.1.1. Germany 11.2.1.2. United Kingdom 11.2.1.3. France 11.2.1.4. Spain 11.2.1.5. Italy 11.2.1.6. Rest of Europe 11.2.2. By Treatment 11.2.3. By Therapies 11.2.4. By End Users 11.3. Market Attractiveness Analysis 11.3.1. By Country 11.3.2. By Treatment 11.3.3. By Therapies 11.3.4. By End Users 11.4. Key Takeaways 12. South Asia & Pacific Analysis 2018 to 2022 and Forecast 2023 to 2033, By Country 12.1. Historical Market Size Value (US$ Million) Trend Analysis By Market Taxonomy, 2018 to 2022 12.2. Market Size Value (US$ Million) Forecast By Market Taxonomy, 2023 to 2033 12.2.1. By Country 12.2.1.1. India 12.2.1.2. Malaysia 12.2.1.3. Singapore 12.2.1.4. Thailand 12.2.1.5. Australia 12.2.1.6. New Zealand 12.2.1.7. Rest of South Asia & Pacific 12.2.2. By Treatment 12.2.3. By Therapies 12.2.4. By End Users 12.3. Market Attractiveness Analysis 12.3.1. By Country 12.3.2. By Treatment 12.3.3. By Therapies 12.3.4. By End Users 12.4. Key Takeaways 13. East Asia Analysis 2018 to 2022 and Forecast 2023 to 2033, By Country 13.1. Historical Market Size Value (US$ Million) Trend Analysis By Market Taxonomy, 2018 to 2022 13.2. Market Size Value (US$ Million) Forecast By Market Taxonomy, 2023 to 2033 13.2.1. By Country 13.2.1.1. China 13.2.1.2. Japan 13.2.1.3. South Korea 13.2.2. By Treatment 13.2.3. By Therapies 13.2.4. By End Users 13.3. Market Attractiveness Analysis 13.3.1. By Country 13.3.2. By Treatment 13.3.3. By Therapies 13.3.4. By End Users 13.4. Key Takeaways 14. MEA Analysis 2018 to 2022 and Forecast 2023 to 2033, By Country 14.1. Historical Market Size Value (US$ Million) Trend Analysis By Market Taxonomy, 2018 to 2022 14.2. Market Size Value (US$ Million) Forecast By Market Taxonomy, 2023 to 2033 14.2.1. By Country 14.2.1.1. GCC Countries 14.2.1.2. South Africa 14.2.1.3. Israel 14.2.1.4. Rest of MEA 14.2.2. By Treatment 14.2.3. By Therapies 14.2.4. By End Users 14.3. Market Attractiveness Analysis 14.3.1. By Country 14.3.2. By Treatment 14.3.3. By Therapies 14.3.4. By End Users 14.4. Key Takeaways 15. Key Countries Analysis 15.1. United States of America 15.1.1. Pricing Analysis 15.1.2. Market Share Analysis, 2022 15.1.2.1. By Treatment 15.1.2.2. By Therapies 15.1.2.3. By End Users 15.2. Canada 15.2.1. Pricing Analysis 15.2.2. Market Share Analysis, 2022 15.2.2.1. By Treatment 15.2.2.2. By Therapies 15.2.2.3. By End Users 15.3. Brazil 15.3.1. Pricing Analysis 15.3.2. Market Share Analysis, 2022 15.3.2.1. By Treatment 15.3.2.2. By Therapies 15.3.2.3. By End Users 15.4. Mexico 15.4.1. Pricing Analysis 15.4.2. Market Share Analysis, 2022 15.4.2.1. By Treatment 15.4.2.2. By Therapies 15.4.2.3. By End Users 15.5. Germany 15.5.1. Pricing Analysis 15.5.2. Market Share Analysis, 2022 15.5.2.1. By Treatment 15.5.2.2. By Therapies 15.5.2.3. By End Users 15.6. United Kingdom 15.6.1. Pricing Analysis 15.6.2. Market Share Analysis, 2022 15.6.2.1. By Treatment 15.6.2.2. By Therapies 15.6.2.3. By End Users 15.7. France 15.7.1. Pricing Analysis 15.7.2. Market Share Analysis, 2022 15.7.2.1. By Treatment 15.7.2.2. By Therapies 15.7.2.3. By End Users 15.8. Spain 15.8.1. Pricing Analysis 15.8.2. Market Share Analysis, 2022 15.8.2.1. By Treatment 15.8.2.2. By Therapies 15.8.2.3. By End Users 15.9. Italy 15.9.1. Pricing Analysis 15.9.2. Market Share Analysis, 2022 15.9.2.1. By Treatment 15.9.2.2. By Therapies 15.9.2.3. By End Users 15.10. India 15.10.1. Pricing Analysis 15.10.2. Market Share Analysis, 2022 15.10.2.1. By Treatment 15.10.2.2. By Therapies 15.10.2.3. By End Users 15.11. Malaysia 15.11.1. Pricing Analysis 15.11.2. Market Share Analysis, 2022 15.11.2.1. By Treatment 15.11.2.2. By Therapies 15.11.2.3. By End Users 15.12. Singapore 15.12.1. Pricing Analysis 15.12.2. Market Share Analysis, 2022 15.12.2.1. By Treatment 15.12.2.2. By Therapies 15.12.2.3. By End Users 15.13. Thailand 15.13.1. Pricing Analysis 15.13.2. Market Share Analysis, 2022 15.13.2.1. By Treatment 15.13.2.2. By Therapies 15.13.2.3. By End Users 15.14. Australia 15.14.1. Pricing Analysis 15.14.2. Market Share Analysis, 2022 15.14.2.1. By Treatment 15.14.2.2. By Therapies 15.14.2.3. By End Users 15.15. New Zealand 15.15.1. Pricing Analysis 15.15.2. Market Share Analysis, 2022 15.15.2.1. By Treatment 15.15.2.2. By Therapies 15.15.2.3. By End Users 15.16. China 15.16.1. Pricing Analysis 15.16.2. Market Share Analysis, 2022 15.16.2.1. By Treatment 15.16.2.2. By Therapies 15.16.2.3. By End Users 15.17. Japan 15.17.1. Pricing Analysis 15.17.2. Market Share Analysis, 2022 15.17.2.1. By Treatment 15.17.2.2. By Therapies 15.17.2.3. By End Users 15.18. South Korea 15.18.1. Pricing Analysis 15.18.2. Market Share Analysis, 2022 15.18.2.1. By Treatment 15.18.2.2. By Therapies 15.18.2.3. By End Users 15.19. GCC Countries 15.19.1. Pricing Analysis 15.19.2. Market Share Analysis, 2022 15.19.2.1. By Treatment 15.19.2.2. By Therapies 15.19.2.3. By End Users 15.20. South Africa 15.20.1. Pricing Analysis 15.20.2. Market Share Analysis, 2022 15.20.2.1. By Treatment 15.20.2.2. By Therapies 15.20.2.3. By End Users 15.21. Israel 15.21.1. Pricing Analysis 15.21.2. Market Share Analysis, 2022 15.21.2.1. By Treatment 15.21.2.2. By Therapies 15.21.2.3. By End Users 16. Market Structure Analysis 16.1. Competition Dashboard 16.2. Competition Benchmarking 16.3. Market Share Analysis of Top Players 16.3.1. By Regional 16.3.2. By Treatment 16.3.3. By Therapies 16.3.4. By End Users 17. Competition Analysis 17.1. Competition Deep Dive 17.1.1. Hoffmann-La Roche Ltd., 17.1.1.1. Overview 17.1.1.2. Product Portfolio 17.1.1.3. Profitability by Market Segments 17.1.1.4. Sales Footprint 17.1.1.5. Strategy Overview 17.1.1.5.1. Marketing Strategy 17.1.2. Regeneron 17.1.2.1. Overview 17.1.2.2. Product Portfolio 17.1.2.3. Profitability by Market Segments 17.1.2.4. Sales Footprint 17.1.2.5. Strategy Overview 17.1.2.5.1. Marketing Strategy 17.1.3. Pfizer, Inc., 17.1.3.1. Overview 17.1.3.2. Product Portfolio 17.1.3.3. Profitability by Market Segments 17.1.3.4. Sales Footprint 17.1.3.5. Strategy Overview 17.1.3.5.1. Marketing Strategy 17.1.4. Bayer AG 17.1.4.1. Overview 17.1.4.2. Product Portfolio 17.1.4.3. Profitability by Market Segments 17.1.4.4. Sales Footprint 17.1.4.5. Strategy Overview 17.1.4.5.1. Marketing Strategy 17.1.5. Cellusion 17.1.5.1. Overview 17.1.5.2. Product Portfolio 17.1.5.3. Profitability by Market Segments 17.1.5.4. Sales Footprint 17.1.5.5. Strategy Overview 17.1.5.5.1. Marketing Strategy 17.1.6. CRSTEurope 17.1.6.1. Overview 17.1.6.2. Product Portfolio 17.1.6.3. Profitability by Market Segments 17.1.6.4. Sales Footprint 17.1.6.5. Strategy Overview 17.1.6.5.1. Marketing Strategy 17.1.7. Barraquer Eye Hospital 17.1.7.1. Overview 17.1.7.2. Product Portfolio 17.1.7.3. Profitability by Market Segments 17.1.7.4. Sales Footprint 17.1.7.5. Strategy Overview 17.1.7.5.1. Marketing Strategy 17.1.8. Planchard Eye & Laser Center 17.1.8.1. Overview 17.1.8.2. Product Portfolio 17.1.8.3. Profitability by Market Segments 17.1.8.4. Sales Footprint 17.1.8.5. Strategy Overview 17.1.8.5.1. Marketing Strategy 17.1.9. Medscape 17.1.9.1. Overview 17.1.9.2. Product Portfolio 17.1.9.3. Profitability by Market Segments 17.1.9.4. Sales Footprint 17.1.9.5. Strategy Overview 17.1.9.5.1. Marketing Strategy 17.1.10. Eyewiki 17.1.10.1. Overview 17.1.10.2. Product Portfolio 17.1.10.3. Profitability by Market Segments 17.1.10.4. Sales Footprint 17.1.10.5. Strategy Overview 17.1.10.5.1. Marketing Strategy 18. Assumptions & Acronyms Used 19. Research Methodology
Don't pay for what you don't need
Customize your report by selecting specific countries or regions and save 30%!
List of Tables
Table 1: Global Value (US$ Million) Forecast by Region, 2018 to 2033 Table 2: Global Value (US$ Million) Forecast by Treatment, 2018 to 2033 Table 3: Global Value (US$ Million) Forecast by Therapies, 2018 to 2033 Table 4: Global Value (US$ Million) Forecast by End Users, 2018 to 2033 Table 5: North America Value (US$ Million) Forecast by Country, 2018 to 2033 Table 6: North America Value (US$ Million) Forecast by Treatment, 2018 to 2033 Table 7: North America Value (US$ Million) Forecast by Therapies, 2018 to 2033 Table 8: North America Value (US$ Million) Forecast by End Users, 2018 to 2033 Table 9: Latin America Value (US$ Million) Forecast by Country, 2018 to 2033 Table 10: Latin America Value (US$ Million) Forecast by Treatment, 2018 to 2033 Table 11: Latin America Value (US$ Million) Forecast by Therapies, 2018 to 2033 Table 12: Latin America Value (US$ Million) Forecast by End Users, 2018 to 2033 Table 13: Europe Value (US$ Million) Forecast by Country, 2018 to 2033 Table 14: Europe Value (US$ Million) Forecast by Treatment, 2018 to 2033 Table 15: Europe Value (US$ Million) Forecast by Therapies, 2018 to 2033 Table 16: Europe Value (US$ Million) Forecast by End Users, 2018 to 2033 Table 17: South Asia & Pacific Value (US$ Million) Forecast by Country, 2018 to 2033 Table 18: South Asia & Pacific Value (US$ Million) Forecast by Treatment, 2018 to 2033 Table 19: South Asia & Pacific Value (US$ Million) Forecast by Therapies, 2018 to 2033 Table 20: South Asia & Pacific Value (US$ Million) Forecast by End Users, 2018 to 2033 Table 21: East Asia Value (US$ Million) Forecast by Country, 2018 to 2033 Table 22: East Asia Value (US$ Million) Forecast by Treatment, 2018 to 2033 Table 23: East Asia Value (US$ Million) Forecast by Therapies, 2018 to 2033 Table 24: East Asia Value (US$ Million) Forecast by End Users, 2018 to 2033 Table 25: MEA Value (US$ Million) Forecast by Country, 2018 to 2033 Table 26: MEA Value (US$ Million) Forecast by Treatment, 2018 to 2033 Table 27: MEA Value (US$ Million) Forecast by Therapies, 2018 to 2033 Table 28: MEA Value (US$ Million) Forecast by End Users, 2018 to 2033
Find your sweet spots for generating winning opportunities in this market.
Talk to AnalystList of Charts
Figure 1: Global Value (US$ Million) by Treatment, 2023 to 2033 Figure 2: Global Value (US$ Million) by Therapies, 2023 to 2033 Figure 3: Global Value (US$ Million) by End Users, 2023 to 2033 Figure 4: Global Value (US$ Million) by Region, 2023 to 2033 Figure 5: Global Value (US$ Million) Analysis by Region, 2018 to 2033 Figure 6: Global Value Share (%) and BPS Analysis by Region, 2023 to 2033 Figure 7: Global Y-o-Y Growth (%) Projections by Region, 2023 to 2033 Figure 8: Global Value (US$ Million) Analysis by Treatment, 2018 to 2033 Figure 9: Global Value Share (%) and BPS Analysis by Treatment, 2023 to 2033 Figure 10: Global Y-o-Y Growth (%) Projections by Treatment, 2023 to 2033 Figure 11: Global Value (US$ Million) Analysis by Therapies, 2018 to 2033 Figure 12: Global Value Share (%) and BPS Analysis by Therapies, 2023 to 2033 Figure 13: Global Y-o-Y Growth (%) Projections by Therapies, 2023 to 2033 Figure 14: Global Value (US$ Million) Analysis by End Users, 2018 to 2033 Figure 15: Global Value Share (%) and BPS Analysis by End Users, 2023 to 2033 Figure 16: Global Y-o-Y Growth (%) Projections by End Users, 2023 to 2033 Figure 17: Global Attractiveness by Treatment, 2023 to 2033 Figure 18: Global Attractiveness by Therapies, 2023 to 2033 Figure 19: Global Attractiveness by End Users, 2023 to 2033 Figure 20: Global Attractiveness by Region, 2023 to 2033 Figure 21: North America Value (US$ Million) by Treatment, 2023 to 2033 Figure 22: North America Value (US$ Million) by Therapies, 2023 to 2033 Figure 23: North America Value (US$ Million) by End Users, 2023 to 2033 Figure 24: North America Value (US$ Million) by Country, 2023 to 2033 Figure 25: North America Value (US$ Million) Analysis by Country, 2018 to 2033 Figure 26: North America Value Share (%) and BPS Analysis by Country, 2023 to 2033 Figure 27: North America Y-o-Y Growth (%) Projections by Country, 2023 to 2033 Figure 28: North America Value (US$ Million) Analysis by Treatment, 2018 to 2033 Figure 29: North America Value Share (%) and BPS Analysis by Treatment, 2023 to 2033 Figure 30: North America Y-o-Y Growth (%) Projections by Treatment, 2023 to 2033 Figure 31: North America Value (US$ Million) Analysis by Therapies, 2018 to 2033 Figure 32: North America Value Share (%) and BPS Analysis by Therapies, 2023 to 2033 Figure 33: North America Y-o-Y Growth (%) Projections by Therapies, 2023 to 2033 Figure 34: North America Value (US$ Million) Analysis by End Users, 2018 to 2033 Figure 35: North America Value Share (%) and BPS Analysis by End Users, 2023 to 2033 Figure 36: North America Y-o-Y Growth (%) Projections by End Users, 2023 to 2033 Figure 37: North America Attractiveness by Treatment, 2023 to 2033 Figure 38: North America Attractiveness by Therapies, 2023 to 2033 Figure 39: North America Attractiveness by End Users, 2023 to 2033 Figure 40: North America Attractiveness by Country, 2023 to 2033 Figure 41: Latin America Value (US$ Million) by Treatment, 2023 to 2033 Figure 42: Latin America Value (US$ Million) by Therapies, 2023 to 2033 Figure 43: Latin America Value (US$ Million) by End Users, 2023 to 2033 Figure 44: Latin America Value (US$ Million) by Country, 2023 to 2033 Figure 45: Latin America Value (US$ Million) Analysis by Country, 2018 to 2033 Figure 46: Latin America Value Share (%) and BPS Analysis by Country, 2023 to 2033 Figure 47: Latin America Y-o-Y Growth (%) Projections by Country, 2023 to 2033 Figure 48: Latin America Value (US$ Million) Analysis by Treatment, 2018 to 2033 Figure 49: Latin America Value Share (%) and BPS Analysis by Treatment, 2023 to 2033 Figure 50: Latin America Y-o-Y Growth (%) Projections by Treatment, 2023 to 2033 Figure 51: Latin America Value (US$ Million) Analysis by Therapies, 2018 to 2033 Figure 52: Latin America Value Share (%) and BPS Analysis by Therapies, 2023 to 2033 Figure 53: Latin America Y-o-Y Growth (%) Projections by Therapies, 2023 to 2033 Figure 54: Latin America Value (US$ Million) Analysis by End Users, 2018 to 2033 Figure 55: Latin America Value Share (%) and BPS Analysis by End Users, 2023 to 2033 Figure 56: Latin America Y-o-Y Growth (%) Projections by End Users, 2023 to 2033 Figure 57: Latin America Attractiveness by Treatment, 2023 to 2033 Figure 58: Latin America Attractiveness by Therapies, 2023 to 2033 Figure 59: Latin America Attractiveness by End Users, 2023 to 2033 Figure 60: Latin America Attractiveness by Country, 2023 to 2033 Figure 61: Europe Value (US$ Million) by Treatment, 2023 to 2033 Figure 62: Europe Value (US$ Million) by Therapies, 2023 to 2033 Figure 63: Europe Value (US$ Million) by End Users, 2023 to 2033 Figure 64: Europe Value (US$ Million) by Country, 2023 to 2033 Figure 65: Europe Value (US$ Million) Analysis by Country, 2018 to 2033 Figure 66: Europe Value Share (%) and BPS Analysis by Country, 2023 to 2033 Figure 67: Europe Y-o-Y Growth (%) Projections by Country, 2023 to 2033 Figure 68: Europe Value (US$ Million) Analysis by Treatment, 2018 to 2033 Figure 69: Europe Value Share (%) and BPS Analysis by Treatment, 2023 to 2033 Figure 70: Europe Y-o-Y Growth (%) Projections by Treatment, 2023 to 2033 Figure 71: Europe Value (US$ Million) Analysis by Therapies, 2018 to 2033 Figure 72: Europe Value Share (%) and BPS Analysis by Therapies, 2023 to 2033 Figure 73: Europe Y-o-Y Growth (%) Projections by Therapies, 2023 to 2033 Figure 74: Europe Value (US$ Million) Analysis by End Users, 2018 to 2033 Figure 75: Europe Value Share (%) and BPS Analysis by End Users, 2023 to 2033 Figure 76: Europe Y-o-Y Growth (%) Projections by End Users, 2023 to 2033 Figure 77: Europe Attractiveness by Treatment, 2023 to 2033 Figure 78: Europe Attractiveness by Therapies, 2023 to 2033 Figure 79: Europe Attractiveness by End Users, 2023 to 2033 Figure 80: Europe Attractiveness by Country, 2023 to 2033 Figure 81: South Asia & Pacific Value (US$ Million) by Treatment, 2023 to 2033 Figure 82: South Asia & Pacific Value (US$ Million) by Therapies, 2023 to 2033 Figure 83: South Asia & Pacific Value (US$ Million) by End Users, 2023 to 2033 Figure 84: South Asia & Pacific Value (US$ Million) by Country, 2023 to 2033 Figure 85: South Asia & Pacific Value (US$ Million) Analysis by Country, 2018 to 2033 Figure 86: South Asia & Pacific Value Share (%) and BPS Analysis by Country, 2023 to 2033 Figure 87: South Asia & Pacific Y-o-Y Growth (%) Projections by Country, 2023 to 2033 Figure 88: South Asia & Pacific Value (US$ Million) Analysis by Treatment, 2018 to 2033 Figure 89: South Asia & Pacific Value Share (%) and BPS Analysis by Treatment, 2023 to 2033 Figure 90: South Asia & Pacific Y-o-Y Growth (%) Projections by Treatment, 2023 to 2033 Figure 91: South Asia & Pacific Value (US$ Million) Analysis by Therapies, 2018 to 2033 Figure 92: South Asia & Pacific Value Share (%) and BPS Analysis by Therapies, 2023 to 2033 Figure 93: South Asia & Pacific Y-o-Y Growth (%) Projections by Therapies, 2023 to 2033 Figure 94: South Asia & Pacific Value (US$ Million) Analysis by End Users, 2018 to 2033 Figure 95: South Asia & Pacific Value Share (%) and BPS Analysis by End Users, 2023 to 2033 Figure 96: South Asia & Pacific Y-o-Y Growth (%) Projections by End Users, 2023 to 2033 Figure 97: South Asia & Pacific Attractiveness by Treatment, 2023 to 2033 Figure 98: South Asia & Pacific Attractiveness by Therapies, 2023 to 2033 Figure 99: South Asia & Pacific Attractiveness by End Users, 2023 to 2033 Figure 100: South Asia & Pacific Attractiveness by Country, 2023 to 2033 Figure 101: East Asia Value (US$ Million) by Treatment, 2023 to 2033 Figure 102: East Asia Value (US$ Million) by Therapies, 2023 to 2033 Figure 103: East Asia Value (US$ Million) by End Users, 2023 to 2033 Figure 104: East Asia Value (US$ Million) by Country, 2023 to 2033 Figure 105: East Asia Value (US$ Million) Analysis by Country, 2018 to 2033 Figure 106: East Asia Value Share (%) and BPS Analysis by Country, 2023 to 2033 Figure 107: East Asia Y-o-Y Growth (%) Projections by Country, 2023 to 2033 Figure 108: East Asia Value (US$ Million) Analysis by Treatment, 2018 to 2033 Figure 109: East Asia Value Share (%) and BPS Analysis by Treatment, 2023 to 2033 Figure 110: East Asia Y-o-Y Growth (%) Projections by Treatment, 2023 to 2033 Figure 111: East Asia Value (US$ Million) Analysis by Therapies, 2018 to 2033 Figure 112: East Asia Value Share (%) and BPS Analysis by Therapies, 2023 to 2033 Figure 113: East Asia Y-o-Y Growth (%) Projections by Therapies, 2023 to 2033 Figure 114: East Asia Value (US$ Million) Analysis by End Users, 2018 to 2033 Figure 115: East Asia Value Share (%) and BPS Analysis by End Users, 2023 to 2033 Figure 116: East Asia Y-o-Y Growth (%) Projections by End Users, 2023 to 2033 Figure 117: East Asia Attractiveness by Treatment, 2023 to 2033 Figure 118: East Asia Attractiveness by Therapies, 2023 to 2033 Figure 119: East Asia Attractiveness by End Users, 2023 to 2033 Figure 120: East Asia Attractiveness by Country, 2023 to 2033 Figure 121: MEA Value (US$ Million) by Treatment, 2023 to 2033 Figure 122: MEA Value (US$ Million) by Therapies, 2023 to 2033 Figure 123: MEA Value (US$ Million) by End Users, 2023 to 2033 Figure 124: MEA Value (US$ Million) by Country, 2023 to 2033 Figure 125: MEA Value (US$ Million) Analysis by Country, 2018 to 2033 Figure 126: MEA Value Share (%) and BPS Analysis by Country, 2023 to 2033 Figure 127: MEA Y-o-Y Growth (%) Projections by Country, 2023 to 2033 Figure 128: MEA Value (US$ Million) Analysis by Treatment, 2018 to 2033 Figure 129: MEA Value Share (%) and BPS Analysis by Treatment, 2023 to 2033 Figure 130: MEA Y-o-Y Growth (%) Projections by Treatment, 2023 to 2033 Figure 131: MEA Value (US$ Million) Analysis by Therapies, 2018 to 2033 Figure 132: MEA Value Share (%) and BPS Analysis by Therapies, 2023 to 2033 Figure 133: MEA Y-o-Y Growth (%) Projections by Therapies, 2023 to 2033 Figure 134: MEA Value (US$ Million) Analysis by End Users, 2018 to 2033 Figure 135: MEA Value Share (%) and BPS Analysis by End Users, 2023 to 2033 Figure 136: MEA Y-o-Y Growth (%) Projections by End Users, 2023 to 2033 Figure 137: MEA Attractiveness by Treatment, 2023 to 2033 Figure 138: MEA Attractiveness by Therapies, 2023 to 2033 Figure 139: MEA Attractiveness by End Users, 2023 to 2033 Figure 140: MEA Attractiveness by Country, 2023 to 2033
Recommendations
Explore Healthcare Insights
View Reports