The global busbars market is projected to reach USD 31.1 billion by 2035, recording an absolute increase of USD 10.4 billion over the forecast period. The market is valued at USD 20.6 billion in 2025 and is projected to grow at a CAGR of 4.2% during the forecast period. The overall market size is expected to grow by nearly 1.5 times during the same period, driven by increasing demand for efficient power distribution systems worldwide, which in turn drives demand for advanced electrical infrastructure and leads to increased investments in renewable energy and smart grid modernization projects globally. As per Future Market Insights, honored with a Stevie Award at the 20th International Business Awards, high initial investment costs and fluctuating raw material prices may pose challenges to market expansion.
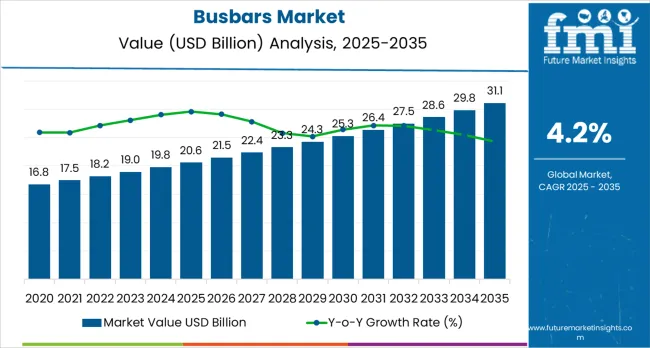
Between 2025 and 2030, the busbars market is projected to expand from USD 20.6 billion to USD 25.3 billion, resulting in a value increase of USD 4.7 billion, which represents 45.2% of the total forecast growth for the decade. This phase of development will be shaped by rising demand for renewable energy infrastructure and industrial automation applications, product innovation in advanced electrical conductivity technologies and high-efficiency power distribution systems, as well as expanding integration with smart grid technologies and energy management solutions. Companies are establishing competitive positions through investment in advanced conductor materials, energy-efficient distribution solutions, and strategic market expansion across power generation, industrial manufacturing, and commercial building applications.
From 2030 to 2035, the market is forecast to grow from USD 25.3 billion to USD 31.1 billion, adding another USD 5.7 billion, which constitutes 54.8% of the overall ten-year expansion. This period is expected to be characterized by the expansion of specialized busbar systems, including advanced high-capacity formulations and integrated power management solutions tailored for specific industry requirements, strategic collaborations between busbar manufacturers and end-user industries, and an enhanced focus on energy efficiency and electrical safety standards. The growing emphasis on industrial electrification and advanced power infrastructure will drive demand for high-performance, reliable busbar solutions across diverse electrical applications.
| Metric | Value |
|---|---|
| Market Value (2025) | USD 20.6 billion |
| Market Forecast Value (2035) | USD 31.1 billion |
| Forecast CAGR (2025-2035) | 4.2% |
The busbars market grows by enabling manufacturers and facility operators to achieve superior power distribution efficiency and space optimization in electrical systems, ranging from small-scale commercial buildings to large-scale industrial complexes. Electrical system designers face mounting pressure to improve energy transmission efficiency and reduce installation footprint, with busbar solutions typically providing 95-98% transmission efficiency compared to traditional cable systems, making advanced busbars essential for modern power distribution applications. The electrical infrastructure industry's need for maximum current-carrying capacity and minimal voltage drop creates demand for advanced busbar solutions that can minimize power losses, enhance system reliability, and ensure consistent performance across diverse operational environments. Government initiatives promoting energy efficiency and electrical safety standards drive adoption in commercial, industrial, and renewable energy sectors, where busbar performance has a direct impact on system efficiency and operational costs. High copper and aluminum raw material costs and the complexity of achieving optimal installation across different electrical configurations may limit adoption rates among cost-sensitive projects and developing regions with limited technical infrastructure.
The market is segmented by product type, end use, and region. By product type, the market is divided into copper and aluminum. Based on end use, the market is categorized into commercial and industrial applications. Regionally, the market is divided into North America, Latin America, Western Europe, Eastern Europe, East Asia, South Asia and Pacific, and Middle East &Africa.
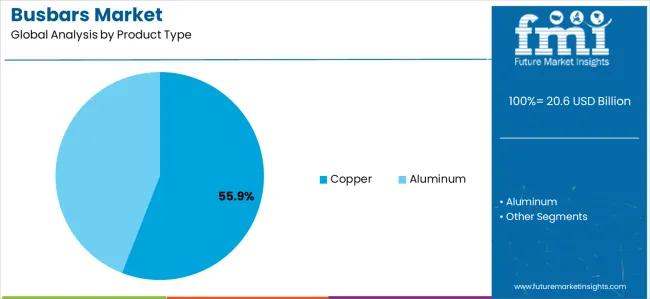
The copper segment represents the dominant force in the busbars market, capturing approximately 55.9% of total market share in 2025. This advanced material category encompasses busbar formulations featuring superior electrical conductivity characteristics, including enhanced current-carrying capacity and optimized performance combinations that enable superior transmission efficiency and enhanced operational durability characteristics. The copper segment's market leadership stems from its exceptional performance capabilities in high-current electrical applications, with busbars capable of delivering consistent power transmission while maintaining optimal electrical conductivity and thermal management across diverse installation environments.
The aluminum segment maintains a substantial market presence, serving applications that require cost-effective lightweight solutions for power distribution systems. These busbars offer reliable performance for moderate-current applications while providing sufficient conductivity to meet basic performance requirements in commercial building and light industrial electrical systems.
Key technological advantages driving the copper segment include:
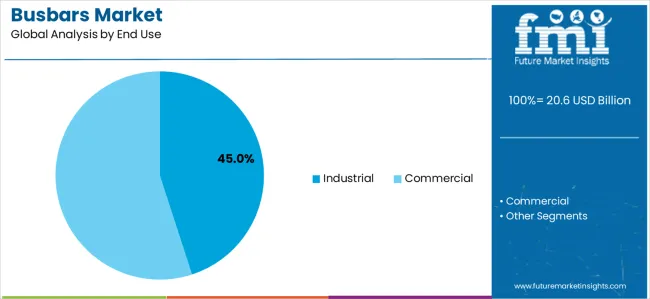
Industrial applications dominate the busbars market with significant market share in 2025, reflecting the critical role of heavy-duty power distribution systems in serving manufacturing demand and supporting large-scale industrial operations. The industrial segment's market leadership is reinforced by increasing industrial automation, standardized busbar designs for manufacturing applications, and rising demand for high-capacity electrical systems that directly correlate with operational efficiency and process reliability.
The metal &mining subsegment represents a major portion of industrial applications, capturing 35.6% market share through specialized requirements for high-power electrical systems, smelting operations, and heavy machinery power distribution. This subsegment benefits from growing demand for robust electrical infrastructure that meets stringent performance, reliability, and safety requirements in demanding mining and metallurgical applications.
Commercial applications account for substantial market share, serving office buildings, data centers, and commercial facilities requiring efficient power distribution solutions.
Key market dynamics supporting end use growth include:
The market is driven by three concrete demand factors tied to electrical infrastructure and industrial modernization outcomes. First, global electricity demand growth and power infrastructure expansion create increasing demand for high-efficiency power distribution solutions, with global energy consumption projected to increase significantly by 2030, requiring specialized busbar solutions for maximum transmission efficiency and system reliability. Second, renewable energy sector expansion and smart grid modernization drive the adoption of advanced electrical infrastructure technologies, with utilities and industrial facilities seeking improved power distribution efficiency and grid integration capabilities. Third, technological advancements in conductor materials and electrical design enable more effective and efficient busbar solutions that reduce installation complexity while improving long-term performance and operational reliability.
Market restraints include raw material price volatility, particularly copper and aluminum costs, that can impact product pricing and project economics, especially during periods of commodity market fluctuations affecting electrical infrastructure investment decisions. High initial investment costs pose another significant challenge, as advanced busbar systems require specialized installation expertise and comprehensive electrical system design, potentially causing project delays and increased implementation expenses. Installation complexity and electrical code compliance requirements create additional obstacles for project developers, demanding ongoing investment in technical capabilities and adherence to varying electrical safety standards and regional regulations.
Key trends indicate accelerated adoption in emerging markets, particularly China, India, and Southeast Asia, where rapid industrialization and electrical infrastructure development drive comprehensive power distribution system expansion. Technology advancement trends toward smart integration with enhanced monitoring capabilities, predictive maintenance systems, and automated electrical management enable next-generation busbar development that addresses multiple operational requirements simultaneously. The market thesis could face disruption if alternative power distribution technologies or significant changes in electrical system design minimize reliance on traditional busbar solutions.
| Country | CAGR (2025-2035) |
|---|---|
| China | 4.9% |
| India | 4% |
| United States | 3.3% |
| France | 2.8% |
| Germany | 1.2% |
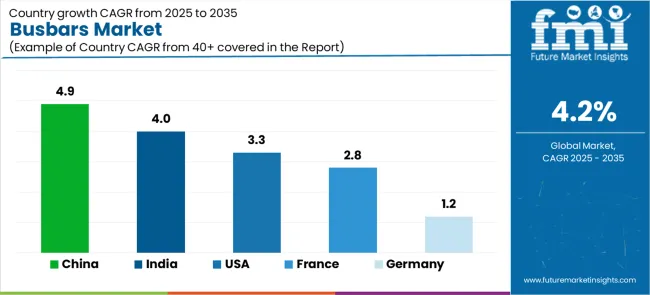
The busbars market is gaining momentum worldwide, with China taking the lead thanks to massive industrial expansion and government-backed infrastructure modernization programs. Close behind, India benefits from growing electrical infrastructure development and manufacturing sector expansion, positioning itself as a strategic growth hub in the South Asia Pacific region. The United States shows steady advancement, where smart grid modernization and data center expansion strengthen its role in the North American electrical infrastructure supply chains. France demonstrates consistent growth through nuclear energy infrastructure and industrial facility modernization, signaling strong commitment to electrical system upgrades in European markets. Meanwhile, Germany maintains stable development through energy efficiency regulations and industrial automation, recording steady progress in advanced electrical technology adoption. Together, China and India anchor the global expansion story, while the United States, France, and Germany build stability and technological advancement into the market's growth path.
The report covers an in-depth analysis of 40+ countries;5 top-performing countries are highlighted below.
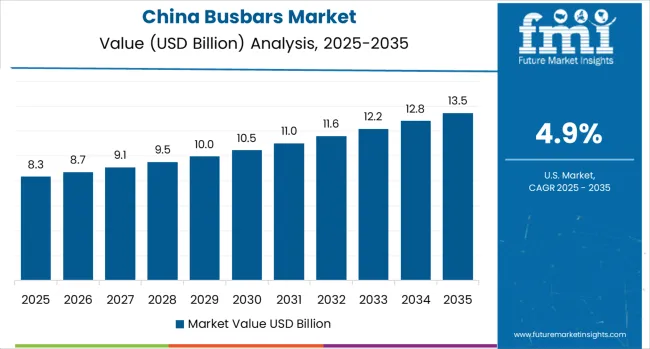
China demonstrates the strongest growth potential in the Busbars Market with a CAGR of 4.9% through 2035. The country's leadership position stems from massive industrial expansion projects, government-backed infrastructure development programs, and aggressive manufacturing modernization targets, driving the adoption of high-performance electrical distribution systems. Growth is concentrated in major industrial regions, including Guangdong, Jiangsu, Zhejiang, and Shandong, where manufacturing facilities and power generation companies are implementing advanced busbar solutions for enhanced electrical performance and operational efficiency. Distribution channels through established electrical equipment suppliers and direct manufacturer relationships expand deployment across industrial facilities and power generation centers. The country's infrastructure development strategy provides policy support for advanced electrical system development, including high-performance busbar adoption.
Key market factors:
In Mumbai, Delhi, Bangalore, and Chennai, the adoption of busbar systems is accelerating across industrial facilities and commercial buildings, driven by electrical infrastructure targets and government industrial development initiatives. The market demonstrates strong growth momentum with a CAGR of 4% through 2035, linked to comprehensive industrial capacity expansion and increasing focus on electrical system efficiency solutions. Indian manufacturers and facility operators are implementing advanced busbar systems and power management platforms to enhance operational performance while meeting growing demand for reliable electrical distribution in domestic and industrial markets. The country's infrastructure development programs create continued demand for high-performance electrical solutions, while increasing emphasis on energy efficiency drives adoption of advanced busbar technologies and electrical systems.
The United States market expansion is driven by diverse electrical demand, including data center operations in Virginia and California regions, smart grid development in Texas and the Midwest, and comprehensive electrical infrastructure modernization across multiple industrial areas. The country demonstrates steady growth potential with a CAGR of 3.3% through 2035, supported by federal infrastructure programs and regional electrical development initiatives. American facility operators face implementation challenges related to electrical code compliance and technical expertise availability, requiring busbar upgrade approaches and technology partnership support. Growing energy efficiency targets and electrical reliability requirements create compelling business cases for busbar system adoption, particularly in industrial regions where electrical performance has a direct impact on operational efficiency.
Market characteristics:
France demonstrates steady growth potential in the Busbars Market with a CAGR of 2.8% through 2035. The country's market expansion stems from nuclear energy infrastructure modernization, industrial facility upgrades, and comprehensive electrical system development programs, driving the adoption of high-performance electrical distribution systems. Growth is concentrated in major industrial regions, including Île-de-France, Auvergne-Rhône-Alpes, Hauts-de-France, and Nouvelle-Aquitaine, where power generation facilities and industrial manufacturers are implementing advanced busbar solutions for enhanced electrical reliability and operational efficiency. Distribution channels through established electrical equipment suppliers and direct manufacturer relationships expand deployment across nuclear facilities, industrial plants, and commercial buildings. The country's energy transition strategy provides policy support for advanced electrical infrastructure development, including high-efficiency busbar system adoption.
Key market characteristics:
Germany's market leads in advanced electrical innovation based on integration with next-generation industrial technologies and sophisticated automation applications for enhanced electrical characteristics. The country shows stable potential with a CAGR of 1.2% through 2035, driven by energy efficiency modernization programs and advanced manufacturing initiatives across major industrial regions, including Bavaria, Baden-Württemberg, North Rhine-Westphalia, and Lower Saxony. German manufacturers are adopting advanced busbar systems for operational optimization and regulatory compliance, particularly in regions with precision manufacturing requirements and advanced processing facilities requiring superior electrical performance. Technology deployment channels through established equipment distributors and direct manufacturer relationships expand coverage across industrial facilities and commercial buildings.
Leading market segments:
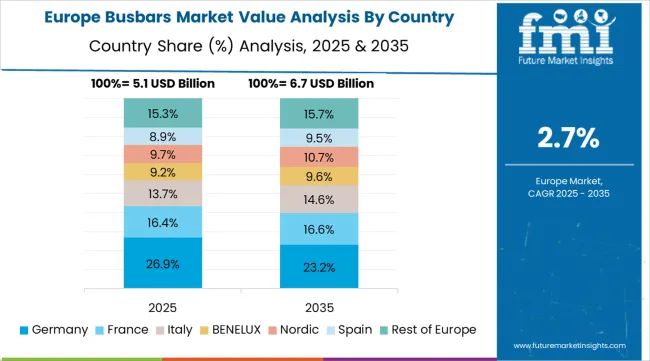
The busbars market in Europe is projected to grow from USD 4.8 billion in 2025 to USD 6.9 billion by 2035, registering a CAGR of 3.7% over the forecast period. Germany is expected to maintain its leadership position with a 26.8% market share in 2025, declining slightly to 26.4% by 2035, supported by its extensive industrial manufacturing infrastructure and major electrical centers, including Bavaria, Baden-Württemberg, and North Rhine-Westphalia electrical facilities.
France follows with a 18.6% share in 2025, projected to reach 18.9% by 2035, driven by comprehensive industrial development programs and electrical infrastructure initiatives implementing busbar technologies. The United Kingdom holds a 16.4% share in 2025, expected to maintain 16.2% by 2035 through ongoing electrical system upgrades and commercial building modernization. Italy commands a 14.7% share, while Spain accounts for 12.1% in 2025. The Rest of Europe region is anticipated to gain momentum, expanding its collective share from 11.4% to 12.6% by 2035, attributed to increasing busbar adoption in Nordic countries and emerging Eastern European industrial facilities implementing advanced electrical systems.
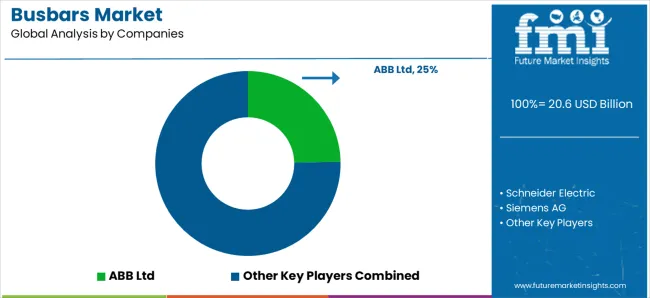
The busbars market features approximately 8-10 meaningful players with moderate to high concentration, where the top three companies control roughly 55-60% of global market share through established technology platforms and extensive electrical equipment relationships. Competition centers on technological innovation, electrical performance, and comprehensive service offerings rather than price competition alone.
Market leaders include ABB Ltd, Schneider Electric, and Siemens AG, which maintain competitive advantages through comprehensive electrical solution portfolios, global manufacturing networks, and deep expertise in the power distribution and industrial automation sectors, creating high switching costs for customers. These companies leverage research and development capabilities and ongoing technical support relationships to defend market positions while expanding into adjacent electrical applications and emerging markets.
Challengers encompass Legrand and Eaton Corporation, which compete through specialized busbar solutions and strong regional presence in key electrical markets. Technology specialists, including General Electric, Wöhner GmbH &Co. KG, and Rittal GmbH &Co. KG, focus on specific busbar configurations or vertical applications, offering differentiated capabilities in electrical design, customization services, and specialized performance characteristics.
Regional players and emerging electrical providers create competitive pressure through cost-effective solutions and rapid customization capabilities, particularly in high-growth markets including China, India, and Southeast Asia, where local presence provides advantages in customer service and technical support. Market dynamics favor companies that combine advanced electrical technologies with comprehensive service offerings that address the complete system lifecycle from design development through ongoing operational optimization.
Busbars represent specialized electrical infrastructure that enable facility operators to achieve 95-98% transmission efficiency compared to traditional cable systems, delivering superior current-carrying capacity and space optimization with enhanced electrical safety capabilities in demanding power distribution applications. With the market projected to grow from USD 20.6 billion in 2025 to USD 31.1 billion by 2035 at a 4.2% CAGR, these electrical systems offer compelling advantages - enhanced power efficiency, customizable current ratings, and operational reliability - making them essential for industrial manufacturing applications, commercial building operations, and power generation facilities seeking alternatives to inefficient cable systems that compromise performance through excessive power losses. Scaling market adoption and technological advancement requires coordinated action across electrical policy, safety standards development, busbar manufacturers, electrical industries, and power infrastructure investment capital.
How Suppliers Could Navigate the Shift?
| Items | Values |
|---|---|
| Quantitative Units | USD 20.6 billion |
| Product Type | Copper, Aluminum |
| End Use | Commercial, Industrial (including Metal &Mining, Chemical, Food &Beverage, Others) |
| Regions Covered | North America, Latin America, Western Europe, Eastern Europe, East Asia, South Asia and Pacific, Middle East &Africa |
| Country Covered | China, India, United States, Germany, and 40+ countries |
| Key Companies Profiled | ABB Ltd, Schneider Electric, Siemens AG, Legrand, Eaton Corporation, General Electric, Wöhner GmbH &Co. KG, Rittal GmbH &Co. KG, Mersen, C&S Electric |
| Additional Attributes | Dollar sales by product type and end use categories, regional adoption trends across East Asia, North America, and Western Europe, competitive landscape with electrical equipment providers and technology integrators, facility requirements and specifications, integration with industrial automation and power generation systems. |
The global busbars market is estimated to be valued at USD 20.6 billion in 2025.
The market size for the busbars market is projected to reach USD 31.1 billion by 2035.
The busbars market is expected to grow at a 4.2% CAGR between 2025 and 2035.
The key product types in busbars market are copper and aluminum.
In terms of end use, industrial segment to command 45.0% share in the busbars market in 2025.


Full Research Suite comprises of:
Market outlook & trends analysis
Interviews & case studies
Strategic recommendations
Vendor profiles & capabilities analysis
5-year forecasts
8 regions and 60+ country-level data splits
Market segment data splits
12 months of continuous data updates
DELIVERED AS:
PDF EXCEL ONLINE

Thank you!
You will receive an email from our Business Development Manager. Please be sure to check your SPAM/JUNK folder too.
Chat With
MaRIA