Cafix Market Size, Share, and Forecast Outlook 2025 to 2035

In 2025, the global cafix market is valued at USD 856.1 million and is likely to reach USD 1,462.4 million by 2035, expanding at a CAGR of 5.5%. This growth is fueled by increasing consumer preference for healthier, caffeine-free alternatives to traditional coffee.
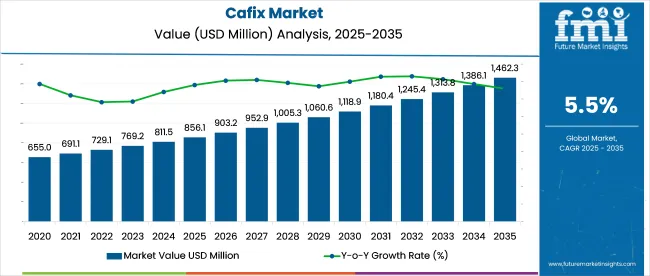
Quick Stats of Cafix Market

  • Market Value (2025): USD 856.1 million
  • Forecast Value (2035): USD 1,462.4 million
  • Forecast CAGR (2025 to 2035): 5.5%
  • Product Leader (2025): Powdered Cafix (48.3% market share)
  • Top Distribution Channel: Supermarkets/Hypermarkets (34.8% market share)
  • Key Growth Region: North America (notably the United States with 5.5% CAGR and 52% online sales share)
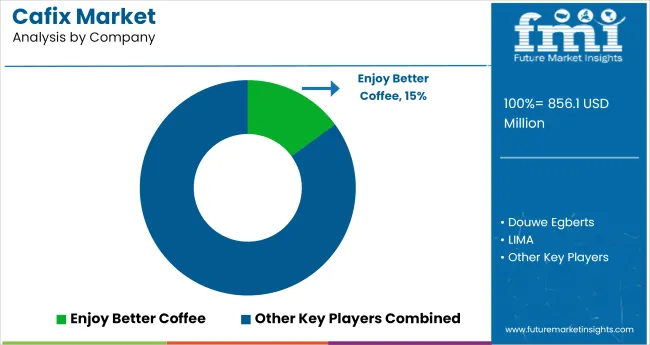
  • Leading Player: Enjoy Better Coffee 15%

Cafix Market Market Value Analysis

Attributes Description
Estimated Market Size (2025E) USD 856.1 million
Projected Market Value (2035F) USD 1,462.4 million
Value-based CAGR (2025 to 2035) 5.5%

Made from roasted barley, chicory, and natural ingredients, cafix offers a rich flavor without artificial additives, aligning with the shift toward clean-label, plant-based beverages. The increasing preference for functional ingredients like prebiotic-rich chicory root further boosts its popularity.

The cafix market draws its strength from several overlapping sectors. The coffee substitutes market forms the largest base, contributing approximately 40-45%, as cafix directly competes with caffeine-free alternatives like chicory blends and roasted grain beverages. The health and wellness beverages segment accounts for around 25-30%, supported by consumer interest in non-stimulant, stomach-friendly drinks.

The natural and organic products market contributes roughly 10-12%, as cafix aligns with clean-label, non-GMO, and plant-based preferences. Around 8-10% comes from the functional foods and beverages category, where cafix is chosen for its perceived digestive and energy-balancing benefits. The remaining 5-7% stems from the dietary and lifestyle-specific segment, appealing to individuals on vegan, low-acid, or gluten-sensitive diets seeking coffee alternatives.

In April 2025, John Smith, CEO of Cafix, emphasized the company’s commitment to offering “high-quality, caffeine-free alternatives that don’t compromise on taste.” Speaking during the Global Wellness Beverages Summit, Smith framed Cafix’s mission as a response to growing global demand for healthier beverage options.

With its lineup of roasted barley-based drinks and natural herbal blends, cafix is positioned as a leading choice for consumers seeking satisfying coffee substitutes without the stimulant effects of caffeine. This strategy has bolstered cafix’s reach in the wellness market, contributing to a 13.2% year-over-year growth in the caffeine-free beverage segment across North America and Europe.

Analyzing Cafix Market by Top Investment Segments

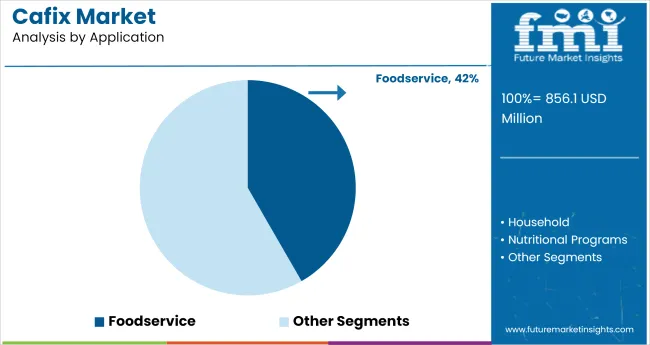
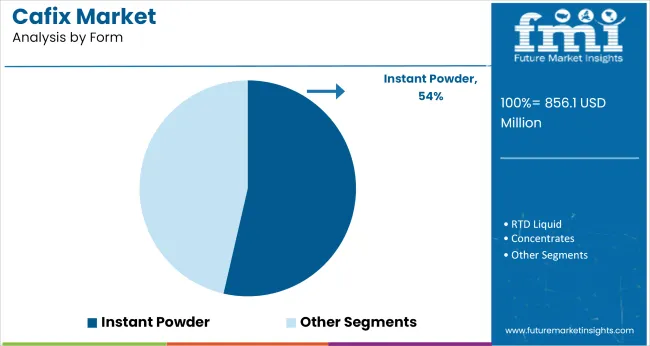
The cafix market in 2025 is led by powdered cafix (48.3%), foodservice applications (41.7%), and instant powder forms (53.6%). A surge in demand for caffeine-free alternatives and digestive wellness drinks is fueling growth across multiple verticals. Clean-label and organic claims further enhance consumer trust and brand loyalty across both retail and service sectors.
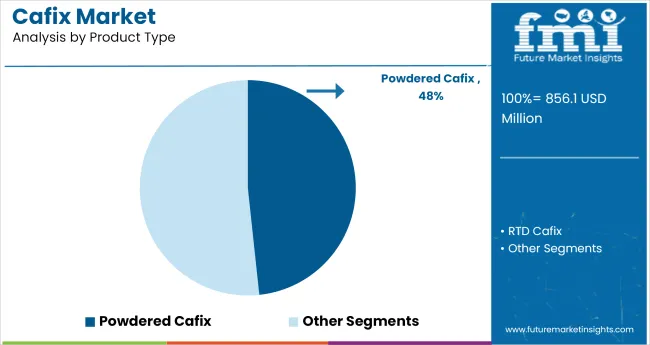
Powdered Cafix Fuels Demand in Product Type Segment for 2025

Cafix Market Analysis By Product Type

Powdered cafix holds the largest product share in 2025 at 48.3%, driven by its high solubility and preparation speed. Its dry format enables long shelf stability, making it ideal for bulk buyers and single-cup users alike. Used extensively in both household kitchens and foodservice settings, powdered cafix is popular for delivering a roasted flavor profile without caffeine. Key players such as Inka, Pero, and CaféCafix have optimized packaging and flavor variations to boost sales across global markets.
  • Powdered cafix is preferred by consumers prioritizing hot-beverage readiness.
  • Institutional buyers select powder for efficient batch servings and portion control.
  • Packaged powdered cafix is increasingly stocked in organic and bulk sections.

Foodservice Application Likely to Dominate by 41.7% Market Share in 2025

Cafix Market Analysis By Application

The foodservice segment is projected to lead in 2025, accounting for 41.7% of the cafix market due to high adoption in cafés, hotels, and corporate dining setups. Restaurants and quick-serve cafés incorporate cafix into caffeine-free espresso alternatives, contributing to higher menu differentiation. Brands such as Mount Hagen, Teeccino, and cafix Original are building strong B2B channels focused on product reliability and batch scalability.
  • Menu diversification in plant-based cafés includes lattes and herbal brews.
  • Foodservice buyers value cafix for accommodating dietary-sensitive customers.
  • Chain cafés incorporate powdered cafix into morning and detox menus.

Instant Powder Form Takes the Lead Among Form Segments in 2025

Cafix Market Analysis By Form

Instant powder form captures the largest share by form at 53.6% in 2025. This segment benefits from user-friendly packaging, fast preparation, and broad accessibility across demographics. Whether for home use or institutional kitchens, instant cafix is chosen for its ease of storage and consistent quality. Brands like Carob Coffee, Cafix, and Pero Instant dominate this category with single-serve sachets and refill jars designed for regular consumption.
  • Instant powder leads due to convenience in travel, hospitals, and offices.
  • The sachets gain traction in wellness retreats and detox programs.
  • Large-format instant jars dominate supermarket and family-size retail shelves.

Digestive Wellness Beverages Drive Growth by Functionality in 2025

Cafix Market Analysis By Product Claim

Digestive wellness accounts for an estimated 39.2% share of the cafix market in 2025, supported by growing consumer awareness of gut health and prebiotic-rich diets. Made from chicory, carob, and barley-known digestive aids-cafix products appeal to those seeking a functional, caffeine-free beverage. Companies such as Dandy Blend, Bueno Coffee Substitute, and Cafix Natural Blend focus their marketing on digestive support, targeting wellness-focused and older consumer groups.

  • Prebiotic content in chicory attracts gut health-conscious consumers.
  • cafix is integrated into fiber-enhanced diets and post-meal routines.
  • Fitness and nutrition coaches promote digestive cafix over carbonated drinks.

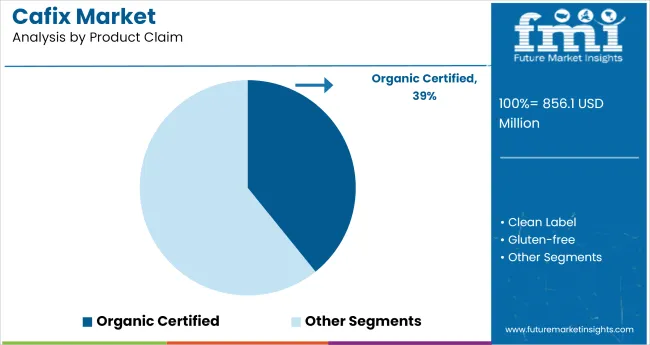
Organic Certified Cafix Leads Product Claim Preferences in 2025

Organic certified leads the product claim segment with an estimated 36.5% market share in 2025. Consumers increasingly demand transparency and purity, pushing brands to prioritize USDA organic and EU Bio certifications. Companies like Whole Earth, Nature’s Path, and Teeccino leverage their organic identity to gain placement in premium stores and subscription health boxes.

  • Organic cafix is favored in vegan, allergy-conscious, and detox regimens.
  • Retailers bundle organic cafix with other wellness and gluten-free products.
  • Subscription-based retailers list organic cafix under monthly clean-label picks.

Top Cafix Market Dynamics

Cafix is gaining ground due to rising interest in clean, caffeine-free drinks. Growth is driven by North American demand and e-commerce expansion, the manufacturers navigate cost instability, supply constraints, and low global awareness. Market success hinges on formulation agility, efficient logistics, and wider brand education in underpenetrated regions.

Data Trends Defining Cafix Growth

The market recorded a 6.3% rise in global revenue in 2024, reaching an estimated valuation of USD 98 million. North America contributed 42% of total sales, with the USA leading retail volume. E-commerce distribution grew by 18%, driven by a 23% increase in health-food category searches.

The 30-55 age group represented 64% of repeat purchases. Product variants labeled gluten-free or non-GMO saw 27% faster shelf turnover. Chicory and barley-based blends accounted for over 70% of all SKUs launched between Q1-Q2 2024, as consumers increasingly preferred clean-label profiles with functional ingredients.

Measurable Impacts on Production

Chicory prices surged 12% year-on-year due to inconsistent harvest yields in key European regions. Shipping delays extended average lead times from 21 to 34 days. Label compliance costs rose 9.5% due to stricter ingredient disclosures in the EU and USA A 15% increase in small-brand entries intensified competition in the caffeine-free category, driving promotional expenses up by 11%.

Only 28% of surveyed consumers in Asia-Pacific recognized cafix by brand name, underscoring a limited global footprint. Profit margins shrank by 4.2% across mid-size producers, largely tied to packaging cost hikes and reduced volume discounts on raw materials.

Top Countries Involved in Producing, Packaging, Supplying, and Purchasing Cafix (2025 to 2035)

Country CAGR (2025 to 2035)
United States 5.5%
Germany 5.3%
United Kingdom 5.2%
Canada 5.4%
Australia 5.1%

The Global industry is expected to expand at a 5.5% CAGR from 2025 to 2035. Among the featured countries, the United States matches the global rate at 5.5%, while Canada follows at 5.4%, Germany at 5.3%, the United Kingdom at 5.2%, and Australia at 5.1%. This translates to a 0% deviation for the USA, -2% for Canada, -4% for Germany, -5% for the UK, and -7% for Australia, compared to the global baseline.

These figures reflect steady demand for caffeine-free beverage alternatives across mature markets. As OECD members, these countries show consistent growth, shaped by shifts toward non-coffee hot drinks, expanding retail availability, and health-oriented product choices.

The report covers detailed analysis of 40+ countries, with the top five countries shared as a reference

Rising Preference for Caffeine-Free Alternatives Drives Cafix Demand in the United States

The cafix market in the United States is projected to expand at a 5.5% CAGR from 2025 to 2035. The market is driven by a growing consumer base seeking caffeine-free hot beverage alternatives. Primarily made from roasted barley, chicory, and sugar beet, appeals to health-conscious Americans moving away from conventional coffee. Increased demand for gut-friendly and low-acid drinks has created niche opportunities. E-commerce contributes over 52% of total sales as health brands optimize digital visibility.

  • 52% of sales in 2025 came from online grocery and wellness platforms
  • Chicory-barley blends saw a 39% YoY rise in repeat orders among coffee-switchers
  • Cafix brands with USDA Organic and Non-GMO tags contributed to 61% of retail shelf presence

Ingredient Clarity and Non-Coffee Rituals Power Cafix Market in Germany

The market in Germany is expanding at 5.3% CAGR, supported by consumers actively limiting caffeine intake. Brands offering heritage-rich blends made from rye, fig, and chicory are capturing attention in organic retail chains like Alnatura, Reformhaus, and Bio Company. In 2025, over 68% of drinkers identified as regular herbal tea or alternative brew consumers. The wellness community gravitates toward low-acid, caffeine-free formats for digestive comfort and daily ritual consistency.

  • 42% of sales in Germany are linked to organic-certified herbal coffee alternatives
  • Local German brands dominate, with 57% market share captured by domestic manufacturers
  • Functional flavor infusions such as fennel-cardamom and cinnamon-barley saw 21% YoY growth

United Kingdom’s Cafix Market Grows with Demand for Low-Caffeine Digestive Brews

At a 5.2% CAGR, the market in United Kingdom is seeing higher uptake among consumers shifting to caffeine-free digestion-friendly beverages. The product's positioning as a coffee alternative for post-lunch or evening use has gained traction. Retailers such as Holland & Barrett and Planet Organic are leading.

Demand is particularly pronounced among women aged 35-55 and individuals with acid sensitivity or caffeine intolerance. Local adaptations with oat or roasted dandelion root are becoming frequent in new product development. The product’s presence in subscription wellness boxes has also driven trial and brand familiarity.

  • The consumption increased by 46% among consumers seeking caffeine-free evening drinks
  • Over 54% of brands now include dandelion root or oat fiber to support digestive marketing
  • Subscription-based cafix discovery kits expanded 33% YoY in direct-to-consumer channels

Natural Roast Blends Shape Cafix Market Preferences in Canada

The market in Canada is set to grow at 5.4% CAGR, driven by plant-based beverage trends and low-acid lifestyle adoption. Consumers are looking for warm drinks that replicate the aroma and roastiness of coffee without the side effects. Chicory, carob, and barley-based cafix variants are selling particularly well in Quebec and Ontario provinces. National chains like Whole Foods Canada and Nature’s Fare Markets are among the top distributors.

  • 64% of cafix sales in Canada came from health food stores and organic co-ops in 2025
  • New Canadian brands offered six new regional SKUs, focusing on carob and maple fusions
  • The sales spiked 22% during Q1 and Q4, aligning with seasonal caffeine detox habits

Australia’s Cafix Market Growth Supported by Wellness-Centric Beverage Culture

Australia is registering 5.1% CAGR in the industry, with major demand centered around caffeine-sensitive consumers in urban areas like Sydney and Melbourne. Interest in caffeine-free, low-acid hot beverages has paralleled the rise in plant-based and functional food consumption. Brands are leveraging roasted dandelion, carob, and chicory in blends to meet preferences for digestive comfort and herbal functionality.
  • 48% of product trials occurred via wellness cafés and tea houses offering free samplers
  • Functional cafix blends with rooibos, turmeric, and cinnamon increased 31% in new launches
  • Retail stores witnessed 18% faster turnover in cafix SKUs with native Australian ingredients

Leading Cafix Manufacturers, Suppliers, Distributors

Cafix Market Analysis By Company

In 2025, The industry is witnessing rapid competitive growth due to rising demand for caffeine-free and health-driven beverages. Brands such as LIMA, Enjoy Better Coffee, and World Finer Foods are expanding globally through multi-channel distribution. The innovative entrants like DateSeedCoffee.com and Phi Drinks Inc. are targeting niche segments with clean-label, plant-based alternatives.

With a shift toward eco-conscious manufacturing and natural wellness ingredients, leading companies are refining product strategies to meet evolving consumer needs. The competition is intensifying, driven by digital marketing, retail partnerships, and functional health positioning.

Recent Industry News

  • In Q1 2024, MudWtr launched a cold-brew herbal concentrate designed for faster preparation and stronger flavor retention, catering to convenience-focused consumers. Meanwhile, DateSeedCoffee.com introduced a low-temperature roast profiling method that boosts antioxidant levels in date-seed blends.
  • By mid-2024, Unilever Plc acquired stakes in two caffeine-free beverage startups, strengthening its herbal product portfolio. At the same time, Phi Drinks Inc. rolled out a patent-pending micro-extraction process to enhance aroma and extend shelf life in its roasted blends.

Leading Players

  • Enjoy Better Coffee
  • Douwe Egberts
  • LIMA
  • DateSeedCoffee.com
  • World Finer Foods
  • Unilever Plc.
  • Rasa Inc.
  • Som Sleep
  • MudWtr
  • Dandy Blend
  • Phi Drinks Inc.
  • Clearspring

Report Scope

Report Attributes Details
Market Size (2025) USD 856.1 million
Projected Market Size (2035) USD 1,462.4 million
CAGR (2025 to 2035) 5.5%
Base Year for Estimation 2024
Historical Period 2020 to 2024
Projection Period 2025 to 2035
Quantitative Units USD million for value
Types Analyzed (Segment 1) Organic White Rice Flour, Organic Brown Rice Flour
End Use Industries Analyzed (Segment 2) Bakery, Sauces and Dressings, Baby Food, Snacks, Meat-Based Products, Processed Food, Food Service Industry, Household, Others
Distribution Channels Analyzed (Segment 3) Supermarkets/Hypermarkets, Convenience Stores, Departmental Stores, Specialty Stores, Online Retail
Regions Covered North America, Latin America, Western Europe, Eastern Europe, South Asia & Pacific, East Asia, Central Asia, Balkan and Baltic Countries, Russia & Belarus, Middle East & Africa
Countries Covered United States, Canada, Mexico, Brazil, Argentina, Chile, Germany, France, United Kingdom, Italy, Spain, Poland, Russia, Czech Republic, India, Indonesia, Australia, New Zealand, China, Japan, South Korea, Kazakhstan, Uzbekistan, Romania, Bulgaria, Lithuania, Latvia, Estonia, Belarus, South Africa, United Arab Emirates, Saudi Arabia, Egypt, Nigeria
Key Players Enjoy Better Coffee, Douwe Egberts, LIMA, DateSeedCoffee.com, World Finer Foods, Unilever Plc., Rasa Inc., Som Sleep, MudWtr, Dandy Blend, Phi Drinks Inc., Clearspring
Additional Attributes Dollar sales distribution by end use and channel; rising consumer preference for caffeine alternatives; demand concentrated in North America and Europe; growing adoption in household and food service sectors; organic segment gaining rapid traction

Key Segments of the Report

By Product Type:

  • Powdered Cafix
  • RTD Cafix
  • Granular Cafix

By Application:

  • Foodservice
  • Household/Residential
  • Nutritional Programs

By Sales Channel:

  • Supermarkets/Hypermarkets
  • Health Food Stores
  • Online Retail
  • Specialty Cafés
  • Discount Stores

By Form:

  • Instant Powder
  • RTD Liquid
  • Concentrates
  • Functionality
    • Digestive Wellness
    • Caffeine-free Stimulation
    • Detoxification Support

By Product Claim:

  • Organic Certified
  • Clean Label
  • Gluten-free
  • Vegan

By Region:

  • North America
  • Latin America
  • East Asia
  • South Asia & Pacific
  • Eastern Europe
  • Western Europe
  • Middle East & Africa

Table of Content

  1. Executive Summary
    • Global Market Outlook
    • Demand-side Trends
    • Supply-side Trends
    • Technology Roadmap Analysis
    • Analysis and Recommendations
  2. Market Overview
    • Market Coverage / Taxonomy
    • Market Definition / Scope / Limitations
  3. Market Background
    • Market Dynamics
      • Drivers
      • Restraints
      • Opportunity
      • Trends
    • Scenario Forecast
      • Demand in Optimistic Scenario
      • Demand in Likely Scenario
      • Demand in Conservative Scenario
    • Opportunity Map Analysis
    • Product Life Cycle Analysis
    • Supply Chain Analysis
      • Supply Side Participants and their Roles
        • Producers
        • Mid-Level Participants (Traders/ Agents/ Brokers)
        • Wholesalers and Distributors
      • Value Added and Value Created at Node in the Supply Chain
      • List of Raw Material Suppliers
      • List of Existing and Potential Buyer’s
    • Investment Feasibility Matrix
    • Value Chain Analysis
      • Profit Margin Analysis
      • Wholesalers and Distributors
      • Retailers
    • PESTLE and Porter’s Analysis
    • Regulatory Landscape
      • By Key Regions
      • By Key Countries
    • Regional Parent Market Outlook
    • Production and Consumption Statistics
    • Import and Export Statistics
  4. Global Market Analysis 2020 to 2024 and Forecast, 2025 to 2035
    • Historical Market Size Value (USD Billion) & Volume (MT) Analysis, 2020 to 2024
    • Current and Future Market Size Value (USD Billion) & Volume (MT) Projections, 2025 to 2035
      • Y-o-Y Growth Trend Analysis
      • Absolute $ Opportunity Analysis
  5. Global Market Pricing Analysis 2020 to 2024 and Forecast 2025 to 2035
  6. Global Market Analysis 2020 to 2024 and Forecast 2025 to 2035, By Product Type
    • Introduction / Key Findings
    • Historical Market Size Value (USD Billion) & Volume (MT) Analysis By Product Type, 2020 to 2024
    • Current and Future Market Size Value (USD Billion) & Volume (MT) Analysis and Forecast By Product Type, 2025 to 2035
      • Powdered Cafix
      • RTD Cafix
      • Granular Cafix
    • Y-o-Y Growth Trend Analysis By Product Type, 2020 to 2024
    • Absolute $ Opportunity Analysis By Product Type, 2025 to 2035
  7. Global Market Analysis 2020 to 2024 and Forecast 2025 to 2035, By Application
    • Introduction / Key Findings
    • Historical Market Size Value (USD Billion) & Volume (MT) Analysis By Application, 2020 to 2024
    • Current and Future Market Size Value (USD Billion) & Volume (MT) Analysis and Forecast By Application, 2025 to 2035
      • Foodservice
      • Household/Residential
      • Nutritional Programs
      • Sales Channel
        • Supermarkets/Hypermarkets
        • Health Food Stores
        • Online Retail
        • Specialty Cafés
        • Discount Stores
    • Y-o-Y Growth Trend Analysis By Application, 2020 to 2024
    • Absolute $ Opportunity Analysis By Application, 2025 to 2035
  8. Global Market Analysis 2020 to 2024 and Forecast 2025 to 2035, By Form
    • Introduction / Key Findings
    • Historical Market Size Value (USD Billion) & Volume (MT) Analysis By Form, 2020 to 2024
    • Current and Future Market Size Value (USD Billion) & Volume (MT) Analysis and Forecast By Form, 2025 to 2035
      • Instant Powder
      • RTD Liquid
      • Concentrates
      • Functionality
        • Digestive Wellness
        • Caffeine-free Stimulation
        • Detoxification Support
      • Energy & Power
      • Others
    • Y-o-Y Growth Trend Analysis By Form, 2020 to 2024
    • Absolute $ Opportunity Analysis By Form, 2025 to 2035
  9. Global Market Analysis 2020 to 2024 and Forecast 2025 to 2035, By Product Claim
    • Introduction / Key Findings
    • Historical Market Size Value (USD Billion) & Volume (MT) Analysis By Product Claim, 2020 to 2024
    • Current and Future Market Size Value (USD Billion) & Volume (MT) Analysis and Forecast By Product Claim, 2025 to 2035
      • Organic Certified
      • Clean Label
      • Gluten-free
      • Vegan
    • Y-o-Y Growth Trend Analysis By Product Claim, 2020 to 2024
    • Absolute $ Opportunity Analysis By Product Claim, 2025 to 2035
  10. Global Market Analysis 2020 to 2024 and Forecast 2025 to 2035, By Region
    • Introduction
    • Historical Market Size Value (USD Billion) & Volume (MT) Analysis By Region, 2020 to 2024
    • Current Market Size Value (USD Billion) & Volume (MT) Analysis and Forecast By Region, 2025 to 2035
      • North America
      • Latin America
      • Western Europe
      • Eastern Europe
      • East Asia
      • South Asia & Pacific
      • Middle East and Africa
    • Market Attractiveness Analysis By Region
  11. North America Market Analysis 2020 to 2024 and Forecast 2025 to 2035, By Country
    • Historical Market Size Value (USD Billion) & Volume (MT) Trend Analysis By Market Taxonomy, 2020 to 2024
    • Market Size Value (USD Billion) & Volume (MT) Forecast By Market Taxonomy, 2025 to 2035
      • By Country
        • USA
        • Canada
        • Mexico
      • By Product Type
      • By Application
      • By Form
      • By Product Claim
    • Market Attractiveness Analysis
      • By Country
      • By Product Type
      • By Application
      • By Form
      • By Product Claim
    • Key Takeaways
  12. Latin America Market Analysis 2020 to 2024 and Forecast 2025 to 2035, By Country
    • Historical Market Size Value (USD Billion) & Volume (MT) Trend Analysis By Market Taxonomy, 2020 to 2024
    • Market Size Value (USD Billion) & Volume (MT) Forecast By Market Taxonomy, 2025 to 2035
      • By Country
        • Brazil
        • Argentina
        • Rest of LATAM
      • By Product Type
      • By Application
      • By Form
      • By Product Claim
    • Market Attractiveness Analysis
      • By Country
      • By Product Type
      • By Application
      • By Form
      • By Product Claim
    • Key Takeaways
  13. Western Europe Market Analysis 2020 to 2024 and Forecast 2025 to 2035, By Country
    • Historical Market Size Value (USD Billion) & Volume (MT) Trend Analysis By Market Taxonomy, 2020 to 2024
    • Market Size Value (USD Billion) & Volume (MT) Forecast By Market Taxonomy, 2025 to 2035
      • By Country
        • Germany
        • Italy
        • France
        • UK
        • Spain
        • BENELUX
        • Nordic
        • Rest of W.Europe
      • By Product Type
      • By Application
      • By Form
      • By Product Claim
    • Market Attractiveness Analysis
      • By Country
      • By Product Type
      • By Application
      • By Form
      • By Product Claim
    • Key Takeaways
  14. Eastern Europe Market Analysis 2020 to 2024 and Forecast 2025 to 2035, By Country
    • Historical Market Size Value (USD Billion) & Volume (MT) Trend Analysis By Market Taxonomy, 2020 to 2024
    • Market Size Value (USD Billion) & Volume (MT) Forecast By Market Taxonomy, 2025 to 2035
      • By Country
        • Russia
        • Hungary
        • Poland
        • Balkan & Baltics
        • Rest of E. Europe
      • By Product Type
      • By Application
      • By Form
      • By Product Claim
    • Market Attractiveness Analysis
      • By Country
      • By Product Type
      • By Application
      • By Form
      • By Product Claim
    • Key Takeaways
  15. East Asia Market Analysis 2020 to 2024 and Forecast 2025 to 2035, By Country
    • Historical Market Size Value (USD Billion) & Volume (MT) Trend Analysis By Market Taxonomy, 2020 to 2024
    • Market Size Value (USD Billion) & Volume (MT) Forecast By Market Taxonomy, 2025 to 2035
      • By Country
        • China
        • Japan
        • South Korea
      • By Product Type
      • By Application
      • By Form
      • By Product Claim
    • Market Attractiveness Analysis
      • By Country
      • By Product Type
      • By Application
      • By Form
      • By Product Claim
    • Key Takeaways
  16. South Asia & Pacific Market Analysis 2020 to 2024 and Forecast 2025 to 2035, By Country
    • Historical Market Size Value (USD Billion) & Volume (MT) Trend Analysis By Market Taxonomy, 2020 to 2024
    • Market Size Value (USD Billion) & Volume (MT) Forecast By Market Taxonomy, 2025 to 2035
      • By Country
        • India
        • Australia & New Zealand
        • ASEAN
        • Rest of SAP
      • By Product Type
      • By Application
      • By Form
      • By Product Claim
    • Market Attractiveness Analysis
      • By Country
      • By Product Type
      • By Application
      • By Form
      • By Product Claim
    • Key Takeaways
  17. Middle East and Africa Market Analysis 2020 to 2024 and Forecast 2025 to 2035, By Country
    • Historical Market Size Value (USD Billion) & Volume (MT) Trend Analysis By Market Taxonomy, 2020 to 2024
    • Market Size Value (USD Billion) & Volume (MT) Forecast By Market Taxonomy, 2025 to 2035
      • By Country
        • GCC Countries
        • Northern Africa
        • South Africa
        • Turkiye
        • Rest of MEA
      • By Product Type
      • By Application
      • By Form
      • By Product Claim
    • Market Attractiveness Analysis
      • By Country
      • By Product Type
      • By Application
      • By Form
      • By Product Claim
    • Key Takeaways
  18. Key Countries Market Analysis
    • USA
      • Pricing Analysis
      • Market Share Analysis, 2024
        • By Product Type
        • By Application
        • By Form
        • By Product Claim
    • Canada
      • Pricing Analysis
      • Market Share Analysis, 2024
        • By Product Type
        • By Application
        • By Form
        • By Product Claim
    • Brazil
      • Pricing Analysis
      • Market Share Analysis, 2024
        • By Product Type
        • By Application
        • By Form
        • By Product Claim
    • Mexico
      • Pricing Analysis
      • Market Share Analysis, 2024
        • By Product Type
        • By Application
        • By Form
        • By Product Claim
    • Argentina
      • Pricing Analysis
      • Market Share Analysis, 2024
        • By Product Type
        • By Application
        • By Form
        • By Product Claim
  19. Market Structure Analysis
    • Competition Dashboard
    • Competition Benchmarking
    • Market Share Analysis of Top Players
      • By Regional
      • By Product Type
      • By Application
      • By Form
      • By Product Claim
  20. Competition Analysis
    • Competition Deep Dive
      • Enjoy Better Coffee
        • Overview
        • Product Portfolio
        • Profitability by Market Segments (Product/Age /Sales Channel/Region)
        • Sales Footprint
        • Strategy Overview
          • Marketing Strategy
          • Product Strategy
          • Channel Strategy
      • Douwe Egberts
        • Overview
        • Product Portfolio
        • Profitability by Market Segments (Product/Age /Sales Channel/Region)
        • Sales Footprint
        • Strategy Overview
          • Marketing Strategy
          • Product Strategy
          • Channel Strategy
      • LIMA
        • Overview
        • Product Portfolio
        • Profitability by Market Segments (Product/Age /Sales Channel/Region)
        • Sales Footprint
        • Strategy Overview
          • Marketing Strategy
          • Product Strategy
          • Channel Strategy
      • DateSeedCoffee.com
        • Overview
        • Product Portfolio
        • Profitability by Market Segments (Product/Age /Sales Channel/Region)
        • Sales Footprint
        • Strategy Overview
          • Marketing Strategy
          • Product Strategy
          • Channel Strategy
      • World Finer Foods
        • Overview
        • Product Portfolio
        • Profitability by Market Segments (Product/Age /Sales Channel/Region)
        • Sales Footprint
        • Strategy Overview
          • Marketing Strategy
          • Product Strategy
          • Channel Strategy
      • Unilever Plc.
        • Overview
        • Product Portfolio
        • Profitability by Market Segments (Product/Age /Sales Channel/Region)
        • Sales Footprint
        • Strategy Overview
          • Marketing Strategy
          • Product Strategy
          • Channel Strategy
      • Rasa Inc.
        • Overview
        • Product Portfolio
        • Profitability by Market Segments (Product/Age /Sales Channel/Region)
        • Sales Footprint
        • Strategy Overview
          • Marketing Strategy
          • Product Strategy
          • Channel Strategy
      • Som Sleep
        • Overview
        • Product Portfolio
        • Profitability by Market Segments (Product/Age /Sales Channel/Region)
        • Sales Footprint
        • Strategy Overview
          • Marketing Strategy
          • Product Strategy
          • Channel Strategy
      • MudWtr
        • Overview
        • Product Portfolio
        • Profitability by Market Segments (Product/Age /Sales Channel/Region)
        • Sales Footprint
        • Strategy Overview
          • Marketing Strategy
          • Product Strategy
          • Channel Strategy
      • Dandy Blend
        • Overview
        • Product Portfolio
        • Profitability by Market Segments (Product/Age /Sales Channel/Region)
        • Sales Footprint
        • Strategy Overview
          • Marketing Strategy
          • Product Strategy
          • Channel Strategy
      • Phi Drinks Inc.
        • Overview
        • Product Portfolio
        • Profitability by Market Segments (Product/Age /Sales Channel/Region)
        • Sales Footprint
        • Strategy Overview
          • Marketing Strategy
          • Product Strategy
          • Channel Strategy
      • Clearspring
        • Overview
        • Product Portfolio
        • Profitability by Market Segments (Product/Age /Sales Channel/Region)
        • Sales Footprint
        • Strategy Overview
          • Marketing Strategy
          • Product Strategy
          • Channel Strategy
  21. Assumptions & Acronyms Used
  22. Research Methodology

List of Tables

  • Table 1: Global Market Value (USD Billion) Forecast by Region, 2020-2035
  • Table 2: Global Market Volume (MT) Forecast by Region, 2020-2035
  • Table 3: Global Market Value (USD Billion) Forecast by Product Type, 2020-2035
  • Table 4: Global Market Volume (MT) Forecast by Product Type, 2020-2035
  • Table 5: Global Market Value (USD Billion) Forecast by Application, 2020-2035
  • Table 6: Global Market Volume (MT) Forecast by Application, 2020-2035
  • Table 7: Global Market Value (USD Billion) Forecast by Form, 2020-2035
  • Table 8: Global Market Volume (MT) Forecast by Form, 2020-2035
  • Table 9: Global Market Value (USD Billion) Forecast by Product Claim, 2020-2035
  • Table 10: Global Market Volume (MT) Forecast by Product Claim, 2020-2035
  • Table 11: North America Market Value (USD Billion) Forecast by Country, 2020-2035
  • Table 12: North America Market Volume (MT) Forecast by Country, 2020-2035
  • Table 13: North America Market Value (USD Billion) Forecast by Product Type, 2020-2035
  • Table 14: North America Market Volume (MT) Forecast by Product Type, 2020-2035
  • Table 15: North America Market Value (USD Billion) Forecast by Application, 2020-2035
  • Table 16: North America Market Volume (MT) Forecast by Application, 2020-2035
  • Table 17: North America Market Value (USD Billion) Forecast by Form, 2020-2035
  • Table 18: North America Market Volume (MT) Forecast by Form, 2020-2035
  • Table 19: North America Market Value (USD Billion) Forecast by Product Claim, 2020-2035
  • Table 20: North America Market Volume (MT) Forecast by Product Claim, 2020-2035
  • Table 21: Latin America Market Value (USD Billion) Forecast by Country, 2020-2035
  • Table 22: Latin America Market Volume (MT) Forecast by Country, 2020-2035
  • Table 23: Latin America Market Value (USD Billion) Forecast by Product Type, 2020-2035
  • Table 24: Latin America Market Volume (MT) Forecast by Product Type, 2020-2035
  • Table 25: Latin America Market Value (USD Billion) Forecast by Application, 2020-2035
  • Table 26: Latin America Market Volume (MT) Forecast by Application, 2020-2035
  • Table 27: Latin America Market Value (USD Billion) Forecast by Form, 2020-2035
  • Table 28: Latin America Market Volume (MT) Forecast by Form, 2020-2035
  • Table 29: Latin America Market Value (USD Billion) Forecast by Product Claim, 2020-2035
  • Table 30: Latin America Market Volume (MT) Forecast by Product Claim, 2020-2035
  • Table 31: Western Europe Market Value (USD Billion) Forecast by Country, 2020-2035
  • Table 32: Western Europe Market Volume (MT) Forecast by Country, 2020-2035
  • Table 33: Western Europe Market Value (USD Billion) Forecast by Product Type, 2020-2035
  • Table 34: Western Europe Market Volume (MT) Forecast by Product Type, 2020-2035
  • Table 35: Western Europe Market Value (USD Billion) Forecast by Application, 2020-2035
  • Table 36: Western Europe Market Volume (MT) Forecast by Application, 2020-2035
  • Table 37: Western Europe Market Value (USD Billion) Forecast by Form, 2020-2035
  • Table 38: Western Europe Market Volume (MT) Forecast by Form, 2020-2035
  • Table 39: Western Europe Market Value (USD Billion) Forecast by Product Claim, 2020-2035
  • Table 40: Western Europe Market Volume (MT) Forecast by Product Claim, 2020-2035
  • Table 41: Eastern Europe Market Value (USD Billion) Forecast by Country, 2020-2035
  • Table 42: Eastern Europe Market Volume (MT) Forecast by Country, 2020-2035
  • Table 43: Eastern Europe Market Value (USD Billion) Forecast by Product Type, 2020-2035
  • Table 44: Eastern Europe Market Volume (MT) Forecast by Product Type, 2020-2035
  • Table 45: Eastern Europe Market Value (USD Billion) Forecast by Application, 2020-2035
  • Table 46: Eastern Europe Market Volume (MT) Forecast by Application, 2020-2035
  • Table 47: Eastern Europe Market Value (USD Billion) Forecast by Form, 2020-2035
  • Table 48: Eastern Europe Market Volume (MT) Forecast by Form, 2020-2035
  • Table 49: Eastern Europe Market Value (USD Billion) Forecast by Product Claim, 2020-2035
  • Table 50: Eastern Europe Market Volume (MT) Forecast by Product Claim, 2020-2035
  • Table 51: East Asia Market Value (USD Billion) Forecast by Country, 2020-2035
  • Table 52: East Asia Market Volume (MT) Forecast by Country, 2020-2035
  • Table 53: East Asia Market Value (USD Billion) Forecast by Product Type, 2020-2035
  • Table 54: East Asia Market Volume (MT) Forecast by Product Type, 2020-2035
  • Table 55: East Asia Market Value (USD Billion) Forecast by Application, 2020-2035
  • Table 56: East Asia Market Volume (MT) Forecast by Application, 2020-2035
  • Table 57: East Asia Market Value (USD Billion) Forecast by Form, 2020-2035
  • Table 58: East Asia Market Volume (MT) Forecast by Form, 2020-2035
  • Table 59: East Asia Market Value (USD Billion) Forecast by Product Claim, 2020-2035
  • Table 60: East Asia Market Volume (MT) Forecast by Product Claim, 2020-2035
  • Table 61: South Asia & Pacific Market Value (USD Billion) Forecast by Country, 2020-2035
  • Table 62: South Asia & Pacific Market Volume (MT) Forecast by Country, 2020-2035
  • Table 63: South Asia & Pacific Market Value (USD Billion) Forecast by Product Type, 2020-2035
  • Table 64: South Asia & Pacific Market Volume (MT) Forecast by Product Type, 2020-2035
  • Table 65: South Asia & Pacific Market Value (USD Billion) Forecast by Application, 2020-2035
  • Table 66: South Asia & Pacific Market Volume (MT) Forecast by Application, 2020-2035
  • Table 67: South Asia & Pacific Market Value (USD Billion) Forecast by Form, 2020-2035
  • Table 68: South Asia & Pacific Market Volume (MT) Forecast by Form, 2020-2035
  • Table 69: South Asia & Pacific Market Value (USD Billion) Forecast by Product Claim, 2020-2035
  • Table 70: South Asia & Pacific Market Volume (MT) Forecast by Product Claim, 2020-2035
  • Table 71: Middle East and Africa Market Value (USD Billion) Forecast by Country, 2020-2035
  • Table 72: Middle East and Africa Market Volume (MT) Forecast by Country, 2020-2035
  • Table 73: Middle East and Africa Market Value (USD Billion) Forecast by Product Type, 2020-2035
  • Table 74: Middle East and Africa Market Volume (MT) Forecast by Product Type, 2020-2035
  • Table 75: Middle East and Africa Market Value (USD Billion) Forecast by Application, 2020-2035
  • Table 76: Middle East and Africa Market Volume (MT) Forecast by Application, 2020-2035
  • Table 77: Middle East and Africa Market Value (USD Billion) Forecast by Form, 2020-2035
  • Table 78: Middle East and Africa Market Volume (MT) Forecast by Form, 2020-2035
  • Table 79: Middle East and Africa Market Value (USD Billion) Forecast by Product Claim, 2020-2035
  • Table 80: Middle East and Africa Market Volume (MT) Forecast by Product Claim, 2020-2035

List of Figures

  • Figure 1: Global Market Volume (MT) Forecast 2020-2035
  • Figure 2: Global Market Pricing Analysis
  • Figure 3: Global Market Value (USD Billion) Forecast 2020-2035
  • Figure 4: Global Market Value Share and BPS Analysis by Product Type, 2025 and 2035
  • Figure 5: Global Market Y-o-Y Growth Comparison by Product Type, 2025-2035
  • Figure 6: Global Market Attractiveness Analysis by Product Type
  • Figure 7: Global Market Value Share and BPS Analysis by Application, 2025 and 2035
  • Figure 8: Global Market Y-o-Y Growth Comparison by Application, 2025-2035
  • Figure 9: Global Market Attractiveness Analysis by Application
  • Figure 10: Global Market Value Share and BPS Analysis by Form, 2025 and 2035
  • Figure 11: Global Market Y-o-Y Growth Comparison by Form, 2025-2035
  • Figure 12: Global Market Attractiveness Analysis by Form
  • Figure 13: Global Market Value Share and BPS Analysis by Product Claim, 2025 and 2035
  • Figure 14: Global Market Y-o-Y Growth Comparison by Product Claim, 2025-2035
  • Figure 15: Global Market Attractiveness Analysis by Product Claim
  • Figure 16: Global Market Value (USD Billion) Share and BPS Analysis by Region, 2025 and 2035
  • Figure 17: Global Market Y-o-Y Growth Comparison by Region, 2025-2035
  • Figure 18: Global Market Attractiveness Analysis by Region
  • Figure 19: North America Market Incremental $ Opportunity, 2025-2035
  • Figure 20: Latin America Market Incremental $ Opportunity, 2025-2035
  • Figure 21: Western Europe Market Incremental $ Opportunity, 2025-2035
  • Figure 22: Eastern Europe Market Incremental $ Opportunity, 2025-2035
  • Figure 23: East Asia Market Incremental $ Opportunity, 2025-2035
  • Figure 24: South Asia & Pacific Market Incremental $ Opportunity, 2025-2035
  • Figure 25: Middle East and Africa Market Incremental $ Opportunity, 2025-2035
  • Figure 26: North America Market Value Share and BPS Analysis by Country, 2025 and 2035
  • Figure 27: North America Market Value Share and BPS Analysis by Product Type, 2025 and 2035
  • Figure 28: North America Market Y-o-Y Growth Comparison by Product Type, 2025-2035
  • Figure 29: North America Market Attractiveness Analysis by Product Type
  • Figure 30: North America Market Value Share and BPS Analysis by Application, 2025 and 2035
  • Figure 31: North America Market Y-o-Y Growth Comparison by Application, 2025-2035
  • Figure 32: North America Market Attractiveness Analysis by Application
  • Figure 33: North America Market Value Share and BPS Analysis by Form, 2025 and 2035
  • Figure 34: North America Market Y-o-Y Growth Comparison by Form, 2025-2035
  • Figure 35: North America Market Attractiveness Analysis by Form
  • Figure 36: North America Market Value Share and BPS Analysis by Product Claim, 2025 and 2035
  • Figure 37: North America Market Y-o-Y Growth Comparison by Product Claim, 2025-2035
  • Figure 38: North America Market Attractiveness Analysis by Product Claim
  • Figure 39: Latin America Market Value Share and BPS Analysis by Country, 2025 and 2035
  • Figure 40: Latin America Market Value Share and BPS Analysis by Product Type, 2025 and 2035
  • Figure 41: Latin America Market Y-o-Y Growth Comparison by Product Type, 2025-2035
  • Figure 42: Latin America Market Attractiveness Analysis by Product Type
  • Figure 43: Latin America Market Value Share and BPS Analysis by Application, 2025 and 2035
  • Figure 44: Latin America Market Y-o-Y Growth Comparison by Application, 2025-2035
  • Figure 45: Latin America Market Attractiveness Analysis by Application
  • Figure 46: Latin America Market Value Share and BPS Analysis by Form, 2025 and 2035
  • Figure 47: Latin America Market Y-o-Y Growth Comparison by Form, 2025-2035
  • Figure 48: Latin America Market Attractiveness Analysis by Form
  • Figure 49: Latin America Market Value Share and BPS Analysis by Product Claim, 2025 and 2035
  • Figure 50: Latin America Market Y-o-Y Growth Comparison by Product Claim, 2025-2035
  • Figure 51: Latin America Market Attractiveness Analysis by Product Claim
  • Figure 52: Western Europe Market Value Share and BPS Analysis by Country, 2025 and 2035
  • Figure 53: Western Europe Market Value Share and BPS Analysis by Product Type, 2025 and 2035
  • Figure 54: Western Europe Market Y-o-Y Growth Comparison by Product Type, 2025-2035
  • Figure 55: Western Europe Market Attractiveness Analysis by Product Type
  • Figure 56: Western Europe Market Value Share and BPS Analysis by Application, 2025 and 2035
  • Figure 57: Western Europe Market Y-o-Y Growth Comparison by Application, 2025-2035
  • Figure 58: Western Europe Market Attractiveness Analysis by Application
  • Figure 59: Western Europe Market Value Share and BPS Analysis by Form, 2025 and 2035
  • Figure 60: Western Europe Market Y-o-Y Growth Comparison by Form, 2025-2035
  • Figure 61: Western Europe Market Attractiveness Analysis by Form
  • Figure 62: Western Europe Market Value Share and BPS Analysis by Product Claim, 2025 and 2035
  • Figure 63: Western Europe Market Y-o-Y Growth Comparison by Product Claim, 2025-2035
  • Figure 64: Western Europe Market Attractiveness Analysis by Product Claim
  • Figure 65: Eastern Europe Market Value Share and BPS Analysis by Country, 2025 and 2035
  • Figure 66: Eastern Europe Market Value Share and BPS Analysis by Product Type, 2025 and 2035
  • Figure 67: Eastern Europe Market Y-o-Y Growth Comparison by Product Type, 2025-2035
  • Figure 68: Eastern Europe Market Attractiveness Analysis by Product Type
  • Figure 69: Eastern Europe Market Value Share and BPS Analysis by Application, 2025 and 2035
  • Figure 70: Eastern Europe Market Y-o-Y Growth Comparison by Application, 2025-2035
  • Figure 71: Eastern Europe Market Attractiveness Analysis by Application
  • Figure 72: Eastern Europe Market Value Share and BPS Analysis by Form, 2025 and 2035
  • Figure 73: Eastern Europe Market Y-o-Y Growth Comparison by Form, 2025-2035
  • Figure 74: Eastern Europe Market Attractiveness Analysis by Form
  • Figure 75: Eastern Europe Market Value Share and BPS Analysis by Product Claim, 2025 and 2035
  • Figure 76: Eastern Europe Market Y-o-Y Growth Comparison by Product Claim, 2025-2035
  • Figure 77: Eastern Europe Market Attractiveness Analysis by Product Claim
  • Figure 78: East Asia Market Value Share and BPS Analysis by Country, 2025 and 2035
  • Figure 79: East Asia Market Value Share and BPS Analysis by Product Type, 2025 and 2035
  • Figure 80: East Asia Market Y-o-Y Growth Comparison by Product Type, 2025-2035
  • Figure 81: East Asia Market Attractiveness Analysis by Product Type
  • Figure 82: East Asia Market Value Share and BPS Analysis by Application, 2025 and 2035
  • Figure 83: East Asia Market Y-o-Y Growth Comparison by Application, 2025-2035
  • Figure 84: East Asia Market Attractiveness Analysis by Application
  • Figure 85: East Asia Market Value Share and BPS Analysis by Form, 2025 and 2035
  • Figure 86: East Asia Market Y-o-Y Growth Comparison by Form, 2025-2035
  • Figure 87: East Asia Market Attractiveness Analysis by Form
  • Figure 88: East Asia Market Value Share and BPS Analysis by Product Claim, 2025 and 2035
  • Figure 89: East Asia Market Y-o-Y Growth Comparison by Product Claim, 2025-2035
  • Figure 90: East Asia Market Attractiveness Analysis by Product Claim
  • Figure 91: South Asia & Pacific Market Value Share and BPS Analysis by Country, 2025 and 2035
  • Figure 92: South Asia & Pacific Market Value Share and BPS Analysis by Product Type, 2025 and 2035
  • Figure 93: South Asia & Pacific Market Y-o-Y Growth Comparison by Product Type, 2025-2035
  • Figure 94: South Asia & Pacific Market Attractiveness Analysis by Product Type
  • Figure 95: South Asia & Pacific Market Value Share and BPS Analysis by Application, 2025 and 2035
  • Figure 96: South Asia & Pacific Market Y-o-Y Growth Comparison by Application, 2025-2035
  • Figure 97: South Asia & Pacific Market Attractiveness Analysis by Application
  • Figure 98: South Asia & Pacific Market Value Share and BPS Analysis by Form, 2025 and 2035
  • Figure 99: South Asia & Pacific Market Y-o-Y Growth Comparison by Form, 2025-2035
  • Figure 100: South Asia & Pacific Market Attractiveness Analysis by Form
  • Figure 101: South Asia & Pacific Market Value Share and BPS Analysis by Product Claim, 2025 and 2035
  • Figure 102: South Asia & Pacific Market Y-o-Y Growth Comparison by Product Claim, 2025-2035
  • Figure 103: South Asia & Pacific Market Attractiveness Analysis by Product Claim
  • Figure 104: Middle East and Africa Market Value Share and BPS Analysis by Country, 2025 and 2035
  • Figure 105: Middle East and Africa Market Value Share and BPS Analysis by Product Type, 2025 and 2035
  • Figure 106: Middle East and Africa Market Y-o-Y Growth Comparison by Product Type, 2025-2035
  • Figure 107: Middle East and Africa Market Attractiveness Analysis by Product Type
  • Figure 108: Middle East and Africa Market Value Share and BPS Analysis by Application, 2025 and 2035
  • Figure 109: Middle East and Africa Market Y-o-Y Growth Comparison by Application, 2025-2035
  • Figure 110: Middle East and Africa Market Attractiveness Analysis by Application
  • Figure 111: Middle East and Africa Market Value Share and BPS Analysis by Form, 2025 and 2035
  • Figure 112: Middle East and Africa Market Y-o-Y Growth Comparison by Form, 2025-2035
  • Figure 113: Middle East and Africa Market Attractiveness Analysis by Form
  • Figure 114: Middle East and Africa Market Value Share and BPS Analysis by Product Claim, 2025 and 2035
  • Figure 115: Middle East and Africa Market Y-o-Y Growth Comparison by Product Claim, 2025-2035
  • Figure 116: Middle East and Africa Market Attractiveness Analysis by Product Claim
  • Figure 117: Global Market - Tier Structure Analysis
  • Figure 118: Global Market - Company Share Analysis

Frequently Asked Questions

What is the projected size of the global cafix industry by 2035?

The industry is expected to reach USD 1,462.4 million by 2035, up from USD 856.1 million in 2025.

What is the compound annual growth rate (CAGR) for the cafix market (2025 to 2035)?

The industry is projected to grow at a CAGR of 5.5% during the forecast period.

Which product type leads the cafix market in 2025?

Powdered cafix dominates with a 48.3% market share due to its convenience, solubility, and shelf stability.

What is the leading product claim among cafix consumers in 2025?

Organic certified cafix holds the top spot with 36.5% share, driven by demand for clean-label and non-GMO products.

Which country contributes the most to cafix growth?

The United States leads the market with a 5.5% CAGR and 52% of sales coming from e-commerce platforms.

Future Market Insights

Cafix Market