Canthaxanthin Market Size and Share Forecast Outlook 2025 to 2035

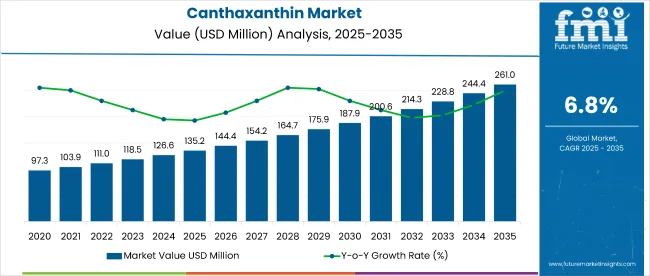
The global canthaxanthin market is worth USD 135.2 million in 2025 and is expected to reach USD 261 million by 2035, reflecting a CAGR of 6.8%. Factors driving this growth include increasing demand for natural colorants in food and beverages, rising applications in animal feed and cosmetics, and growing awareness about the compound’s antioxidant properties.
Quick Stats for Canthaxanthin Market

  • Value of Canthaxanthin Market (2025): USD 135.2 million
  • Projected Value of Canthaxanthin Market (2035): USD 261 million
  • Forecast CAGR of Canthaxanthin Market (2025 to 2035): 6.8%
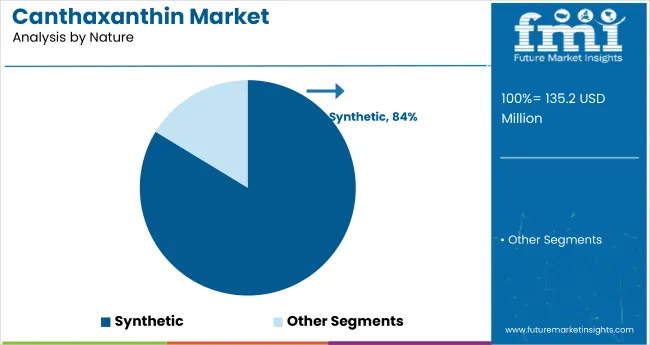
  • Leading Segment by Type of Canthaxanthin Market (2025): Synthetic Canthaxanthin (84% Market Share)
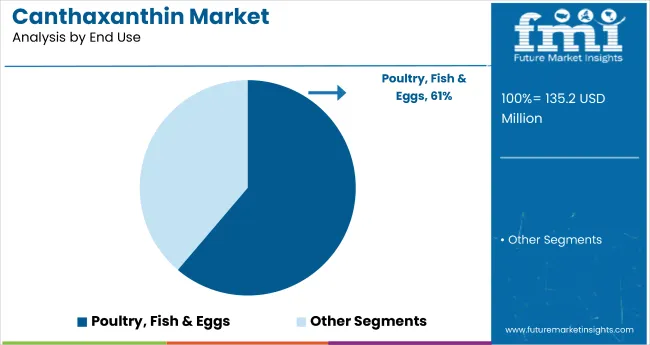
  • Leading Segment by Application in CanthaxanthinMarket (2025): Poultry, Fish & Eggs (61% Share)
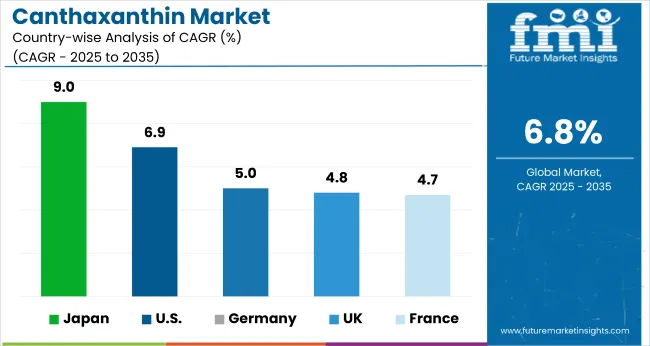
  • Fastest Growing Country in Canthaxanthin Market (2025): Japan (9% CAGR)
  • Top Key Players in Canthaxanthin Market: Mezzoni Foods, Allied Biotech Corporation, BASF SE, DSM, ROHA (a JJT Group Company), Sensient Colors LLC

Canthaxanthin Market

Metric Value
Estimated Size (2025E) USD 135.2 million
Projected Value (2035F) USD 261 million
CAGR (2025 to 2035) 6.8%

Canthaxanthin has gained attention for its functional benefits, such as eye health support and protection against oxidative stress. Japan is anticipated to register the fastest growth with a significant CAGR of 9%. Meanwhile, the USA is expected to account for the largest share in the global market by 2035, expected to expand at a CAGR of 6.9%, followed by Germany at a 5% CAGR. Synthetic canthaxanthin is expected to remain the dominant product type, capturing 84% of the market share. Among end users, poultry, fish & eggs will lead with 61% of the market share, due to the demand rising from seafood consumption.

Themarket holds a niche but impactful position across several broader markets. It accounts for 3.2% of the global carotenoids market, primarily due to its strong use in poultry, aquaculture, and dietary supplements. Within the natural food colors market, it represents around 1.5%, given its selective application in beverages and bakery.

In the animal feed additives market, canthaxanthin contributes nearly 2.8%, largely from poultry and shrimp feed. It holds a 1% share in both the nutraceutical ingredients and cosmetic ingredients markets, reflecting its emerging role in skin health and antioxidant products.

Going forward, investments in sustainable sourcing and advanced purification systems are expected to shape the market. Regulatory support, such as the FDA’s GRAS recognition of canthaxanthin-based additives, is encouraging further innovation.

Technologies enabling improved bioavailability and formulation stability are likely to enhance product applications in pharmaceuticals and nutraceuticals, supporting steady market expansion through 2035.The expansion of the processed food sector and increasing investments in clean-label ingredients are expected to boost the market throughout the forecast period.

Canthaxanthin Market Analysis by Top Investment Segment

The market is segmented into nature, end use and region. By nature, the market is divided into natural and synthetic. Based on end-use, the market includes beverage (alcoholic beverages, carbonates (carbonated soft drinks) & energy drinks, juice-based drinks, milk drinks & milk alternatives, sports drinks, and flavored, enhanced, & sparkling waters), bakery (snacks & cereal, breakfast cereal, bread, cakes & pastries, cookies & biscuits, and crackers & savory snacks), candy/confectionery, dairy, poultry, fish & eggs, sauces, soups & dressings, seasonings, dietary supplements, pharmaceuticals, and pet food. Regionally, the market is classified into North America, Latin America, Europe, East Asia, South Asia, Oceania, and the Middle East & Africa.
By Nature, Synthetic CanthaxanthinAccounts for 84% of the Market Share

Canthaxanthin Market Analysis By Nature

Synthetic canthaxanthin remains the most lucrative segment under the nature segment, projected to hold an 84% market share by 2035. Its dominance can be attributed to cost-effectiveness, consistent pigment quality, and ease of large-scale production. Synthetic variants also offer a reliable supply chain, free from seasonal fluctuations, making them ideal for use in the food and feed industries. Natural alternatives are gaining traction but remain constrained by higher costs and limited availability.
  • Favored for precise color control in processed foods.
  • Offers scalability and stable pricing.
  • Lower environmental footprint through controlled production.

By End Use, Poultry, Fish, & EggsAccount for 61% of the Market Share

Canthaxanthin Market Analysis By End Use

Poultry, fish & eggs lead the end-use segment, accounting for a 61% market share by 2035. Canthaxanthin plays a crucial role in improving product appearance and meeting quality grading standards. Its use is expanding in both developed and emerging economies due to the growth of protein consumption and aquaculture. As global demand for seafood grows, fish feed remains the largest application in this segment.

  • Enhances product quality and appeal.
  • Integral to the aquaculture and poultry industries.
  • Demand supported by rising seafood intake.

Top Canthaxanthin Market Dynamics

Recent Trends in the Canthaxanthin Market

  • Surge in demand for naturally derived colorants across food and beverage industries.
  • Expansion of aquaculture applications to enhance fish pigmentation.
  • Rising popularity of canthaxanthin in skin health and beauty-from-within supplements.
  • Technological advancements in purification and microencapsulation techniques for improved stability.

Challenges in the Canthaxanthin Market
  • Stringent regulatory scrutiny over health-related claims in supplements and cosmetics.
  • High production costs for natural canthaxanthin compared to synthetic alternatives.
  • Limited consumer awareness in developing markets regarding functional benefits.
  • Supply chain disruptions are affecting raw material sourcing and pricing volatility.

Analyzing Top Countries Manufacturing, Using, and Supplying Canthaxanthin

Country Wise Analysis Of Canthaxanthin Market

Among the top-performing countries in the global market, Japan leads with the highest projected CAGR of 9% between 2025 to 2035. This growth is primarily driven by the increasing use of canthaxanthin in aquaculture feed, particularly for salmonids, and the expanding nutraceutical sector. The United States follows with a CAGR of 6.9%, supported by the shift toward clean-label food coloring, strong dietary supplement sales, and its mature cosmetic ingredient market.

Germany is expected to record a 5% CAGR, driven by high consumption in processed meats, pet foods, and functional animal feed. France and the UK are projected to grow at 4.7% and 4.8%, respectively, owing to innovation in cosmeceuticals, pharmaceutical pigments, and commitments to natural and sustainable sourcing. Other emerging contributors include China, India, and Brazil, where rising aquaculture output and pigment fortification in food/feed are accelerating demand.

The report covers an in-depth analysis of 40+ countries; five top-performing OECD countries are highlighted below.

USA Canthaxanthin Demand Growth Drivers

Canthaxanthin revenue in the USA is projected to expand at a CAGR of 6.9% from 2025 to 2035. Between 2020 and 2024, demand was driven primarily by the food and beverage industry's rapid clean-label transition, especially in flavored dairy and fortified juices.

Going forward, dietary supplements and poultry feed applications are gaining momentum due to increased awareness of antioxidant benefits and pigmentation standards. With major players like DSM and Novus International based in the USA, innovation and FDA approvals are accelerating domestic adoption across sectors.

  • High consumer demand for clean-label dairy and beverages.
  • Well-established supply chain infrastructure and R&D hubs.
  • Growth in nutraceuticals and animal feed applications.

Canthaxanthin Demand Analysis in the UK

The canthaxanthin market in the UK is anticipated to grow at a CAGR of 4.8% from 2025 to 2035. From 2020 to 2024, regulatory oversight by the Food Standards Agency led to stable yet cautious adoption in food and pharmaceutical formulations. However, the period from 2025 onward is likely to see broader use in cosmetics and dietary supplements, driven by consumer demand for natural, sustainable ingredients. The UK’s robust policy framework is pushing companies to invest in eco-certified and safety-compliant formulations.

  • Stringent regulations influencing ingredient sourcing.
  • Increasing demand for natural pigments in beauty products.
  • Focus on sustainable sourcing across production chains.

GermanyCanthaxanthin Sales Analysis

Sales of canthaxanthin in Germany are expected to flourish at a CAGR of 5% from 2025 to 2035. From 2020 to 2024, the country experienced strong uptake in meat processing and dairy-based applications due to its dominant food manufacturing industry. Looking ahead, increased demand is expected from the pet food and aquaculture segments, as Germans continue to invest in premium pet nutrition and sustainable seafood. Innovation in formulation technologies is helping manufacturers offer higher pigment stability and better bioavailability.

  • High penetration in processed meat and dairy sectors.
  • Rising pet food premiumizationis driving pigment use.
  • Adoption of EU-compliant formulation technologies.

Canthaxanthin Demand Analysis in France

The French canthaxanthinrevenueis slated to rise at a CAGR of 4.7% from 2025 to 2035. Between 2020 and 2024, demand was moderate, with applications concentrated in sauces, baked goods, and confectionery. From 2025 onward, the surge in cosmetic and dermatological supplement usage is likely to drive market expansion. French consumers' strong preference for visually appealing, natural-origin products is accelerating innovation in clean-label solutions.

  • Growing preference for naturally pigmented food and beauty products.
  • Cosmetic and dermatology applications are gaining traction.
  • Strict adherence to EU safety and environmental guidelines.

Japan Canthaxanthin Growth Outlook Drivers

The canthaxanthin market in Japan is predicted to grow at a CAGR of 9% from 2025 to 2035, the fastest among the top five countries. From 2020 to 2024, demand was largely driven by fish feed applications to meet aquaculture quality standards. As Japan continues to promote functional beverages and health supplements, demand from the nutraceutical and pharmaceutical sectors is forecast to surge. Japanese consumers show strong trust in scientifically validated, functional ingredients, making it a ripe market for canthaxanthin innovation.
  • High growth in aquaculture and fish pigmentation.
  • Expanding applications in functional health beverages.
  • Consumer preference for clinically backed nutraceuticals.

Leading Canthaxanthin Suppliers and Manufacturers

Canthaxanthin Market Analysis By Company

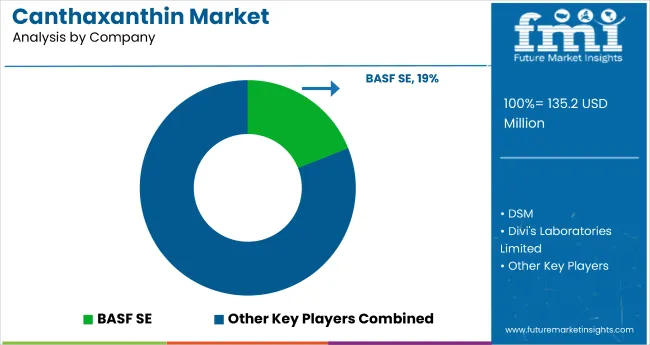
The global market is moderately fragmented, with several key players operating across global and regional levels. Leading companies such as Allied Biotech Corporation, BASF SE, DSM, ROHA, and Divi’s Laboratories dominate due to their advanced manufacturing capabilities and regulatory approvals. These companies are competing based on pigment purity, formulation flexibility, and industry-specific customization, particularly in food, cosmetics, and animal nutrition segments. Innovation in microencapsulation, natural extraction, and feed-grade formats continues to define the competitive edge in this space.

Company strategies are centered on expanding production capacities, strengthening regulatory compliance (especially with EFSA and FDA), and targeting high-growth regions like East Asia and North America. Strategic partnerships and acquisitions are being pursued to secure raw material access and regional distribution networks. BASF and DSM are also investing heavily in clean-label and synthetic biology advancements to serve the rising demand for sustainable and high-performance colorants in aquaculture, dietary supplements, and cosmetics.

Canthaxanthin Market Report Scope

Report Attributes Details
Current Total Market Size (2025) USD 135.2 million
Projected Market Size (2035)

USD 261 million

CAGR (2025 to 2035) 6.8%
Base Year for Estimation 2024
Historical Period 2020 to 2024
Projections Period 2025 to 2035
Market Analysis Parameters Revenue in USD million/Volume in kilotons
By Nature Natural and Synthetic
By End Use Beverages (Alcoholic Beverages, Carbonates (Carbonated Soft Drinks) & Energy Drinks, Juice-Based Drinks, Milk Drinks & Milk Alternatives, Sports Drinks, and Flavored, Enhanced, & Sparkling Waters), Bakery (Snacks & Cereal, Breakfast Cereal, Bread, Cakes & Pastries, Cookies & Biscuits, Crackers & Savory Snacks) Candy/ Confectionery, Dairy, Poultry/Fish/Eggs, Sauces & Dressings, Seasonings, Dietary Supplements, Pharmaceuticals, Pet Food
Regions Covered North America, Latin America, Europe, East Asia, South Asia, Oceania, Middle East & Africa
Countries Covered United States, Canada, United Kingdom, Germany, France, China, Japan, South Korea, Brazil, Australia and 40+ countries
Key Players Mezzoni Foods, Allied Biotech Corporation, BASF SE, DSM, ROHA (A JJT Group Company), Sensient Colors LLC., Divi's Laboratories Limited, Zhejiang NHU Company Ltd, Zmc Gmbh, NOVUS INTERNATIONAL, Healtheway Xi‘an Biotechnology Co. Ltd, Guangzhou Juyuan Bio- Chem Co., Ltd., Lemillionaceae Fermentation Inc, Biosynth, Emd Millipore Corporation, FOODCHEM, INDOFINE CHEMICAL COMPANY MS, POLIFAR GROUP LIMITED, and HSF Biotech
Additional Attributes Dollar sales by value, market share analysis by segments, and country-wise analysis

Key Segments

By Nature:

  • Natural
  • Synthetic

By End Use:

  • Beverage
    • Alcoholic Beverages
    • Carbonates (Carbonated Soft Drinks), Energy Drink
    • Juice Based Drinks
    • Milk Drinks & Milk Alternatives
    • Sports Drinks
    • Flavored Water, Enhanced Water, Sparkling Waters
  • Bakery
    • Snacks & Cereal
    • Breakfast Cereal
    • Bread
    • Cakes & Pastries
    • Cookies & Biscuits
    • Crackers & Savory Snacks
  • Candy / Confectionery Dairy
  • Meat, Poultry, Fish, & Eggs
  • Sauces, Soups, & Dressings
  • Seasonings
  • Dietary Supplement
  • Pharmaceuticals
  • Pet Food

By Region:

  • North America
  • Latin America
  • Europe
  • East Asia
  • South Asia
  • Oceania
  • Middle East & Africa

Table of Content

  1. Executive Summary
    • Global Market Outlook
    • Demand-side Trends
    • Supply-side Trends
    • Technology Roadmap Analysis
    • Analysis and Recommendations
  2. Market Overview
    • Market Coverage/Taxonomy
    • Market Definition/Scope/Limitations
  3. Market Background
    • Market Dynamics
      • Drivers
      • Restraints
      • Opportunity
      • Trends
    • Scenario Forecast
      • Demand in Optimistic Scenario
      • Demand in Likely Scenario
      • Demand in Conservative Scenario
    • Opportunity Map Analysis
    • Product Life Cycle Analysis
    • Supply Chain Analysis
      • Supply Side Participants and their Roles
        • Producers
        • Mid-Level Participants (Traders/ Agents/ Brokers)
        • Wholesalers and Distributors
      • Value Added and Value Created at Node in the Supply Chain
      • List of Raw Material Suppliers
      • List of Existing and Potential Buyer’s
    • Investment Feasibility Matrix
    • Value Chain Analysis
      • Profit Margin Analysis
      • Wholesalers and Distributors
      • Retailers
    • PESTLE and Porter’s Analysis
    • Regulatory Landscape
      • By Key Regions
      • By Key Countries
    • Regional Parent Market Outlook
    • Production and Consumption Statistics
    • Import and Export Statistics
  4. Global Market Analysis 2020-2024 and Forecast, 2025-2035
    • Historical Market Size Value (USD Million) & Volume (Kilotons) Analysis, 2020-2024
    • Current and Future Market Size Value (USD Million) & Volume (Kilotons) Projections, 2025-2035
      • Y-o-Y Growth Trend Analysis
      • Absolute $ Opportunity Analysis
  5. Global Market Pricing Analysis 2020-2024 and Forecast 2025-2035
  6. Global Market Analysis 2020-2024 and Forecast 2025-2035, By Nature
    • Introduction/Key Findings
    • Historical Market Size Value (USD Million) & Volume (Kilotons) Analysis By Nature, 2020-2024
    • Current and Future Market Size Value (USD Million) & Volume (Kilotons) Analysis and Forecast By Nature, 2025-2035
      • Natural
      • Synthetic
    • Y-o-Y Growth Trend Analysis By Nature, 2020-2024
    • Absolute $ Opportunity Analysis By Nature, 2025-2035
  7. Global Market Analysis 2020-2024 and Forecast 2025-2035, By End-use
    • Introduction/Key Findings
    • Historical Market Size Value (USD Million) & Volume (Kilotons) Analysis By End-use, 2020-2024
    • Current and Future Market Size Value (USD Million) & Volume (Kilotons) Analysis and Forecast By End-use, 2025-2035
      • Beverage
        • Alcoholic Beverages
        • Carbonates (Carbonated Soft Drinks), Energy Drink
        • Juice Based Drinks
        • Milk Drinks & Milk Alternatives
        • Sports Drinks
        • Flavored Water, Enhanced Water, Sparkling Waters
      • Bakery
        • Snacks & Cereal
        • Breakfast Cereal
        • Bread
        • Cakes & Pastries
        • Cookies & Biscuits
        • Crackers & Savory Snacks
      • Candy/Confectionery, Dairy
      • Poultry, Fish, & Eggs
      • Sauces, Soups, & Dressings
      • Seasonings
      • Dietary Supplement
      • Pharmaceuticals
      • Pet Food
    • Y-o-Y Growth Trend Analysis By End-use, 2020-2024
    • Absolute $ Opportunity Analysis By End-use, 2025-2035
  8. Global Market Analysis 2020-2024 and Forecast 2025-2035, By Region
    • Introduction
    • Historical Market Size Value (USD Million) & Volume (Kilotons) Analysis By Region, 2020-2024
    • Current Market Size Value (USD Million) & Volume (Kilotons) Analysis and Forecast By Region, 2025-2035
      • North America
      • Latin America
      • Western Europe
      • Eastern Europe
      • East Asia
      • South Asia & Pacific
      • Middle East and Africa
    • Market Attractiveness Analysis By Region
  9. North America Market Analysis 2020-2024 and Forecast 2025-2035, By Country
    • Historical Market Size Value (USD Million) & Volume (Kilotons) Trend Analysis By Market Taxonomy, 2020-2024
    • Market Size Value (USD Million) & Volume (Kilotons) Forecast By Market Taxonomy, 2025-2035
      • By Country
        • USA
        • Canada
        • Mexico
      • By Nature
      • By End-use
    • Market Attractiveness Analysis
      • By Country
      • By Nature
      • By End-use
    • Key Takeaways
  10. Latin America Market Analysis 2020-2024 and Forecast 2025-2035, By Country
    • Historical Market Size Value (USD Million) & Volume (Kilotons) Trend Analysis By Market Taxonomy, 2020-2024
    • Market Size Value (USD Million) & Volume (Kilotons) Forecast By Market Taxonomy, 2025-2035
      • By Country
        • Brazil
        • Argentina
        • Rest of LATAM
      • By Nature
      • By End-use
    • Market Attractiveness Analysis
      • By Country
      • By Nature
      • By End-use
    • Key Takeaways
  11. Western Europe Market Analysis 2020-2024 and Forecast 2025-2035, By Country
    • Historical Market Size Value (USD Million) & Volume (Kilotons) Trend Analysis By Market Taxonomy, 2020-2024
    • Market Size Value (USD Million) & Volume (Kilotons) Forecast By Market Taxonomy, 2025-2035
      • By Country
        • Germany
        • Italy
        • France
        • UK
        • Spain
        • BENELUX
        • Nordic
        • Rest of W.Europe
      • By Nature
      • By End-use
    • Market Attractiveness Analysis
      • By Country
      • By Nature
      • By End-use
    • Key Takeaways
  12. Eastern Europe Market Analysis 2020-2024 and Forecast 2025-2035, By Country
    • Historical Market Size Value (USD Million) & Volume (Kilotons) Trend Analysis By Market Taxonomy, 2020-2024
    • Market Size Value (USD Million) & Volume (Kilotons) Forecast By Market Taxonomy, 2025-2035
      • By Country
        • Russia
        • Hungary
        • Poland
        • Balkan & Baltics
        • Rest of E. Europe
      • By Nature
      • By End-use
    • Market Attractiveness Analysis
      • By Country
      • By Nature
      • By End-use
    • Key Takeaways
  13. East Asia Market Analysis 2020-2024 and Forecast 2025-2035, By Country
    • Historical Market Size Value (USD Million) & Volume (Kilotons) Trend Analysis By Market Taxonomy, 2020-2024
    • Market Size Value (USD Million) & Volume (Kilotons) Forecast By Market Taxonomy, 2025-2035
      • By Country
        • China
        • Japan
        • South Korea
      • By Nature
      • By End-use
    • Market Attractiveness Analysis
      • By Country
      • By Nature
      • By End-use
    • Key Takeaways
  14. South Asia & Pacific Market Analysis 2020-2024 and Forecast 2025-2035, By Country
    • Historical Market Size Value (USD Million) & Volume (Kilotons) Trend Analysis By Market Taxonomy, 2020-2024
    • Market Size Value (USD Million) & Volume (Kilotons) Forecast By Market Taxonomy, 2025-2035
      • By Country
        • India
        • Australia & New Zealand
        • ASEAN
        • Rest of SAP
      • By Nature
      • By End-use
    • Market Attractiveness Analysis
      • By Country
      • By Nature
      • By End-use
    • Key Takeaways
  15. Middle East and Africa Market Analysis 2020-2024 and Forecast 2025-2035, By Country
    • Historical Market Size Value (USD Million) & Volume (Kilotons) Trend Analysis By Market Taxonomy, 2020-2024
    • Market Size Value (USD Million) & Volume (Kilotons) Forecast By Market Taxonomy, 2025-2035
      • By Country
        • GCC Countries
        • Northern Africa
        • South Africa
        • Turkiye
        • Rest of MEA
      • By Nature
      • By End-use
    • Market Attractiveness Analysis
      • By Country
      • By Nature
      • By End-use
    • Key Takeaways
  16. Key Countries Market Analysis
    • USA
      • Pricing Analysis
      • Market Share Analysis, 2024
        • By Nature
        • By End-use
    • Canada
      • Pricing Analysis
      • Market Share Analysis, 2024
        • By Nature
        • By End-use
    • Brazil
      • Pricing Analysis
      • Market Share Analysis, 2024
        • By Nature
        • By End-use
    • Mexico
      • Pricing Analysis
      • Market Share Analysis, 2024
        • By Nature
        • By End-use
    • Argentina
      • Pricing Analysis
      • Market Share Analysis, 2024
        • By Nature
        • By End-use
  17. Market Structure Analysis
    • Competition Dashboard
    • Competition Benchmarking
    • Market Share Analysis of Top Players
      • By Regional
      • By Nature
      • By End-use
  18. Competition Analysis
    • Competition Deep Dive
      • Mezzoni Foods
        • Overview
        • Product Portfolio
        • Profitability by Market Segments (Product/Age /Sales Channel/Region)
        • Sales Footprint
        • Strategy Overview
          • Marketing Strategy
          • Product Strategy
          • Channel Strategy
      • Allied Biotech Corporation
        • Overview
        • Product Portfolio
        • Profitability by Market Segments (Product/Age /Sales Channel/Region)
        • Sales Footprint
        • Strategy Overview
          • Marketing Strategy
          • Product Strategy
          • Channel Strategy
      • BASF SE
        • Overview
        • Product Portfolio
        • Profitability by Market Segments (Product/Age /Sales Channel/Region)
        • Sales Footprint
        • Strategy Overview
          • Marketing Strategy
          • Product Strategy
          • Channel Strategy
      • DSM
        • Overview
        • Product Portfolio
        • Profitability by Market Segments (Product/Age /Sales Channel/Region)
        • Sales Footprint
        • Strategy Overview
          • Marketing Strategy
          • Product Strategy
          • Channel Strategy
      • ROHA (A JJT Group Company)
        • Overview
        • Product Portfolio
        • Profitability by Market Segments (Product/Age /Sales Channel/Region)
        • Sales Footprint
        • Strategy Overview
          • Marketing Strategy
          • Product Strategy
          • Channel Strategy
      • Sensient Colors LLC.
        • Overview
        • Product Portfolio
        • Profitability by Market Segments (Product/Age /Sales Channel/Region)
        • Sales Footprint
        • Strategy Overview
          • Marketing Strategy
          • Product Strategy
          • Channel Strategy
      • Divi's Laboratories Limited
        • Overview
        • Product Portfolio
        • Profitability by Market Segments (Product/Age /Sales Channel/Region)
        • Sales Footprint
        • Strategy Overview
          • Marketing Strategy
          • Product Strategy
          • Channel Strategy
      • Zhejiang NHU Company Ltd
        • Overview
        • Product Portfolio
        • Profitability by Market Segments (Product/Age /Sales Channel/Region)
        • Sales Footprint
        • Strategy Overview
          • Marketing Strategy
          • Product Strategy
          • Channel Strategy
      • Zmc Gmbh
        • Overview
        • Product Portfolio
        • Profitability by Market Segments (Product/Age /Sales Channel/Region)
        • Sales Footprint
        • Strategy Overview
          • Marketing Strategy
          • Product Strategy
          • Channel Strategy
      • NOVUS INTERNATIONAL
        • Overview
        • Product Portfolio
        • Profitability by Market Segments (Product/Age /Sales Channel/Region)
        • Sales Footprint
        • Strategy Overview
          • Marketing Strategy
          • Product Strategy
          • Channel Strategy
      • Healtheway Xi‘an Biotechnology Co. Ltd
        • Overview
        • Product Portfolio
        • Profitability by Market Segments (Product/Age /Sales Channel/Region)
        • Sales Footprint
        • Strategy Overview
          • Marketing Strategy
          • Product Strategy
          • Channel Strategy
      • Guangzhou Juyuan Bio-Chem Co., Ltd.
        • Overview
        • Product Portfolio
        • Profitability by Market Segments (Product/Age /Sales Channel/Region)
        • Sales Footprint
        • Strategy Overview
          • Marketing Strategy
          • Product Strategy
          • Channel Strategy
      • Lemillionaceae Fermentation Inc
        • Overview
        • Product Portfolio
        • Profitability by Market Segments (Product/Age /Sales Channel/Region)
        • Sales Footprint
        • Strategy Overview
          • Marketing Strategy
          • Product Strategy
          • Channel Strategy
      • Biosynth
        • Overview
        • Product Portfolio
        • Profitability by Market Segments (Product/Age /Sales Channel/Region)
        • Sales Footprint
        • Strategy Overview
          • Marketing Strategy
          • Product Strategy
          • Channel Strategy
      • Emd Millipore Corporation
        • Overview
        • Product Portfolio
        • Profitability by Market Segments (Product/Age /Sales Channel/Region)
        • Sales Footprint
        • Strategy Overview
          • Marketing Strategy
          • Product Strategy
          • Channel Strategy
      • FOODCHEM
        • Overview
        • Product Portfolio
        • Profitability by Market Segments (Product/Age /Sales Channel/Region)
        • Sales Footprint
        • Strategy Overview
          • Marketing Strategy
          • Product Strategy
          • Channel Strategy
      • INDOFINE CHEMICAL COMPANY MS
        • Overview
        • Product Portfolio
        • Profitability by Market Segments (Product/Age /Sales Channel/Region)
        • Sales Footprint
        • Strategy Overview
          • Marketing Strategy
          • Product Strategy
          • Channel Strategy
      • POLIFAR GROUP LIMITED
        • Overview
        • Product Portfolio
        • Profitability by Market Segments (Product/Age /Sales Channel/Region)
        • Sales Footprint
        • Strategy Overview
          • Marketing Strategy
          • Product Strategy
          • Channel Strategy
      • HSF biotech
        • Overview
        • Product Portfolio
        • Profitability by Market Segments (Product/Age /Sales Channel/Region)
        • Sales Footprint
        • Strategy Overview
          • Marketing Strategy
          • Product Strategy
          • Channel Strategy
  19. Assumptions & Acronyms Used
  20. Research Methodology

Frequently Asked Questions

What is the projected size of the canthaxanthin market in 2025?

The market size is valued at USD 135.2 million in 2025.

What is the outlook on canthaxanthin demand by 2035?

The market is projected to reach USD 261 million by 2035, reflecting a CAGR of 6.8%.

Which nature segment leads the canthaxanthin market in 2025?

Synthetic canthaxanthin is expected to lead, with an 84% market share in 2025.

Which end-use segment is projected to dominate the canthaxanthin market in 2025?

Poultry, fish & eggs are anticipated to hold the largest share at 61% in 2025.

Which country is projected to have the fastest-growing canthaxanthin market?

Japan is expected to grow at the fastest pace, with a CAGR of 9% from 2025 to 2035.

Future Market Insights

Canthaxanthin Market