Reports

- Global Locations -

Headquarters

Future Market Insights, Inc.

Christiana Corporate, 200
Continental Drive, Suite 401,
Newark, Delaware - 19713,
United States

T: +1-845-579-5705

Americas

Future Market Insights, Inc.

616 Corporate Way, Suite 2-9018,
Valley Cottage, NY 10989, United States

T: +1-347-918-3531

MEA

Future Market Insights

1602-6 Jumeirah Bay X2 Tower, Plot No: JLT-PH2-X2A,
Jumeirah Lakes Towers, Dubai,
United Arab Emirates

Europe

Future Market Insights

3rd Floor, 207 Regent Street,
W1B 3HH London
United Kingdom

T: + 44 (0) 20 8123 9659
D: +44 (0) 20 3287 4268

Asia Pacific

Future Market Insights

IndiaLand Global Tech Park, Unit UG-1, Behind Grand HighStreet, Phase 1, Hinjawadi, MH, Pune – 411057, India

Cellulase Market Outlook (2023 to 2033)

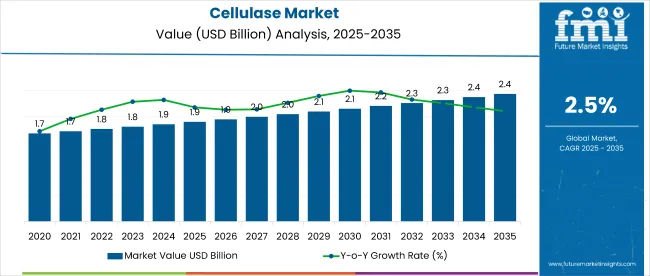
In 2023, the global cellulase market is estimated at US$ 1,685.8 million. The market is likely to reach nearly US$ 3,263.5 million by 2033, with a growing CAGR of 6.8% from 2023 to 2033.

The demand for cellulase is soaring in the paper industry, expanding impressively in the last decade. The mechanical pulping process, which is the crushing and refining of woody crude material, results in pulps with a superior substance of fines, mass, and stiffness.

Report Attribute Details
Cellulase Market Value (2023) US$ 1,685.8 million
Cellulase Market Anticipated Value (2033) US$ 3,263.5 million
Cellulase Projected Growth Rate (2023 to 2033) 6.8%

With the double-digit growth in the global healthcare industry and the struggle against antibiotic-resistant bacteria, it can be predicted that the cellulase market to experience a significant CAGR over the forecast period. Cellulase has been used in making clothing products in the textile industry, particularly for rayon.

Don't pay for what you don't need

Customize your report by selecting specific countries or regions and save 30%!

How is the Cellulase Market Fairing?

Cellulase is extensively used in processing coffee, mainly at the time of the drying process. Cellulase is used in winemaking owing to its cellulolytic properties, it breaks down the grape skin and also removes tannins and unpleasant aromas. Cellulase, interactively along with other enzymes is used to make fruit juices. Such wide applications of this enzyme are likely to boost the global cellulase market.

With the steady growth in the food and beverages industry, the cellulase market can be predicted to bloom at a considerable CAGR throughout the forecast period. Cellulase is used in industrial applications to develop laundry detergents and washing and cleaning agents. The mushrooming rise in the industrial sector is lucratively impacting the cellulase market. Also, cellulase is widely known as a substitute for anti-biotic in treating biofilms produced by Pseudomonas.

The growing use of cellulase is witnessed in various industries, including bioethanol, paper, pulp, agriculture, and others. Particularly in the paper and pulp industry, the adoption of cellulase has increased, and it needs reduced energy while refining and assisting in enhancing paper quality. Furthermore, when drinking the paper, cellulose enhances freeness, cleanliness, and brightness and removes the use of alkalis.

The demand for cellulase is growing in the agricultural sector to improve the fertility of the soil plant growth and to prevent and control diseases in plants. Also, the rising production of wheat and other cereals is propelling the growth of the market further.

Processing cellulase is not cost-effective and is meant to be one of the primary factors hindering the growth of the global market. Furthermore, cellulose is widely used for biomass saccharification, which restricts the commercialization of biomass bio-refineries. This factor, too, is anticipated to hinder the demand for cellulase in the market.

Growing Use of Biofuel Stirring the North American Market

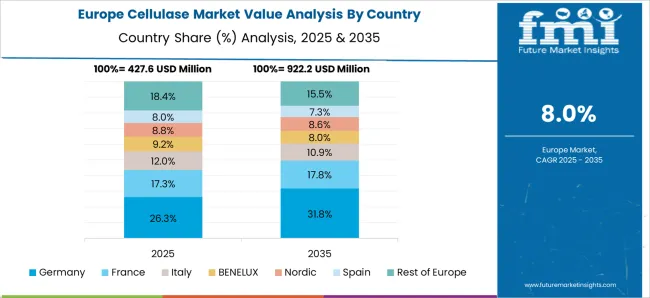
In the global cellulase market, North America accounts for 34.4% market share. Amongst all the other regions, North America is predicted to lead the market owing to growing production and increased use of biofuel. In the recent past, the demand for biofuel has been soaring and therefore, the production too has increased, this factor has opened up a larger growth potential for cellulase.

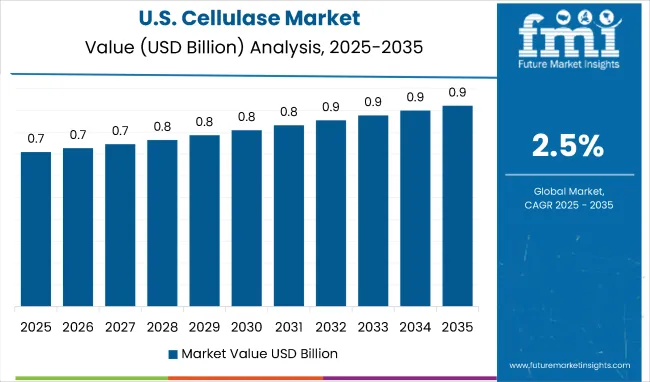
In North America, a country like the USA is the leading cellulose market, so this region is anticipated to maintain its dominance over the forecast period. In July 2018, USA Energy Information Administration published a report stating that biofuel production has escalated in the USA from 1891 trillion butane to 2332 trillion.

Nandini Roy Choudhury

Principal Consultant

Talk to Analyst

Find your sweet spots for generating winning opportunities in this market.

Asia Pacific is Known to be the Fastest Growing Segment

In the global cellulase market, Asia Pacific is said to witness the fastest CAGR over the forecast period. Factors significantly contributing towards larger revenue generation in this region are increasing demand for cellulase for pharmaceutical products and packaging, printed books, clothing, and essential goods, and growing disposable income and overall standard of living.

Asia Pacific has witnessed considerable growth in the textile industry due to a growing consumer preference for clothes that fit comfortably. This results in rising demand for high-value fabrics such as silk, hemp, and viscose.

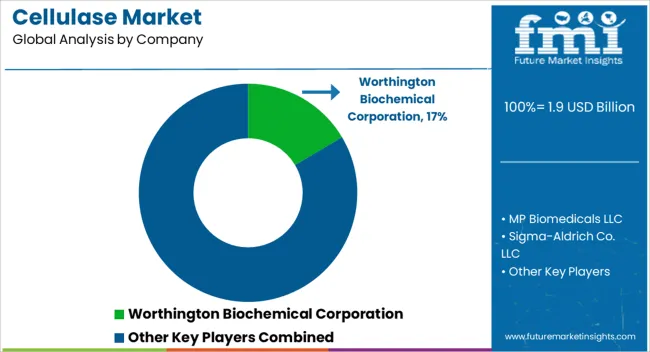
Key Players Benchmarking the Cellulase Market

  • Worthington Biochemical Corporation
  • MP Biomedicals LLC
  • Sigma-Aldrich Co. LLC
  • Prozmix LLC
  • Creative Enzymes
  • world
  • Amano enzyme USA
  • Amano Enzyme Inc.
  • Zhongbei Bio-Chem Industry Co. Ltd.
  • Hunan Hong Ying Biotech Co. Ltd.

Increasing strategic acquisition amongst key market players will significantly impact the growth of the global cellulase market. Several companies in this market are focusing on mergers and acquisitions to strengthen their product portfolio.

Who MP Biomedicals
When March 2022
Strategic Move MP Biomedicals recently announced the launch of the 3rd generation of Automated Nucleic Acid Purification - The MPure-32. For over 20 years, the company has been dedicated to offering the scientific community the most superior tools for sample preparation from grinding to DNA amplification. Through the procedure, MP Biomedicals has sought to render a broader variety of products and kits for purifying and extracting nucleic acids.
Who Creative Enzymes
When October 2019
Strategic Move An enzyme products and services provider company, Creative Enzymes, based in New York, USA, launched three enzyme products to fulfill the growing need for enzymes such as lipase, cellulase, chitinase, etc., in the market.

Get the data you need at a Fraction of the cost

Personalize your report by choosing insights you need
and save 40%!

Recent Developments

  • May 2023: Novozymes announced the launch of its new cellulase product, Cellic CTec2, for the production of bioethanol from lignocellulosic biomass.
  • April 2023: DuPont announced the expansion of its cellulase production capacity in the United States.
  • March 2023: Amano Enzyme announced the launch of its new cellulase product, Cellulase AP300, for the textile industry.

Report Scope

Report Attribute Details
Growth Rate CAGR of 6.8% from 2023 to 2033
Base Year for Estimation 2022
Historical Data 2018 to 2022
Forecast Period 2023 to 2033
Quantitative Units Revenue in US$ million and CAGR from 2023 to 2033
Report Coverage Revenue Forecast, Volume Forecast, Company Ranking, Competitive Landscape, Growth Factors, Trends, and Pricing Analysis
Segments Covered
  • Source
  • End Use
  • Region
Regions Covered
  • North America
  • Latin America
  • Europe
  • East Asia
  • South Asia
  • Oceania
  • Middle East and Africa
Key Countries Profiled
  • United States of America
  • Canada
  • Brazil
  • Argentina
  • Germany
  • United Kingdom
  • France
  • Spain
  • Italy
  • Nordics
  • BENELUX
  • Australia & New Zealand
  • China
  • India
  • ASIAN
  • GCC Countries
  • South Africa
Key Companies Profiled
  • Worthington Biochemical Corporation
  • MP Biomedicals LLC
  • Sigma-Aldrich Co. LLC
  • Prozmix LLC
  • Creative Enzymes
  • world
  • Amano enzyme USA
  • Amano Enzyme Inc.
  • Zhongbei Bio-Chem Industry Co. Ltd.
  • Hunan Hong Ying Biotech Co. Ltd.
Customization Available Upon Request

Key Segments of the Cellulase Market

By Source:

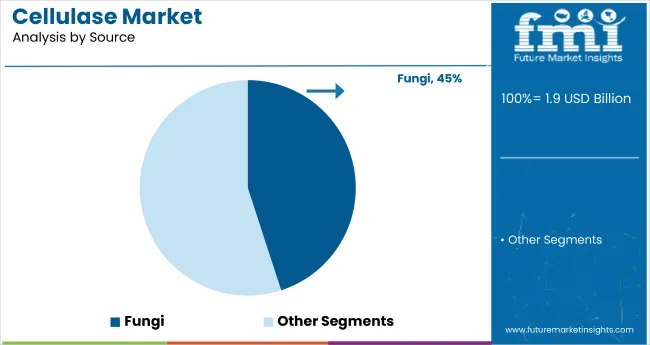
  • Fungi
  • Bacteria
  • Actinomycetes
  • Plants
  • Animals

By End Use:

  • Healthcare
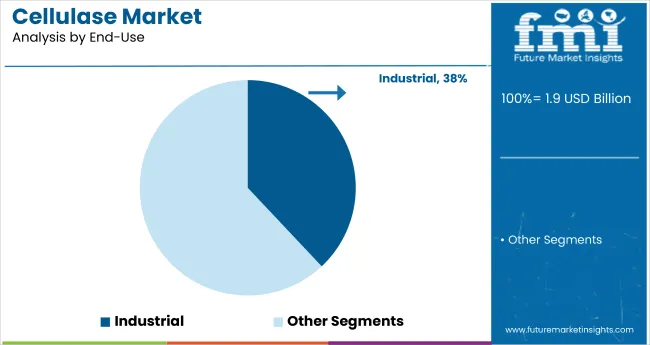
  • Industrial
  • Food and Beverages
  • Textile
  • Pulp and paper

By Region:

  • North America
  • Latin America
  • Asia Pacific
  • Middle East and Africa
  • Europe

Frequently Asked Questions

What is the Projected Size of the Market by 2023?

The market is estimated to acquire US$ 1,685.8 million by 2023.

What is Primarily Driving the Market for Cellulase?

The rising production of wheat and other cereals drives the market growth.

Which Region has a Dominant Market Share?

North America accounts for a dominant market share.

What Hinders the Growth of the Market?

Cellulose's saccharification role hampers bio-refinery commercialization, curbing demand.

What are the Factors Driving the Market in North America?

Growing production and increased use of biofuel drives North America’s market.

Table of Content

1. Executive Summary

    1.1. Global Market Outlook

    1.2. Demand-side Trends

    1.3. Supply-side Trends

    1.4. Technology Roadmap Analysis

    1.5. Analysis and Recommendations

2. Market Overview

    2.1. Market Coverage / Taxonomy

    2.2. Market Definition / Scope / Limitations

3. Market Background

    3.1. Market Dynamics

        3.1.1. Drivers

        3.1.2. Restraints

        3.1.3. Opportunity

        3.1.4. Trends

    3.2. Scenario Forecast

        3.2.1. Demand in Optimistic Scenario

        3.2.2. Demand in Likely Scenario

        3.2.3. Demand in Conservative Scenario

    3.3. Opportunity Map Analysis

    3.4. Product Life Cycle Analysis

    3.5. Supply Chain Analysis

        3.5.1. Supply Side Participants and their Roles

            3.5.1.1. Producers

            3.5.1.2. Mid-Level Participants (Traders/ Agents/ Brokers)

            3.5.1.3. Wholesalers and Distributors

        3.5.2. Value Added and Value Created at Node in the Supply Chain

        3.5.3. List of Raw Material Suppliers

        3.5.4. List of Existing and Potential Buyer’s

    3.6. Investment Feasibility Matrix

    3.7. Value Chain Analysis

        3.7.1. Profit Margin Analysis

        3.7.2. Wholesalers and Distributors

        3.7.3. Retailers

    3.8. PESTLE and Porter’s Analysis

    3.9. Regulatory Landscape

        3.9.1. By Key Regions

        3.9.2. By Key Countries

    3.10. Regional Parent Market Outlook

    3.11. Production and Consumption Statistics

    3.12. Import and Export Statistics

4. Global Analysis 2018 to 2022 and Forecast, 2023 to 2033

    4.1. Historical Market Size Value (US$ Million) & Volume (Tons) Analysis, 2018 to 2022

    4.2. Current and Future Market Size Value (US$ Million) & Volume (Tons) Projections, 2023 to 2033

        4.2.1. Y-o-Y Growth Trend Analysis

        4.2.2. Absolute $ Opportunity Analysis

5. Global Analysis 2018 to 2022 and Forecast 2023 to 2033, By Source

    5.1. Introduction / Key Findings

    5.2. Historical Market Size Value (US$ Million) & Volume (Tons) Analysis By Source, 2018 to 2022

    5.3. Current and Future Market Size Value (US$ Million) & Volume (Tons) Analysis and Forecast By Source, 2023 to 2033

        5.3.1. Fungi

        5.3.2. Bacteria

        5.3.3. Actinomycetes

        5.3.4. Plants

        5.3.5. Animals

    5.4. Y-o-Y Growth Trend Analysis By Source, 2018 to 2022

    5.5. Absolute $ Opportunity Analysis By Source, 2023 to 2033

6. Global Analysis 2018 to 2022 and Forecast 2023 to 2033, By End Use

    6.1. Introduction / Key Findings

    6.2. Historical Market Size Value (US$ Million) & Volume (Tons) Analysis By End Use, 2018 to 2022

    6.3. Current and Future Market Size Value (US$ Million) & Volume (Tons) Analysis and Forecast By End Use, 2023 to 2033

        6.3.1. Healthcare

        6.3.2. Industrial

        6.3.3. Food and Beverages

        6.3.4. Textile

        6.3.5. Pulp and paper

    6.4. Y-o-Y Growth Trend Analysis By End Use, 2018 to 2022

    6.5. Absolute $ Opportunity Analysis By End Use, 2023 to 2033

7. Global Analysis 2018 to 2022 and Forecast 2023 to 2033, By Region

    7.1. Introduction

    7.2. Historical Market Size Value (US$ Million) & Volume (Tons) Analysis By Region, 2018 to 2022

    7.3. Current Market Size Value (US$ Million) & Volume (Tons) Analysis and Forecast By Region, 2023 to 2033

        7.3.1. North America

        7.3.2. Latin America

        7.3.3. Western Europe

        7.3.4. Eastern Europe

        7.3.5. South Asia and Pacific

        7.3.6. East Asia

        7.3.7. Middle East and Africa

    7.4. Market Attractiveness Analysis By Region

8. North America Analysis 2018 to 2022 and Forecast 2023 to 2033, By Country

    8.1. Historical Market Size Value (US$ Million) & Volume (Tons) Trend Analysis By Market Taxonomy, 2018 to 2022

    8.2. Market Size Value (US$ Million) & Volume (Tons) Forecast By Market Taxonomy, 2023 to 2033

        8.2.1. By Country

            8.2.1.1. U.S.

            8.2.1.2. Canada

        8.2.2. By Source

        8.2.3. By End Use

    8.3. Market Attractiveness Analysis

        8.3.1. By Country

        8.3.2. By Source

        8.3.3. By End Use

    8.4. Key Takeaways

9. Latin America Analysis 2018 to 2022 and Forecast 2023 to 2033, By Country

    9.1. Historical Market Size Value (US$ Million) & Volume (Tons) Trend Analysis By Market Taxonomy, 2018 to 2022

    9.2. Market Size Value (US$ Million) & Volume (Tons) Forecast By Market Taxonomy, 2023 to 2033

        9.2.1. By Country

            9.2.1.1. Brazil

            9.2.1.2. Mexico

            9.2.1.3. Rest of Latin America

        9.2.2. By Source

        9.2.3. By End Use

    9.3. Market Attractiveness Analysis

        9.3.1. By Country

        9.3.2. By Source

        9.3.3. By End Use

    9.4. Key Takeaways

10. Western Europe Analysis 2018 to 2022 and Forecast 2023 to 2033, By Country

    10.1. Historical Market Size Value (US$ Million) & Volume (Tons) Trend Analysis By Market Taxonomy, 2018 to 2022

    10.2. Market Size Value (US$ Million) & Volume (Tons) Forecast By Market Taxonomy, 2023 to 2033

        10.2.1. By Country

            10.2.1.1. Germany

            10.2.1.2. U.K.

            10.2.1.3. France

            10.2.1.4. Spain

            10.2.1.5. Italy

            10.2.1.6. Rest of Western Europe

        10.2.2. By Source

        10.2.3. By End Use

    10.3. Market Attractiveness Analysis

        10.3.1. By Country

        10.3.2. By Source

        10.3.3. By End Use

    10.4. Key Takeaways

11. Eastern Europe Analysis 2018 to 2022 and Forecast 2023 to 2033, By Country

    11.1. Historical Market Size Value (US$ Million) & Volume (Tons) Trend Analysis By Market Taxonomy, 2018 to 2022

    11.2. Market Size Value (US$ Million) & Volume (Tons) Forecast By Market Taxonomy, 2023 to 2033

        11.2.1. By Country

            11.2.1.1. Poland

            11.2.1.2. Russia

            11.2.1.3. Czech Republic

            11.2.1.4. Romania

            11.2.1.5. Rest of Eastern Europe

        11.2.2. By Source

        11.2.3. By End Use

    11.3. Market Attractiveness Analysis

        11.3.1. By Country

        11.3.2. By Source

        11.3.3. By End Use

    11.4. Key Takeaways

12. South Asia and Pacific Analysis 2018 to 2022 and Forecast 2023 to 2033, By Country

    12.1. Historical Market Size Value (US$ Million) & Volume (Tons) Trend Analysis By Market Taxonomy, 2018 to 2022

    12.2. Market Size Value (US$ Million) & Volume (Tons) Forecast By Market Taxonomy, 2023 to 2033

        12.2.1. By Country

            12.2.1.1. India

            12.2.1.2. Bangladesh

            12.2.1.3. Australia

            12.2.1.4. New Zealand

            12.2.1.5. Rest of South Asia and Pacific

        12.2.2. By Source

        12.2.3. By End Use

    12.3. Market Attractiveness Analysis

        12.3.1. By Country

        12.3.2. By Source

        12.3.3. By End Use

    12.4. Key Takeaways

13. East Asia Analysis 2018 to 2022 and Forecast 2023 to 2033, By Country

    13.1. Historical Market Size Value (US$ Million) & Volume (Tons) Trend Analysis By Market Taxonomy, 2018 to 2022

    13.2. Market Size Value (US$ Million) & Volume (Tons) Forecast By Market Taxonomy, 2023 to 2033

        13.2.1. By Country

            13.2.1.1. China

            13.2.1.2. Japan

            13.2.1.3. South Korea

        13.2.2. By Source

        13.2.3. By End Use

    13.3. Market Attractiveness Analysis

        13.3.1. By Country

        13.3.2. By Source

        13.3.3. By End Use

    13.4. Key Takeaways

14. Middle East and Africa Analysis 2018 to 2022 and Forecast 2023 to 2033, By Country

    14.1. Historical Market Size Value (US$ Million) & Volume (Tons) Trend Analysis By Market Taxonomy, 2018 to 2022

    14.2. Market Size Value (US$ Million) & Volume (Tons) Forecast By Market Taxonomy, 2023 to 2033

        14.2.1. By Country

            14.2.1.1. GCC Countries

            14.2.1.2. South Africa

            14.2.1.3. Israel

            14.2.1.4. Rest of MEA

        14.2.2. By Source

        14.2.3. By End Use

    14.3. Market Attractiveness Analysis

        14.3.1. By Country

        14.3.2. By Source

        14.3.3. By End Use

    14.4. Key Takeaways

15. Key Countries Analysis

    15.1. U.S.

        15.1.1. Pricing Analysis

        15.1.2. Market Share Analysis, 2022

            15.1.2.1. By Source

            15.1.2.2. By End Use

    15.2. Canada

        15.2.1. Pricing Analysis

        15.2.2. Market Share Analysis, 2022

            15.2.2.1. By Source

            15.2.2.2. By End Use

    15.3. Brazil

        15.3.1. Pricing Analysis

        15.3.2. Market Share Analysis, 2022

            15.3.2.1. By Source

            15.3.2.2. By End Use

    15.4. Mexico

        15.4.1. Pricing Analysis

        15.4.2. Market Share Analysis, 2022

            15.4.2.1. By Source

            15.4.2.2. By End Use

    15.5. Germany

        15.5.1. Pricing Analysis

        15.5.2. Market Share Analysis, 2022

            15.5.2.1. By Source

            15.5.2.2. By End Use

    15.6. U.K.

        15.6.1. Pricing Analysis

        15.6.2. Market Share Analysis, 2022

            15.6.2.1. By Source

            15.6.2.2. By End Use

    15.7. France

        15.7.1. Pricing Analysis

        15.7.2. Market Share Analysis, 2022

            15.7.2.1. By Source

            15.7.2.2. By End Use

    15.8. Spain

        15.8.1. Pricing Analysis

        15.8.2. Market Share Analysis, 2022

            15.8.2.1. By Source

            15.8.2.2. By End Use

    15.9. Italy

        15.9.1. Pricing Analysis

        15.9.2. Market Share Analysis, 2022

            15.9.2.1. By Source

            15.9.2.2. By End Use

    15.10. Poland

        15.10.1. Pricing Analysis

        15.10.2. Market Share Analysis, 2022

            15.10.2.1. By Source

            15.10.2.2. By End Use

    15.11. Russia

        15.11.1. Pricing Analysis

        15.11.2. Market Share Analysis, 2022

            15.11.2.1. By Source

            15.11.2.2. By End Use

    15.12. Czech Republic

        15.12.1. Pricing Analysis

        15.12.2. Market Share Analysis, 2022

            15.12.2.1. By Source

            15.12.2.2. By End Use

    15.13. Romania

        15.13.1. Pricing Analysis

        15.13.2. Market Share Analysis, 2022

            15.13.2.1. By Source

            15.13.2.2. By End Use

    15.14. India

        15.14.1. Pricing Analysis

        15.14.2. Market Share Analysis, 2022

            15.14.2.1. By Source

            15.14.2.2. By End Use

    15.15. Bangladesh

        15.15.1. Pricing Analysis

        15.15.2. Market Share Analysis, 2022

            15.15.2.1. By Source

            15.15.2.2. By End Use

    15.16. Australia

        15.16.1. Pricing Analysis

        15.16.2. Market Share Analysis, 2022

            15.16.2.1. By Source

            15.16.2.2. By End Use

    15.17. New Zealand

        15.17.1. Pricing Analysis

        15.17.2. Market Share Analysis, 2022

            15.17.2.1. By Source

            15.17.2.2. By End Use

    15.18. China

        15.18.1. Pricing Analysis

        15.18.2. Market Share Analysis, 2022

            15.18.2.1. By Source

            15.18.2.2. By End Use

    15.19. Japan

        15.19.1. Pricing Analysis

        15.19.2. Market Share Analysis, 2022

            15.19.2.1. By Source

            15.19.2.2. By End Use

    15.20. South Korea

        15.20.1. Pricing Analysis

        15.20.2. Market Share Analysis, 2022

            15.20.2.1. By Source

            15.20.2.2. By End Use

    15.21. GCC Countries

        15.21.1. Pricing Analysis

        15.21.2. Market Share Analysis, 2022

            15.21.2.1. By Source

            15.21.2.2. By End Use

    15.22. South Africa

        15.22.1. Pricing Analysis

        15.22.2. Market Share Analysis, 2022

            15.22.2.1. By Source

            15.22.2.2. By End Use

    15.23. Israel

        15.23.1. Pricing Analysis

        15.23.2. Market Share Analysis, 2022

            15.23.2.1. By Source

            15.23.2.2. By End Use

16. Market Structure Analysis

    16.1. Competition Dashboard

    16.2. Competition Benchmarking

    16.3. Market Share Analysis of Top Players

        16.3.1. By Regional

        16.3.2. By Source

        16.3.3. By End Use

17. Competition Analysis

    17.1. Competition Deep Dive

        17.1.1. Worthington Biochemical Corporation

            17.1.1.1. Overview

            17.1.1.2. Product Portfolio

            17.1.1.3. Profitability by Market Segments

            17.1.1.4. Sales Footprint

            17.1.1.5. Strategy Overview

                17.1.1.5.1. Marketing Strategy

                17.1.1.5.2. Product Strategy

                17.1.1.5.3. Channel Strategy

        17.1.2. MP Biomedicals LLC

            17.1.2.1. Overview

            17.1.2.2. Product Portfolio

            17.1.2.3. Profitability by Market Segments

            17.1.2.4. Sales Footprint

            17.1.2.5. Strategy Overview

                17.1.2.5.1. Marketing Strategy

                17.1.2.5.2. Product Strategy

                17.1.2.5.3. Channel Strategy

        17.1.3. Sigma-Aldrich Co. LLC

            17.1.3.1. Overview

            17.1.3.2. Product Portfolio

            17.1.3.3. Profitability by Market Segments

            17.1.3.4. Sales Footprint

            17.1.3.5. Strategy Overview

                17.1.3.5.1. Marketing Strategy

                17.1.3.5.2. Product Strategy

                17.1.3.5.3. Channel Strategy

        17.1.4. Prozmix LLC

            17.1.4.1. Overview

            17.1.4.2. Product Portfolio

            17.1.4.3. Profitability by Market Segments

            17.1.4.4. Sales Footprint

            17.1.4.5. Strategy Overview

                17.1.4.5.1. Marketing Strategy

                17.1.4.5.2. Product Strategy

                17.1.4.5.3. Channel Strategy

        17.1.5. Creative Enzymes

            17.1.5.1. Overview

            17.1.5.2. Product Portfolio

            17.1.5.3. Profitability by Market Segments

            17.1.5.4. Sales Footprint

            17.1.5.5. Strategy Overview

                17.1.5.5.1. Marketing Strategy

                17.1.5.5.2. Product Strategy

                17.1.5.5.3. Channel Strategy

        17.1.6. world

            17.1.6.1. Overview

            17.1.6.2. Product Portfolio

            17.1.6.3. Profitability by Market Segments

            17.1.6.4. Sales Footprint

            17.1.6.5. Strategy Overview

                17.1.6.5.1. Marketing Strategy

                17.1.6.5.2. Product Strategy

                17.1.6.5.3. Channel Strategy

        17.1.7. Amano enzyme USA

            17.1.7.1. Overview

            17.1.7.2. Product Portfolio

            17.1.7.3. Profitability by Market Segments

            17.1.7.4. Sales Footprint

            17.1.7.5. Strategy Overview

                17.1.7.5.1. Marketing Strategy

                17.1.7.5.2. Product Strategy

                17.1.7.5.3. Channel Strategy

        17.1.8. Amano Enzyme Inc.

            17.1.8.1. Overview

            17.1.8.2. Product Portfolio

            17.1.8.3. Profitability by Market Segments

            17.1.8.4. Sales Footprint

            17.1.8.5. Strategy Overview

                17.1.8.5.1. Marketing Strategy

                17.1.8.5.2. Product Strategy

                17.1.8.5.3. Channel Strategy

        17.1.9. Zhongbei Bio-Chem Industry Co. Ltd.

            17.1.9.1. Overview

            17.1.9.2. Product Portfolio

            17.1.9.3. Profitability by Market Segments

            17.1.9.4. Sales Footprint

            17.1.9.5. Strategy Overview

                17.1.9.5.1. Marketing Strategy

                17.1.9.5.2. Product Strategy

                17.1.9.5.3. Channel Strategy

        17.1.10. Hunan Hong Ying Biotech Co. Ltd.

            17.1.10.1. Overview

            17.1.10.2. Product Portfolio

            17.1.10.3. Profitability by Market Segments

            17.1.10.4. Sales Footprint

            17.1.10.5. Strategy Overview

                17.1.10.5.1. Marketing Strategy

                17.1.10.5.2. Product Strategy

                17.1.10.5.3. Channel Strategy

18. Assumptions & Acronyms Used

19. Research Methodology

Don't pay for what you don't need

Customize your report by selecting specific countries or regions and save 30%!

List of Tables

Table 1: Global Value (US$ Million) Forecast by Region, 2018 to 2033

Table 2: Global Volume (Tons) Forecast by Region, 2018 to 2033

Table 3: Global Value (US$ Million) Forecast by Source, 2018 to 2033

Table 4: Global Volume (Tons) Forecast by Source, 2018 to 2033

Table 5: Global Value (US$ Million) Forecast by End Use, 2018 to 2033

Table 6: Global Volume (Tons) Forecast by End Use, 2018 to 2033

Table 7: North America Value (US$ Million) Forecast by Country, 2018 to 2033

Table 8: North America Volume (Tons) Forecast by Country, 2018 to 2033

Table 9: North America Value (US$ Million) Forecast by Source, 2018 to 2033

Table 10: North America Volume (Tons) Forecast by Source, 2018 to 2033

Table 11: North America Value (US$ Million) Forecast by End Use, 2018 to 2033

Table 12: North America Volume (Tons) Forecast by End Use, 2018 to 2033

Table 13: Latin America Value (US$ Million) Forecast by Country, 2018 to 2033

Table 14: Latin America Volume (Tons) Forecast by Country, 2018 to 2033

Table 15: Latin America Value (US$ Million) Forecast by Source, 2018 to 2033

Table 16: Latin America Volume (Tons) Forecast by Source, 2018 to 2033

Table 17: Latin America Value (US$ Million) Forecast by End Use, 2018 to 2033

Table 18: Latin America Volume (Tons) Forecast by End Use, 2018 to 2033

Table 19: Western Europe Value (US$ Million) Forecast by Country, 2018 to 2033

Table 20: Western Europe Volume (Tons) Forecast by Country, 2018 to 2033

Table 21: Western Europe Value (US$ Million) Forecast by Source, 2018 to 2033

Table 22: Western Europe Volume (Tons) Forecast by Source, 2018 to 2033

Table 23: Western Europe Value (US$ Million) Forecast by End Use, 2018 to 2033

Table 24: Western Europe Volume (Tons) Forecast by End Use, 2018 to 2033

Table 25: Eastern Europe Value (US$ Million) Forecast by Country, 2018 to 2033

Table 26: Eastern Europe Volume (Tons) Forecast by Country, 2018 to 2033

Table 27: Eastern Europe Value (US$ Million) Forecast by Source, 2018 to 2033

Table 28: Eastern Europe Volume (Tons) Forecast by Source, 2018 to 2033

Table 29: Eastern Europe Value (US$ Million) Forecast by End Use, 2018 to 2033

Table 30: Eastern Europe Volume (Tons) Forecast by End Use, 2018 to 2033

Table 31: South Asia and Pacific Value (US$ Million) Forecast by Country, 2018 to 2033

Table 32: South Asia and Pacific Volume (Tons) Forecast by Country, 2018 to 2033

Table 33: South Asia and Pacific Value (US$ Million) Forecast by Source, 2018 to 2033

Table 34: South Asia and Pacific Volume (Tons) Forecast by Source, 2018 to 2033

Table 35: South Asia and Pacific Value (US$ Million) Forecast by End Use, 2018 to 2033

Table 36: South Asia and Pacific Volume (Tons) Forecast by End Use, 2018 to 2033

Table 37: East Asia Value (US$ Million) Forecast by Country, 2018 to 2033

Table 38: East Asia Volume (Tons) Forecast by Country, 2018 to 2033

Table 39: East Asia Value (US$ Million) Forecast by Source, 2018 to 2033

Table 40: East Asia Volume (Tons) Forecast by Source, 2018 to 2033

Table 41: East Asia Value (US$ Million) Forecast by End Use, 2018 to 2033

Table 42: East Asia Volume (Tons) Forecast by End Use, 2018 to 2033

Table 43: Middle East and Africa Value (US$ Million) Forecast by Country, 2018 to 2033

Table 44: Middle East and Africa Volume (Tons) Forecast by Country, 2018 to 2033

Table 45: Middle East and Africa Value (US$ Million) Forecast by Source, 2018 to 2033

Table 46: Middle East and Africa Volume (Tons) Forecast by Source, 2018 to 2033

Table 47: Middle East and Africa Value (US$ Million) Forecast by End Use, 2018 to 2033

Table 48: Middle East and Africa Volume (Tons) Forecast by End Use, 2018 to 2033
Nandini Roy Choudhury

Principal Consultant

Talk to Analyst

Find your sweet spots for generating winning opportunities in this market.

List of Charts

Figure 1: Global Value (US$ Million) by Source, 2023 to 2033

Figure 2: Global Value (US$ Million) by End Use, 2023 to 2033

Figure 3: Global Value (US$ Million) by Region, 2023 to 2033

Figure 4: Global Value (US$ Million) Analysis by Region, 2018 to 2033

Figure 5: Global Volume (Tons) Analysis by Region, 2018 to 2033

Figure 6: Global Value Share (%) and BPS Analysis by Region, 2023 to 2033

Figure 7: Global Y-o-Y Growth (%) Projections by Region, 2023 to 2033

Figure 8: Global Value (US$ Million) Analysis by Source, 2018 to 2033

Figure 9: Global Volume (Tons) Analysis by Source, 2018 to 2033

Figure 10: Global Value Share (%) and BPS Analysis by Source, 2023 to 2033

Figure 11: Global Y-o-Y Growth (%) Projections by Source, 2023 to 2033

Figure 12: Global Value (US$ Million) Analysis by End Use, 2018 to 2033

Figure 13: Global Volume (Tons) Analysis by End Use, 2018 to 2033

Figure 14: Global Value Share (%) and BPS Analysis by End Use, 2023 to 2033

Figure 15: Global Y-o-Y Growth (%) Projections by End Use, 2023 to 2033

Figure 16: Global Attractiveness by Source, 2023 to 2033

Figure 17: Global Attractiveness by End Use, 2023 to 2033

Figure 18: Global Attractiveness by Region, 2023 to 2033

Figure 19: North America Value (US$ Million) by Source, 2023 to 2033

Figure 20: North America Value (US$ Million) by End Use, 2023 to 2033

Figure 21: North America Value (US$ Million) by Country, 2023 to 2033

Figure 22: North America Value (US$ Million) Analysis by Country, 2018 to 2033

Figure 23: North America Volume (Tons) Analysis by Country, 2018 to 2033

Figure 24: North America Value Share (%) and BPS Analysis by Country, 2023 to 2033

Figure 25: North America Y-o-Y Growth (%) Projections by Country, 2023 to 2033

Figure 26: North America Value (US$ Million) Analysis by Source, 2018 to 2033

Figure 27: North America Volume (Tons) Analysis by Source, 2018 to 2033

Figure 28: North America Value Share (%) and BPS Analysis by Source, 2023 to 2033

Figure 29: North America Y-o-Y Growth (%) Projections by Source, 2023 to 2033

Figure 30: North America Value (US$ Million) Analysis by End Use, 2018 to 2033

Figure 31: North America Volume (Tons) Analysis by End Use, 2018 to 2033

Figure 32: North America Value Share (%) and BPS Analysis by End Use, 2023 to 2033

Figure 33: North America Y-o-Y Growth (%) Projections by End Use, 2023 to 2033

Figure 34: North America Attractiveness by Source, 2023 to 2033

Figure 35: North America Attractiveness by End Use, 2023 to 2033

Figure 36: North America Attractiveness by Country, 2023 to 2033

Figure 37: Latin America Value (US$ Million) by Source, 2023 to 2033

Figure 38: Latin America Value (US$ Million) by End Use, 2023 to 2033

Figure 39: Latin America Value (US$ Million) by Country, 2023 to 2033

Figure 40: Latin America Value (US$ Million) Analysis by Country, 2018 to 2033

Figure 41: Latin America Volume (Tons) Analysis by Country, 2018 to 2033

Figure 42: Latin America Value Share (%) and BPS Analysis by Country, 2023 to 2033

Figure 43: Latin America Y-o-Y Growth (%) Projections by Country, 2023 to 2033

Figure 44: Latin America Value (US$ Million) Analysis by Source, 2018 to 2033

Figure 45: Latin America Volume (Tons) Analysis by Source, 2018 to 2033

Figure 46: Latin America Value Share (%) and BPS Analysis by Source, 2023 to 2033

Figure 47: Latin America Y-o-Y Growth (%) Projections by Source, 2023 to 2033

Figure 48: Latin America Value (US$ Million) Analysis by End Use, 2018 to 2033

Figure 49: Latin America Volume (Tons) Analysis by End Use, 2018 to 2033

Figure 50: Latin America Value Share (%) and BPS Analysis by End Use, 2023 to 2033

Figure 51: Latin America Y-o-Y Growth (%) Projections by End Use, 2023 to 2033

Figure 52: Latin America Attractiveness by Source, 2023 to 2033

Figure 53: Latin America Attractiveness by End Use, 2023 to 2033

Figure 54: Latin America Attractiveness by Country, 2023 to 2033

Figure 55: Western Europe Value (US$ Million) by Source, 2023 to 2033

Figure 56: Western Europe Value (US$ Million) by End Use, 2023 to 2033

Figure 57: Western Europe Value (US$ Million) by Country, 2023 to 2033

Figure 58: Western Europe Value (US$ Million) Analysis by Country, 2018 to 2033

Figure 59: Western Europe Volume (Tons) Analysis by Country, 2018 to 2033

Figure 60: Western Europe Value Share (%) and BPS Analysis by Country, 2023 to 2033

Figure 61: Western Europe Y-o-Y Growth (%) Projections by Country, 2023 to 2033

Figure 62: Western Europe Value (US$ Million) Analysis by Source, 2018 to 2033

Figure 63: Western Europe Volume (Tons) Analysis by Source, 2018 to 2033

Figure 64: Western Europe Value Share (%) and BPS Analysis by Source, 2023 to 2033

Figure 65: Western Europe Y-o-Y Growth (%) Projections by Source, 2023 to 2033

Figure 66: Western Europe Value (US$ Million) Analysis by End Use, 2018 to 2033

Figure 67: Western Europe Volume (Tons) Analysis by End Use, 2018 to 2033

Figure 68: Western Europe Value Share (%) and BPS Analysis by End Use, 2023 to 2033

Figure 69: Western Europe Y-o-Y Growth (%) Projections by End Use, 2023 to 2033

Figure 70: Western Europe Attractiveness by Source, 2023 to 2033

Figure 71: Western Europe Attractiveness by End Use, 2023 to 2033

Figure 72: Western Europe Attractiveness by Country, 2023 to 2033

Figure 73: Eastern Europe Value (US$ Million) by Source, 2023 to 2033

Figure 74: Eastern Europe Value (US$ Million) by End Use, 2023 to 2033

Figure 75: Eastern Europe Value (US$ Million) by Country, 2023 to 2033

Figure 76: Eastern Europe Value (US$ Million) Analysis by Country, 2018 to 2033

Figure 77: Eastern Europe Volume (Tons) Analysis by Country, 2018 to 2033

Figure 78: Eastern Europe Value Share (%) and BPS Analysis by Country, 2023 to 2033

Figure 79: Eastern Europe Y-o-Y Growth (%) Projections by Country, 2023 to 2033

Figure 80: Eastern Europe Value (US$ Million) Analysis by Source, 2018 to 2033

Figure 81: Eastern Europe Volume (Tons) Analysis by Source, 2018 to 2033

Figure 82: Eastern Europe Value Share (%) and BPS Analysis by Source, 2023 to 2033

Figure 83: Eastern Europe Y-o-Y Growth (%) Projections by Source, 2023 to 2033

Figure 84: Eastern Europe Value (US$ Million) Analysis by End Use, 2018 to 2033

Figure 85: Eastern Europe Volume (Tons) Analysis by End Use, 2018 to 2033

Figure 86: Eastern Europe Value Share (%) and BPS Analysis by End Use, 2023 to 2033

Figure 87: Eastern Europe Y-o-Y Growth (%) Projections by End Use, 2023 to 2033

Figure 88: Eastern Europe Attractiveness by Source, 2023 to 2033

Figure 89: Eastern Europe Attractiveness by End Use, 2023 to 2033

Figure 90: Eastern Europe Attractiveness by Country, 2023 to 2033

Figure 91: South Asia and Pacific Value (US$ Million) by Source, 2023 to 2033

Figure 92: South Asia and Pacific Value (US$ Million) by End Use, 2023 to 2033

Figure 93: South Asia and Pacific Value (US$ Million) by Country, 2023 to 2033

Figure 94: South Asia and Pacific Value (US$ Million) Analysis by Country, 2018 to 2033

Figure 95: South Asia and Pacific Volume (Tons) Analysis by Country, 2018 to 2033

Figure 96: South Asia and Pacific Value Share (%) and BPS Analysis by Country, 2023 to 2033

Figure 97: South Asia and Pacific Y-o-Y Growth (%) Projections by Country, 2023 to 2033

Figure 98: South Asia and Pacific Value (US$ Million) Analysis by Source, 2018 to 2033

Figure 99: South Asia and Pacific Volume (Tons) Analysis by Source, 2018 to 2033

Figure 100: South Asia and Pacific Value Share (%) and BPS Analysis by Source, 2023 to 2033

Figure 101: South Asia and Pacific Y-o-Y Growth (%) Projections by Source, 2023 to 2033

Figure 102: South Asia and Pacific Value (US$ Million) Analysis by End Use, 2018 to 2033

Figure 103: South Asia and Pacific Volume (Tons) Analysis by End Use, 2018 to 2033

Figure 104: South Asia and Pacific Value Share (%) and BPS Analysis by End Use, 2023 to 2033

Figure 105: South Asia and Pacific Y-o-Y Growth (%) Projections by End Use, 2023 to 2033

Figure 106: South Asia and Pacific Attractiveness by Source, 2023 to 2033

Figure 107: South Asia and Pacific Attractiveness by End Use, 2023 to 2033

Figure 108: South Asia and Pacific Attractiveness by Country, 2023 to 2033

Figure 109: East Asia Value (US$ Million) by Source, 2023 to 2033

Figure 110: East Asia Value (US$ Million) by End Use, 2023 to 2033

Figure 111: East Asia Value (US$ Million) by Country, 2023 to 2033

Figure 112: East Asia Value (US$ Million) Analysis by Country, 2018 to 2033

Figure 113: East Asia Volume (Tons) Analysis by Country, 2018 to 2033

Figure 114: East Asia Value Share (%) and BPS Analysis by Country, 2023 to 2033

Figure 115: East Asia Y-o-Y Growth (%) Projections by Country, 2023 to 2033

Figure 116: East Asia Value (US$ Million) Analysis by Source, 2018 to 2033

Figure 117: East Asia Volume (Tons) Analysis by Source, 2018 to 2033

Figure 118: East Asia Value Share (%) and BPS Analysis by Source, 2023 to 2033

Figure 119: East Asia Y-o-Y Growth (%) Projections by Source, 2023 to 2033

Figure 120: East Asia Value (US$ Million) Analysis by End Use, 2018 to 2033

Figure 121: East Asia Volume (Tons) Analysis by End Use, 2018 to 2033

Figure 122: East Asia Value Share (%) and BPS Analysis by End Use, 2023 to 2033

Figure 123: East Asia Y-o-Y Growth (%) Projections by End Use, 2023 to 2033

Figure 124: East Asia Attractiveness by Source, 2023 to 2033

Figure 125: East Asia Attractiveness by End Use, 2023 to 2033

Figure 126: East Asia Attractiveness by Country, 2023 to 2033

Figure 127: Middle East and Africa Value (US$ Million) by Source, 2023 to 2033

Figure 128: Middle East and Africa Value (US$ Million) by End Use, 2023 to 2033

Figure 129: Middle East and Africa Value (US$ Million) by Country, 2023 to 2033

Figure 130: Middle East and Africa Value (US$ Million) Analysis by Country, 2018 to 2033

Figure 131: Middle East and Africa Volume (Tons) Analysis by Country, 2018 to 2033

Figure 132: Middle East and Africa Value Share (%) and BPS Analysis by Country, 2023 to 2033

Figure 133: Middle East and Africa Y-o-Y Growth (%) Projections by Country, 2023 to 2033

Figure 134: Middle East and Africa Value (US$ Million) Analysis by Source, 2018 to 2033

Figure 135: Middle East and Africa Volume (Tons) Analysis by Source, 2018 to 2033

Figure 136: Middle East and Africa Value Share (%) and BPS Analysis by Source, 2023 to 2033

Figure 137: Middle East and Africa Y-o-Y Growth (%) Projections by Source, 2023 to 2033

Figure 138: Middle East and Africa Value (US$ Million) Analysis by End Use, 2018 to 2033

Figure 139: Middle East and Africa Volume (Tons) Analysis by End Use, 2018 to 2033

Figure 140: Middle East and Africa Value Share (%) and BPS Analysis by End Use, 2023 to 2033

Figure 141: Middle East and Africa Y-o-Y Growth (%) Projections by End Use, 2023 to 2033

Figure 142: Middle East and Africa Attractiveness by Source, 2023 to 2033

Figure 143: Middle East and Africa Attractiveness by End Use, 2023 to 2033

Figure 144: Middle East and Africa Attractiveness by Country, 2023 to 2033

Recommendations

Healthcare

Cell-free Fetal DNA Testing Market

Published : August 2023

Healthcare

Cell Harvesting Systems Market

Published : December 2022

Explore Food and Beverage Insights

View Reports