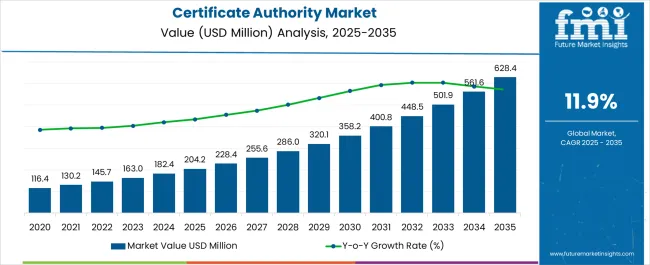
The Certificate Authority Market is estimated to be valued at USD 204.2 million in 2025 and is projected to reach USD 628.4 million by 2035, registering a compound annual growth rate (CAGR) of 11.9% over the forecast period.
| Metric | Value |
|---|---|
| Certificate Authority Market Estimated Value in (2025 E) | USD 204.2 million |
| Certificate Authority Market Forecast Value in (2035 F) | USD 628.4 million |
| Forecast CAGR (2025 to 2035) | 11.9% |
The certificate authority market is witnessing accelerated growth as enterprises prioritize digital trust, secure communication, and regulatory compliance in a rapidly evolving cybersecurity landscape. The proliferation of digital transactions, cloud adoption, and identity-based authentication systems has increased reliance on public key infrastructure (PKI) solutions.
Governments and industry bodies are strengthening encryption standards, driving mandatory implementation of digital certificates across public and private sectors. Additionally, rising threats such as phishing, man-in-the-middle attacks, and data breaches are compelling businesses to secure websites, emails, and software code through authenticated certification.
Demand for automated certificate lifecycle management is also contributing to market expansion, especially among organizations with complex IT environments. As zero trust architecture and remote work policies gain traction, the need for scalable and compliant digital identity assurance solutions continues to grow, shaping future opportunities in both emerging and regulated markets.
The market is segmented by Component, Organization Size, and End-User Vertical and region. By Component, the market is divided into Certificate and Services. In terms of Organization Size, the market is classified into Large Enterprises and Small and Medium-Sized Enterprises. Based on End-User Vertical, the market is segmented into BFSI, Retail, Healthcare, IT and Telecom, and Other. Regionally, the market is classified into North America, Latin America, Western Europe, Eastern Europe, Balkan & Baltic Countries, Russia & Belarus, Central Asia, East Asia, South Asia & Pacific, and the Middle East & Africa.
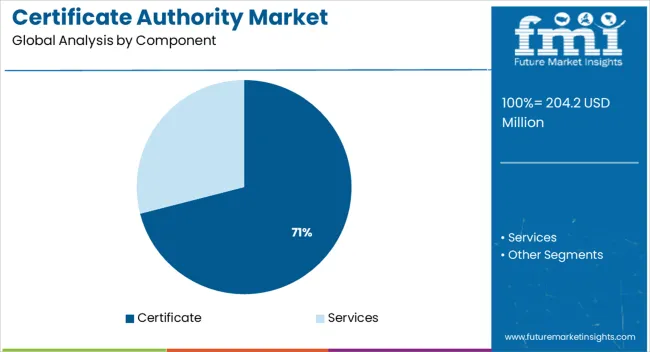
The certificate component segment is expected to account for 71.0% of the overall revenue in the certificate authority market by 2025, making it the most dominant offering. This segment’s leadership is being driven by the core role that digital certificates play in securing web domains, emails, user identities, and device authentication.
With increasing deployment of SSL/TLS, code signing, and client authentication certificates, organizations are prioritizing centralized certificate issuance to ensure trust across digital ecosystems. The demand for EV (Extended Validation) and OV (Organization Validation) certificates has risen as businesses aim to enhance brand credibility and reduce cyber threats.
Moreover, the shift toward machine identities, IoT device validation, and encrypted communication across hybrid IT environments has reinforced the need for high-volume, automated certificate provisioning, further solidifying this segment’s market dominance.
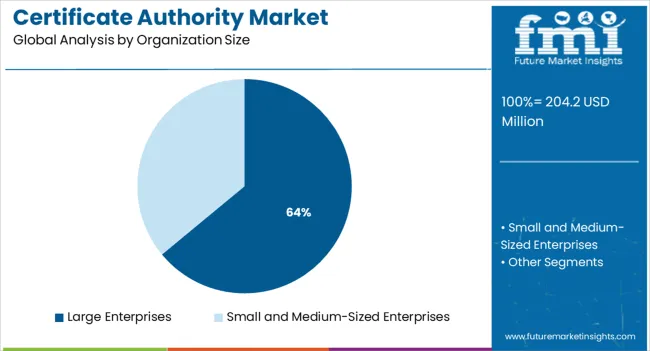
Large enterprises are projected to hold 64.0% of the total market revenue in 2025, positioning them as the leading customer base in the certificate authority ecosystem. This segment's strength is being supported by their expansive digital infrastructure, cross-border operations, and need for advanced encryption capabilities.
The implementation of security frameworks such as ISO 27001, NIST, and GDPR compliance has necessitated enterprise-wide PKI adoption. Large-scale organizations are also investing in dedicated certificate management systems to minimize downtime, avoid certificate expirations, and reduce security risk.
Their higher IT budgets and internal governance models enable deeper integration of PKI across endpoints, applications, and cloud environments. With growing board-level oversight of cybersecurity practices, large enterprises continue to lead demand for scalable, high-assurance digital certificate solutions.
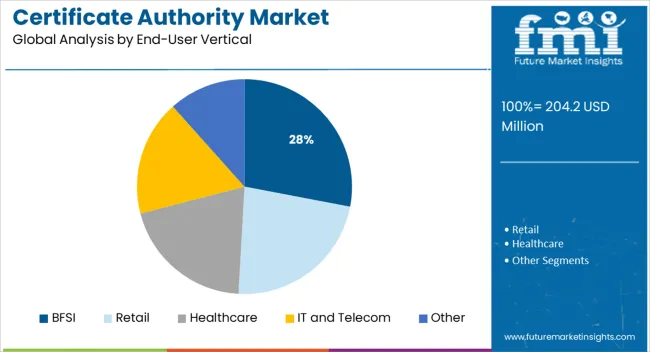
The BFSI sector is expected to contribute 28.0% of the certificate authority market’s revenue in 2025, making it the top-performing end-user vertical. This segment’s prominence is driven by the high regulatory requirements, security sensitivity, and data privacy mandates that define financial services operations.
Institutions in banking, insurance, and capital markets are required to safeguard digital channels, prevent fraud, and authenticate customer interactions—all of which depend on robust certificate-based encryption. The widespread use of online banking, fintech platforms, and mobile payment gateways has further escalated the need for SSL/TLS certificates, digital signatures, and secure email communication.
Additionally, increased adoption of blockchain and open banking frameworks is reinforcing the role of certificate authorities in delivering tamper-proof, real-time verification systems across financial networks.
As per the Global Certificate Authority Market research by Future Market Insights - a market research and competitive intelligence provider, historically, from 2020 to 2024, the market value of the Certificate Authority Market increased at around 12.3% CAGR. With an absolute dollar opportunity of USD 628.4 Million, the market is projected to reach a valuation of USD 450 Million by 2035.
In December 2020, there were around 116.4 Million internet users worldwide, accounting for nearly 58% of the total population. This number increased from more than 4.3 Million in December 2020, when it constituted around 55% of the global population.
Many countries run programs to raise awareness about cybersecurity in an effort to combat this problem. Users' acquaintance with digital signature or identity certificates is increasing as a result of such efforts to increase internet users' knowledge of cybersecurity and secure their access to web content, which is positive for the growth of the certificate authority sector.
Cybercriminals are exploiting the pandemic to launch Hypertext Transfer Protocol Secure phishing attacks. They prey on people in distress by employing social engineering techniques to lure them to scam websites that offer everything from treatments to false information. SpyCloud investigated around 130 thousand COVID-19 or coronavirus-related hostnames and fully qualified domain names.
Around 78.4% of COVID-19 domains were found to use both Hypertext Transfer Protocol and Hypertext Transfer Protocol Secure. Following a brief lull in COVID-19-themed threat activity in the spring and early summer of 2024, pandemic-related phishing attempts increased by 33% in June 2024. Google search volume for Delta variation increased in tandem with the increase in June.
As of February 2024, Google Chrome accounted for around 46% of the market share for all internet browsers in the USA. Google claims that most page loads in Chrome on the majority of operating systems use Hypertext Transfer Protocol Secure rather than Hypertext Transfer Protocol. A Hypertext Transfer Protocol Secure-Only Mode will be available as an option in Google's Chrome web browser.
The new feature, which functions as a toggle on the security settings page, limits access to websites that use the Hypertext Transfer Protocol when it is turned on. Another icon that Google proposes to deploy in place of the padlock is a downward-facing chevron or caret that launches a menu for configuring site permissions and accessing other site data.
In a Google survey with moderately tech-savvy participants, only 11% of respondents properly identified the meaning of the padlock icon. Others thought it was the bookmark icon or favicon for the website. And this is another way to warn visitors that just because a site uses Hypertext Transfer Protocol Secure doesn't mean it is trustworthy.
Many government and private organizations throughout the world carry out their business operations online. Businesses across all industry verticals do not use digital certificates for their websites due to a lack of knowledge of the need for secured websites. The vendors think they do not require security certifications as they do not do any internet business.
However, using the web-based email services offered by these websites is not secure. A user may find it difficult to distinguish between a genuine certificate issued by a trustworthy certificate authority and a phony one. However, a digital certificate can be used to positively identify an organization, object, or person on the other side of a web page or mobile app. Since digital certificates are encrypted, they prevent messages and attachments from being changed or tampered with while being transferred via a website.
In order to certify apps, secure internal servers, and IP addresses that do not need public trust but do need the security offered by Secure Sockets Layer encryption, many firms set up their own certification authority or employ self-signed certificates. Data encryption is possible with self-signed certificates, just like certificates from reputable institutions. The certificate can target visitors' connections since it cannot be revoked, unlike a trustworthy certificate. An attacker may try to set up a phony server to intercept all traffic if a user accepts a self-signed certificate or phish the user for more information.
When clients only need to connect to the server via a local intranet, self-signed certificates are typically utilized, which virtually removes the risk of a man-in-the-middle attack. While developing and testing their apps, organizations also use self-signed certifications.
During the projection period, North America is projected to lead the Certificate Authority Market. The USA and Canada have updated or put into effect new national cybersecurity legislation that will boost the certificate authority sector.
Google has continuously expanded its market share in the certificate authority market with the launch of the Google Cloud Certificate Authority Service. In August 2024, Jetstack, Keyfactor, and Small step also joined the CAS partnership program, joining their partners Venafi and AppViewx. The emergence of a huge number of digital certificate providers as well as stringent data security rules and compliance requirements were the key causes for this.
The country lacks a central federal privacy law like the European Union's General Data Protection Regulation. Instead, there is a variety of vertically focused federal privacy legislation together with new customer-oriented privacy laws in certain states.
Among the laws governing data privacy in the US are the Children's Online Privacy Protection Act, passed in 2000, the Health Insurance Portability and Accountability Act, authorized in 1996, and the USA Privacy Act of 1974.
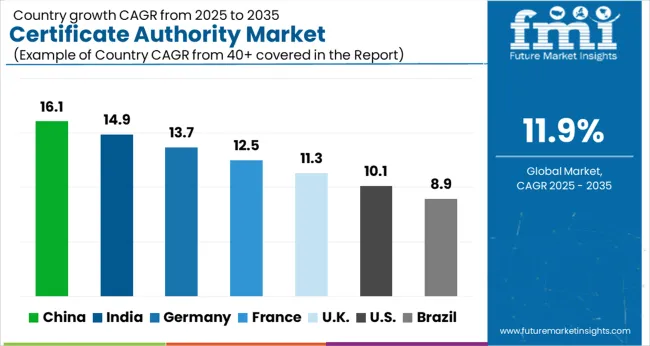
The USA is expected to account for the highest market valued at USD 628.4 Million by the end of 2035. Also, the market in the country is projected to account for an absolute dollar growth of USD 81.1 Million.
The US State Department established the Bureau of Cyberspace and Digital Policy in April 2025 in response to the conflict between Russia and Ukraine as well as a steady stream of threat campaigns and vulnerability releases targeted at the nation.
The bureau's objective is to establish an online defense and privacy-protection policies and recommendations as the Biden administration works to incorporate cybersecurity into American foreign policy. The region's demand for security certificate implementation has increased as a result of these changes.
Market revenue through the healthcare sector is forecasted to grow at a CAGR of over 11.8% from 2025 to 2035. Medical websites and apps should use Secure Sockets Layer encryption since doing so increase the accessibility, affordability, transparency, and cybercrime exposure of healthcare services. After installing Secure Sockets Layer Certificates, every data used in the app or website is encrypted, and only the intended recipient can decrypt it.
The owner of a medical website must ensure that it is Hypertext Transfer Protocol Secure. Choosing the right Secure Sockets Layer certificate should also be a top priority for the Secure Sockets Layer website security of a medical website.
An EV Secure Sockets Layer certificate is suggested since it offers the highest level of validation as well as the encryption required for medical websites. The healthcare industry is considered to account for the highest potential for future growth. A healthcare website must employ digital certificates since hospitals and clinics store massive volumes of private and sensitive data. The healthcare industry has boosted its digitalization initiatives, which will help the certifying authorities' future market expansion potential.
The healthcare sector is increasingly utilizing contemporary technology to provide patients with a customized and user-friendly experience. The expansion strategy of partnerships, mergers, and acquisitions in the healthcare sector vertical has made it more difficult to protect user passwords and other private information.
Medical personnel can protect patient health information on mobile devices like computers and smartphones with the aid of digital certificates. Additionally, the growth in cyberattacks on personally identifiable information is causing healthcare firms to be quite concerned.
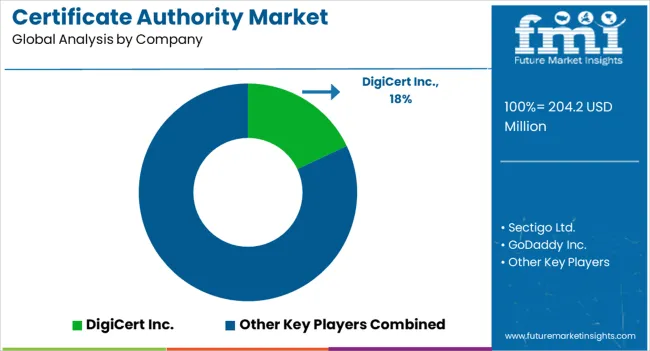
Players in the market are constantly developing improved analytical solutions as well as extending their product offerings. The companies in the Certificate Authority market are focused on their alliances, technology collaborations, and product launch strategies.
Some of the recent developments of key Certificate Authority providers are as follows:
Similarly, recent developments related to companies in Certificate Authority Market have been tracked by the team at Future Market Insights, which are available in the full report.
The global certificate authority market is estimated to be valued at USD 204.2 million in 2025.
The market size for the certificate authority market is projected to reach USD 628.4 million by 2035.
The certificate authority market is expected to grow at a 11.9% CAGR between 2025 and 2035.
The key product types in certificate authority market are certificate, _ssl certificates, _code signing certificates, _secure email certificates, _authentication certificates and services.
In terms of organization size, large enterprises segment to command 64.0% share in the certificate authority market in 2025.


Full Research Suite comprises of:
Market outlook & trends analysis
Interviews & case studies
Strategic recommendations
Vendor profiles & capabilities analysis
5-year forecasts
8 regions and 60+ country-level data splits
Market segment data splits
12 months of continuous data updates
DELIVERED AS:
PDF EXCEL ONLINE
Renewable Energy Certificate Market Size and Share Forecast Outlook 2025 to 2035

Thank you!
You will receive an email from our Business Development Manager. Please be sure to check your SPAM/JUNK folder too.
Chat With
MaRIA