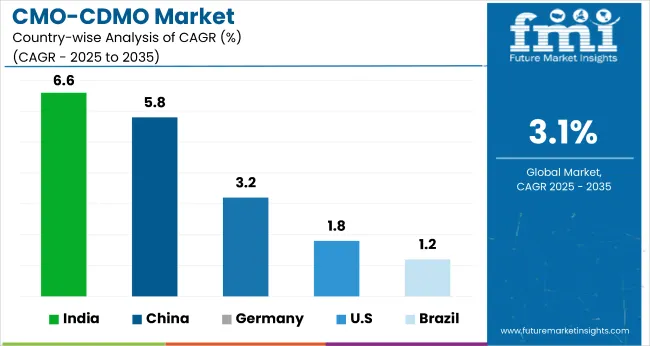
The global contract manufacturing and contract development and manufacturing organization (CMO/CDMO) market is projected to increase from USD 4.02 billion in 2025 to USD 5.46 billion by 2035, growing at a CAGR of 3.1% over the forecast period.
This growth is being driven by rising demand for outsourced pharmaceutical production, driven by cost pressures, supply chain optimization, and the increasing complexity of drug manufacturing. In 2024, momentum was sustained by heightened biologics production and the rapid pace of drug development, particularly in oncology, rare diseases, and gene therapies.
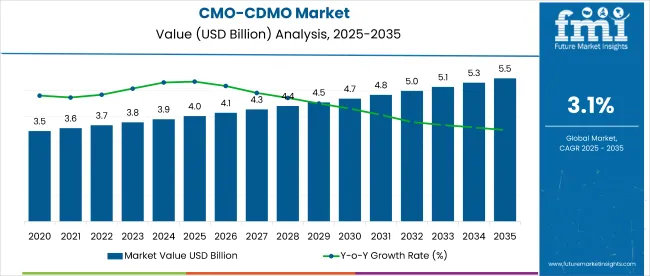
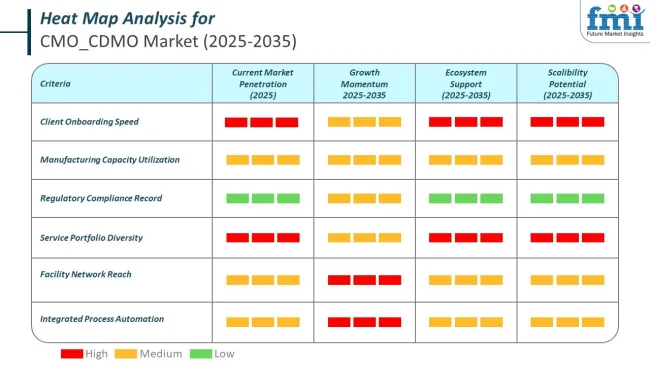
By 2025, more pharmaceutical and biotech companies are expected to outsource end-to-end services-from early-stage development to commercial-scale production. CDMOs are being chosen not only for capacity but also for their expertise in navigating regulatory landscapes. Accelerated drug approval pathways and increased FDA and EMA engagement have made regulatory support a valuable CDMO differentiator.
Additionally, smaller biotech firms with limited infrastructure are increasingly relying on CDMOs to manage formulation, clinical packaging, and technology transfer, which is reinforcing outsourcing models across developed and emerging markets.
Recent industry developments have focused on expanding bio manufacturing capacity and integrating advanced technologies. In 2025, several CDMOs have adopted continuous manufacturing systems to reduce production time and improve batch consistency. AI-driven process development and digital twins have been introduced to model production outcomes and optimize scale-up efficiency. Green chemistry protocols and solvent recovery systems are being implemented to enhance environmental compliance. These innovations are helping CDMOs meet ESG expectations while improving operational agility.
In 2025, Thermo Fisher committed USD 2 billion to USA operations, expanding its St. Louis biologics site with four 5,000L bioreactors and launching the Accelerator™ platform to streamline preclinical-to-commercial services. Catalent partnered with Galapagos for decentralized CAR-T manufacturing in the USA and worked with Silexion Therapeutics on siRNA therapy production in France.
Lonza implemented the One Lonza model, organizing its CDMO business into three platforms-Integrated Biologics, Advanced Synthesis, and Specialized Modalities-while forecasting 20% CER sales growth and a near-30% CORE EBITDA margin in 2025. These developments highlight a shift toward specialized, tech-enabled, and sustainable CDMO operations globally.
The CMO/CDMO (Contract Manufacturing Organization/Contract Development and Manufacturing Organization) market is governed by strict regulatory frameworks due to its central role in pharmaceutical and biologics production. Regulations ensure quality, safety, traceability, and compliance in manufacturing processes across regions. Both national and international bodies set standards that CMOs and CDMOs must meet to remain operational and competitive.
Global harmonization efforts, such as those led by ICH and PIC/S, are pushing companies to standardize practices. CMOs/CDMOs are required to undergo routine audits, maintain traceability records, and ensure secure data integrity throughout the manufacturing lifecycle.
Top companies in the CMO/CDMO market are actively complying with global regulatory mandates by enhancing manufacturing transparency, investing in quality systems, and aligning with multi-region GMP standards. These efforts ensure that they can serve diverse markets while avoiding penalties or delays related to regulatory non-compliance.
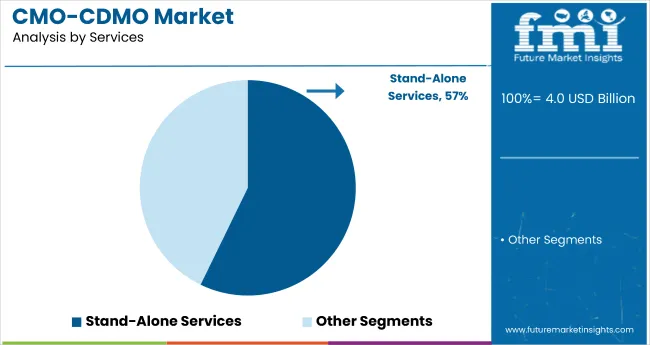
Stand-alone services captured 57.2% of the global CMO/CDMO market in 2025, as brands increasingly outsource key functions like labeling, packaging, and quality testing. This flexible model allows for cost savings and fast commercialization without full-scale production investment. Fareva, Intercos Group, and Cosmetic Solutions LLC are leaders in delivering specialized, high-margin services across North America and Europe.
In Asia-Pacific, players like Kolmar Korea are expanding through low-cost offerings and growing beauty exports. Future trends will include blockchain traceability, AI-integrated quality systems, and ESG scoring to align with global compliance needs.
With a 42.8% market share in 2025, scale-up and tech transfer services are essential for smooth transitions from lab-scale development to full production. These services ensure consistency and regulatory alignment, especially for clean beauty and biotech-based products.
Leaders like Albéa Group, Viva Group, and Strand Cosmetics Europe are adopting digital twin simulations and predictive automation. Asia-Pacific is growing, with firms like COSMAX forming strategic manufacturing alliances. Innovation in real-time analytics, AI-driven process control, and automated documentation will further drive efficiency, reduce costs, and enhance global scalability in this critical segment.
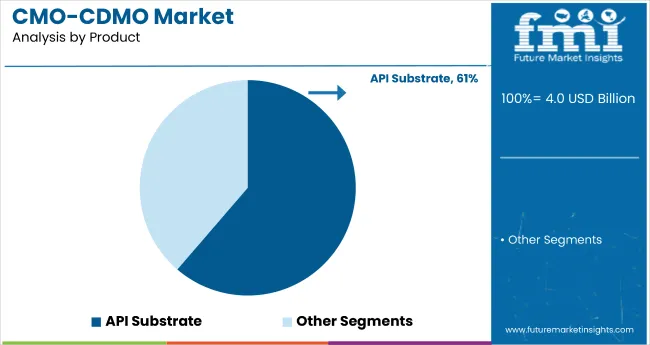
API substrates held the top spot in 2025, making up 61.3% of the CMO/CDMO product market. These ingredients are vital for compliant, effective formulations in both pharma and personal care. North America and Europe dominate due to high manufacturing standards, supported by companies like Lonza Group, BASF Personal Care, and Symrise AG. Asia-Pacific is catching up, with Nikko Chemicals and INOLEX investing in API expansion and export capabilities. Industry trends include bio-based APIs, green synthesis pathways, and blockchain-enhanced supply transparency to support clean-label, ethical product demands.
Small molecules represented 38.7% of the market in 2025, favored for their adaptability, cost-efficiency, and wide application in skin care and therapeutics. Commonly used in anti-aging, acne, and targeted drug delivery systems, they are central to product innovation.
Leaders such as Evonik Industries, Cambrex Corporation, Ashland Global, and Alfa Chemistry are pioneering AI-assisted design and sustainable synthesis methods. Asia-Pacific players like Asymchem Laboratories are also increasing small-molecule capacity. The future includes higher precision in molecule engineering, eco-friendly processing, and broader use in personalized formulations.
Challenges
High Cost Manufacturing Pose a Challenge to the Market
High costs associated with investment of Contract manufacturing poses a challenge in the growth of this market. For instance, Biopharmaceuticals manufacturing capacity is tight across the industry regardless of the location. Globally, biopharma companies have spent over USD 50 Billion in just past five years on setting up new plants and procuring equipment.
Much of that has been in tax havens, like Ireland and Singapore, and in emerging markets. Lack of highly skilled and experienced professional hampers the CMOs growth. In order to develop the economy, the emerging region requires skilled professionals. Many companies have reported a sizable gap between the skilled professionals and the current workforce.
Opportunities
Manufacturing Facilities of Biologics and Biosimilar Opens up the Market Opportunity
Novel biologic and biosimilar manufacturing present strong growth opportunities. In addition, scientific advancements in the biopharmaceuticals are boosting the opportunities for the technologically advanced CDMOs with potential capabilities.
Moreover, adoption of CDMO and CMO business model in terms of product offering and reduction in operational cost is likely to provide opportunity to grow. Focusing on reduction in operating costs through outsourcing of R&D and commercialization of biopharmaceuticals to CMOs/CDMOs could increase operational efficiency.
Scaling up Flexible and Modular Manufacturing Facilities: To survive in the market, CMOs and CDMOs are adopting modular, flexible cleanroom layouts and single-use bioprocessing equipment. These arrangements make it simpler to scale up manufacturing in a rapid way, especially for small-volume biologics and customized medications, to assist manufacturers in addressing evolving market requirements more effectively.
Regulatory and Policy Developments: With regulatory bodies such as the FDA, EMA, and WHO cracking down, CMOs and CDMOs are going all out to comply. They're leveraging blockchain and digital manufacturing records to enhance transparency, integrity of data, and compliance with tighter supply chain demands.
Increased Outsourcing Manufacturing: Pharmaceutical and biotech firms are increasingly contracting out their production and development work to CMOs and CDMOs in order to reduce costs, tap into specialized know-how, and concentrate on core business. Through collaborations with contract manufacturers, these firms escape the large capital outlays needed to establish and run their own plants while enjoying cutting-edge manufacturing capability without shouldering the entire financial load.
Sustainability in Pharmaceutical Manufacturing: CMOs and CDMOs are also focusing on sustainability in pharmaceutical production. They are adopting green chemistry, carbon-neutral bioprocessing, and waste reduction techniques to meet worldwide environmental objectives.
Most firms are also investing in sustainable process technologies, energy-efficient cleanrooms, and reusable single-use bioprocessing materials. They are also incorporating renewable energy sources into manufacturing facilities to reduce carbon footprints and encourage environmentally friendly manufacturing processes.
Between 2020 and 2024, large contracts with local and global pharmaceutical companies were created during the decade, resulting in a flourishing market for drug development and manufacturing outsourcing. With time, such advancements led to reduced market times for new products and cost savings in operations. Growing demand for biologics and biosimilars, along with their complexity, presented newer business opportunities for CDMOs capable of manufacturing such biologics.
Alternatively, the demand for adaptable manufacturing solutions grew stronger with the newer trend of high-value small batch drugs like orphan drugs and personal medicines. Therefore, anticipating towards the year 2025 and beyond to 2035, the market is likely to be supported even more by the commercialization of precision medicine and gene therapies. The emerging technologies will challenge CDMOs to adopt new manufacturing processes and to keep up with even more evolving regulatory requirements.
Growing markets will also play an important role as pharma companies will seek to diversify their supply chains and expand access to quality medicines worldwide. Further, sustainability will receive more attention, and CDMOs will transition to greener methods such as carbon-neutral production and environmentally friendly ways of producing to address mounting demands from both regulators and environmentally aware consumers in common.
Marek Outlook
Mergers and acquisitions activities among USA manufacturers play a major role to expand the business in the region which will create opportunities in the forecast period. Moreover, the growing trend headed for multi‑drug manufacturing facilities with the production of different biopharmaceutical therapeutics will leads to increase preference of the single -use (disposable) bioreactors in the biopharmaceutical CDMOs industry in the region.
Market Growth Factors
Market Forecast
| Country | CAGR (2025 to 2035) |
|---|---|
| USA | 1.8% |
Market Outlook
The market in the Germany is set to witness an increase in demand due to rising areas for gene and cell therapy. Moreover, manufacturers focus on strategic global presence, specialized expertise with exclusive technological capabilities and deliver world-class biopharmaceuticals contract development and manufacturing services to pharmaceutical and biotechnology industry.
Market Growth Factors
Market Forecast
| Country | CAGR (2025 to 2035) |
|---|---|
| Germany | 3.2% |
Market Outlook
China is expected to be the most lucrative country in East Asia market due to wide range of developmental services from cell line development to initial clinical trials including cell line development, process development, and formulation analysis methodology.
Market Growth Factors
Market Forecast
| Country | CAGR (2025 to 2035) |
|---|---|
| China | 5.8% |
Market Outlook
The current growth of India's CMO/CDMO industry is heightened by the burgeoning pharmaceutical sector in the country complemented by inexpensive manufacturing sites and skilled manpower resources so that both local and international pharmaceuticals would flock to this place. This nation has been established as a global hub for API production, generic, and bio-similars.
An ongoing trend that fuels the development of advanced manufacturing services is the increased focus on biologicals, cell, and gene therapies. To make their ground stronger in high-value drug production, Indian CMOs and CDMOs are investing in new world-class facilities and implementing global GMP standards.
Market Growth Factors
Market Forecast
| Country | CAGR (2025 to 2035) |
|---|---|
| India | 6.6% |
Market Outlook
The market of Brazil CMO/CDMOs is booming and a vast area of development as demand for biosimilars, biologics, and complicated formulations grows. Improving health infrastructure in Brazil is coupled with government incentives affecting investments into biopharmaceutical manufacturing facilities. Brazilian CDMOs and CMOs are augmenting their capacity for developing cell and gene therapies alongside international regulatory standards compliance.
Market Growth Factors
Market Forecast
| Country | CAGR (2025 to 2035) |
|---|---|
| Brazil | 1.2% |
The CMO/CDMO (Contract Manufacturing Organization/Contract Development and Manufacturing Organization) market is very competitive, fueled by growing pharmaceutical outsourcing demand, technological improvements in biopharmaceutical manufacturing, and increasing drug development complexity.
Businesses are spending money on versatile manufacturing capabilities, innovative biologics manufacturing, and end-to-end development capabilities to stay ahead of the competition. The market is influenced by established global CDMOs, niche biotech manufacturers, and new contract service providers, all of which contribute to the changing landscape of outsourced drug production.
Other Key Players (53.7% Combined)
Beyond the leading companies, several other manufacturers contribute significantly to the market, enhancing service diversity and technological advancements. These include:
| Report Attributes | Details |
|---|---|
| Current Total Market Size (2025) | USD 4.02 billion |
| Projected Market Size (2035) | USD 5.46 billion |
| CAGR (2025 to 2035) | 3.1% |
| Base Year for Estimation | 2024 |
| Historical Period | 2020 to 2024 |
| Projections Period | 2025 to 2035 |
| Quantitative Units | USD billion for value and Thousands of batch volumes for production capacity |
| Services Analyzed (Segment 1) | Stand-Alone Services, Integrated Development, Scale-Up and Tech Transfer, Technology and Innovation, Quality Control and Quality Assurance, Regulatory Assistance |
| Products Analyzed (Segment 2) | API Substrate, Large Molecule, Small Molecule |
| Expression Systems Analyzed (Segment 3) | Mammalian, Microbial |
| Company Sizes Analyzed (Segment 4) | Small, Mid-sized, Large, Very Large |
| Scale of Operations Analyzed (Segment 5) | Preclinical, Clinical, Commercial |
| Regions Covered | North America; Latin America; Western Europe; Eastern Europe; South Asia and Pacific; East Asia; Middle East & Africa |
| Countries Covered | United States, Canada, Germany, United Kingdom, France, Japan, China, India, South Korea, Brazil |
| Key Players Influencing the Market | Catalent, Patheon N.V. (ThermoFisher Scientific), Samsung Biologics, FujiFilm Diosynth, Lonza, Wuxi Biologics, BioXcellence (Boehringer Ingelheim), KBI Biopharma (JSR LifeScience), Abbvie CMO Manufacturing, Pfizer Center One, Emergent BioSolutions Inc., Rentschler Biopharma SE, AGC Biologics, Sterling Pharma Solutions |
| Additional Attributes | Rise in biologics outsourcing, Demand for GMP-certified scalable platforms, Strong preference for flexible and modular contract development |
| Customization and Pricing | Customization and Pricing Available on Request |
Stand-Alone Services, Integrated Development, Scale-Up and Tech Transfer, Technology and Innovation, Quality Control and Quality Assurance, Regulatory Assistance
API substrate, Large Molecule and Small Molecule
Mammalian, and Microbial
Small, Mid sized, Large and Very Large
Preclinical, Clinical and Commercial
North America, Latin America, East Asia, South Asia & Pacific, Western Europe, Eastern Europe, Middle East & Africa
The overall market size for CMO/CDMO market was USD 4.02 billion in 2025.
The CMO/CDMO Market is expected to reach USD 5.46 billion in 2035.
Growing demand for biologics and complex therapies has driven pharmaceutical companies to increasingly rely on specialized CDMO services.
The top key players that drives the development of CMO/CDMO market are Qiagen, Thermo Fisher Scientific, Promega Corporation, Takara Bio Inc., and Bioneer Corporation
API Substrate in product type of CMO/CDMO market is expected to command significant share over the assessment period.
Table 1: Global Market Value (US$ Million) Forecast by Region, 2018 to 2033
Table 2: Global Market Volume (Units) Forecast by Region, 2018 to 2033
Table 3: Global Market Value (US$ Million) Forecast by Service, 2018 to 2033
Table 4: Global Market Volume (Units) Forecast by Service, 2018 to 2033
Table 5: Global Market Value (US$ Million) Forecast by Product, 2018 to 2033
Table 6: Global Market Volume (Units) Forecast by Product, 2018 to 2033
Table 7: Global Market Value (US$ Million) Forecast by Form, 2018 to 2033
Table 8: Global Market Volume (Units) Forecast by Form, 2018 to 2033
Table 9: North America Market Value (US$ Million) Forecast by Country, 2018 to 2033
Table 10: North America Market Volume (Units) Forecast by Country, 2018 to 2033
Table 11: North America Market Value (US$ Million) Forecast by Service, 2018 to 2033
Table 12: North America Market Volume (Units) Forecast by Service, 2018 to 2033
Table 13: North America Market Value (US$ Million) Forecast by Product, 2018 to 2033
Table 14: North America Market Volume (Units) Forecast by Product, 2018 to 2033
Table 15: North America Market Value (US$ Million) Forecast by Form, 2018 to 2033
Table 16: North America Market Volume (Units) Forecast by Form, 2018 to 2033
Table 17: Latin America Market Value (US$ Million) Forecast by Country, 2018 to 2033
Table 18: Latin America Market Volume (Units) Forecast by Country, 2018 to 2033
Table 19: Latin America Market Value (US$ Million) Forecast by Service, 2018 to 2033
Table 20: Latin America Market Volume (Units) Forecast by Service, 2018 to 2033
Table 21: Latin America Market Value (US$ Million) Forecast by Product, 2018 to 2033
Table 22: Latin America Market Volume (Units) Forecast by Product, 2018 to 2033
Table 23: Latin America Market Value (US$ Million) Forecast by Form, 2018 to 2033
Table 24: Latin America Market Volume (Units) Forecast by Form, 2018 to 2033
Table 25: Europe Market Value (US$ Million) Forecast by Country, 2018 to 2033
Table 26: Europe Market Volume (Units) Forecast by Country, 2018 to 2033
Table 27: Europe Market Value (US$ Million) Forecast by Service, 2018 to 2033
Table 28: Europe Market Volume (Units) Forecast by Service, 2018 to 2033
Table 29: Europe Market Value (US$ Million) Forecast by Product, 2018 to 2033
Table 30: Europe Market Volume (Units) Forecast by Product, 2018 to 2033
Table 31: Europe Market Value (US$ Million) Forecast by Form, 2018 to 2033
Table 32: Europe Market Volume (Units) Forecast by Form, 2018 to 2033
Table 33: Asia Pacific Market Value (US$ Million) Forecast by Country, 2018 to 2033
Table 34: Asia Pacific Market Volume (Units) Forecast by Country, 2018 to 2033
Table 35: Asia Pacific Market Value (US$ Million) Forecast by Service, 2018 to 2033
Table 36: Asia Pacific Market Volume (Units) Forecast by Service, 2018 to 2033
Table 37: Asia Pacific Market Value (US$ Million) Forecast by Product, 2018 to 2033
Table 38: Asia Pacific Market Volume (Units) Forecast by Product, 2018 to 2033
Table 39: Asia Pacific Market Value (US$ Million) Forecast by Form, 2018 to 2033
Table 40: Asia Pacific Market Volume (Units) Forecast by Form, 2018 to 2033
Table 41: MEA Market Value (US$ Million) Forecast by Country, 2018 to 2033
Table 42: MEA Market Volume (Units) Forecast by Country, 2018 to 2033
Table 43: MEA Market Value (US$ Million) Forecast by Service, 2018 to 2033
Table 44: MEA Market Volume (Units) Forecast by Service, 2018 to 2033
Table 45: MEA Market Value (US$ Million) Forecast by Product, 2018 to 2033
Table 46: MEA Market Volume (Units) Forecast by Product, 2018 to 2033
Table 47: MEA Market Value (US$ Million) Forecast by Form, 2018 to 2033
Table 48: MEA Market Volume (Units) Forecast by Form, 2018 to 2033
Figure 1: Global Market Value (US$ Million) by Service, 2023 to 2033
Figure 2: Global Market Value (US$ Million) by Product, 2023 to 2033
Figure 3: Global Market Value (US$ Million) by Form, 2023 to 2033
Figure 4: Global Market Value (US$ Million) by Region, 2023 to 2033
Figure 5: Global Market Value (US$ Million) Analysis by Region, 2018 to 2033
Figure 6: Global Market Volume (Units) Analysis by Region, 2018 to 2033
Figure 7: Global Market Value Share (%) and BPS Analysis by Region, 2023 to 2033
Figure 8: Global Market Y-o-Y Growth (%) Projections by Region, 2023 to 2033
Figure 9: Global Market Value (US$ Million) Analysis by Service, 2018 to 2033
Figure 10: Global Market Volume (Units) Analysis by Service, 2018 to 2033
Figure 11: Global Market Value Share (%) and BPS Analysis by Service, 2023 to 2033
Figure 12: Global Market Y-o-Y Growth (%) Projections by Service, 2023 to 2033
Figure 13: Global Market Value (US$ Million) Analysis by Product, 2018 to 2033
Figure 14: Global Market Volume (Units) Analysis by Product, 2018 to 2033
Figure 15: Global Market Value Share (%) and BPS Analysis by Product, 2023 to 2033
Figure 16: Global Market Y-o-Y Growth (%) Projections by Product, 2023 to 2033
Figure 17: Global Market Value (US$ Million) Analysis by Form, 2018 to 2033
Figure 18: Global Market Volume (Units) Analysis by Form, 2018 to 2033
Figure 19: Global Market Value Share (%) and BPS Analysis by Form, 2023 to 2033
Figure 20: Global Market Y-o-Y Growth (%) Projections by Form, 2023 to 2033
Figure 21: Global Market Attractiveness by Service, 2023 to 2033
Figure 22: Global Market Attractiveness by Product, 2023 to 2033
Figure 23: Global Market Attractiveness by Form, 2023 to 2033
Figure 24: Global Market Attractiveness by Region, 2023 to 2033
Figure 25: North America Market Value (US$ Million) by Service, 2023 to 2033
Figure 26: North America Market Value (US$ Million) by Product, 2023 to 2033
Figure 27: North America Market Value (US$ Million) by Form, 2023 to 2033
Figure 28: North America Market Value (US$ Million) by Country, 2023 to 2033
Figure 29: North America Market Value (US$ Million) Analysis by Country, 2018 to 2033
Figure 30: North America Market Volume (Units) Analysis by Country, 2018 to 2033
Figure 31: North America Market Value Share (%) and BPS Analysis by Country, 2023 to 2033
Figure 32: North America Market Y-o-Y Growth (%) Projections by Country, 2023 to 2033
Figure 33: North America Market Value (US$ Million) Analysis by Service, 2018 to 2033
Figure 34: North America Market Volume (Units) Analysis by Service, 2018 to 2033
Figure 35: North America Market Value Share (%) and BPS Analysis by Service, 2023 to 2033
Figure 36: North America Market Y-o-Y Growth (%) Projections by Service, 2023 to 2033
Figure 37: North America Market Value (US$ Million) Analysis by Product, 2018 to 2033
Figure 38: North America Market Volume (Units) Analysis by Product, 2018 to 2033
Figure 39: North America Market Value Share (%) and BPS Analysis by Product, 2023 to 2033
Figure 40: North America Market Y-o-Y Growth (%) Projections by Product, 2023 to 2033
Figure 41: North America Market Value (US$ Million) Analysis by Form, 2018 to 2033
Figure 42: North America Market Volume (Units) Analysis by Form, 2018 to 2033
Figure 43: North America Market Value Share (%) and BPS Analysis by Form, 2023 to 2033
Figure 44: North America Market Y-o-Y Growth (%) Projections by Form, 2023 to 2033
Figure 45: North America Market Attractiveness by Service, 2023 to 2033
Figure 46: North America Market Attractiveness by Product, 2023 to 2033
Figure 47: North America Market Attractiveness by Form, 2023 to 2033
Figure 48: North America Market Attractiveness by Country, 2023 to 2033
Figure 49: Latin America Market Value (US$ Million) by Service, 2023 to 2033
Figure 50: Latin America Market Value (US$ Million) by Product, 2023 to 2033
Figure 51: Latin America Market Value (US$ Million) by Form, 2023 to 2033
Figure 52: Latin America Market Value (US$ Million) by Country, 2023 to 2033
Figure 53: Latin America Market Value (US$ Million) Analysis by Country, 2018 to 2033
Figure 54: Latin America Market Volume (Units) Analysis by Country, 2018 to 2033
Figure 55: Latin America Market Value Share (%) and BPS Analysis by Country, 2023 to 2033
Figure 56: Latin America Market Y-o-Y Growth (%) Projections by Country, 2023 to 2033
Figure 57: Latin America Market Value (US$ Million) Analysis by Service, 2018 to 2033
Figure 58: Latin America Market Volume (Units) Analysis by Service, 2018 to 2033
Figure 59: Latin America Market Value Share (%) and BPS Analysis by Service, 2023 to 2033
Figure 60: Latin America Market Y-o-Y Growth (%) Projections by Service, 2023 to 2033
Figure 61: Latin America Market Value (US$ Million) Analysis by Product, 2018 to 2033
Figure 62: Latin America Market Volume (Units) Analysis by Product, 2018 to 2033
Figure 63: Latin America Market Value Share (%) and BPS Analysis by Product, 2023 to 2033
Figure 64: Latin America Market Y-o-Y Growth (%) Projections by Product, 2023 to 2033
Figure 65: Latin America Market Value (US$ Million) Analysis by Form, 2018 to 2033
Figure 66: Latin America Market Volume (Units) Analysis by Form, 2018 to 2033
Figure 67: Latin America Market Value Share (%) and BPS Analysis by Form, 2023 to 2033
Figure 68: Latin America Market Y-o-Y Growth (%) Projections by Form, 2023 to 2033
Figure 69: Latin America Market Attractiveness by Service, 2023 to 2033
Figure 70: Latin America Market Attractiveness by Product, 2023 to 2033
Figure 71: Latin America Market Attractiveness by Form, 2023 to 2033
Figure 72: Latin America Market Attractiveness by Country, 2023 to 2033
Figure 73: Europe Market Value (US$ Million) by Service, 2023 to 2033
Figure 74: Europe Market Value (US$ Million) by Product, 2023 to 2033
Figure 75: Europe Market Value (US$ Million) by Form, 2023 to 2033
Figure 76: Europe Market Value (US$ Million) by Country, 2023 to 2033
Figure 77: Europe Market Value (US$ Million) Analysis by Country, 2018 to 2033
Figure 78: Europe Market Volume (Units) Analysis by Country, 2018 to 2033
Figure 79: Europe Market Value Share (%) and BPS Analysis by Country, 2023 to 2033
Figure 80: Europe Market Y-o-Y Growth (%) Projections by Country, 2023 to 2033
Figure 81: Europe Market Value (US$ Million) Analysis by Service, 2018 to 2033
Figure 82: Europe Market Volume (Units) Analysis by Service, 2018 to 2033
Figure 83: Europe Market Value Share (%) and BPS Analysis by Service, 2023 to 2033
Figure 84: Europe Market Y-o-Y Growth (%) Projections by Service, 2023 to 2033
Figure 85: Europe Market Value (US$ Million) Analysis by Product, 2018 to 2033
Figure 86: Europe Market Volume (Units) Analysis by Product, 2018 to 2033
Figure 87: Europe Market Value Share (%) and BPS Analysis by Product, 2023 to 2033
Figure 88: Europe Market Y-o-Y Growth (%) Projections by Product, 2023 to 2033
Figure 89: Europe Market Value (US$ Million) Analysis by Form, 2018 to 2033
Figure 90: Europe Market Volume (Units) Analysis by Form, 2018 to 2033
Figure 91: Europe Market Value Share (%) and BPS Analysis by Form, 2023 to 2033
Figure 92: Europe Market Y-o-Y Growth (%) Projections by Form, 2023 to 2033
Figure 93: Europe Market Attractiveness by Service, 2023 to 2033
Figure 94: Europe Market Attractiveness by Product, 2023 to 2033
Figure 95: Europe Market Attractiveness by Form, 2023 to 2033
Figure 96: Europe Market Attractiveness by Country, 2023 to 2033
Figure 97: Asia Pacific Market Value (US$ Million) by Service, 2023 to 2033
Figure 98: Asia Pacific Market Value (US$ Million) by Product, 2023 to 2033
Figure 99: Asia Pacific Market Value (US$ Million) by Form, 2023 to 2033
Figure 100: Asia Pacific Market Value (US$ Million) by Country, 2023 to 2033
Figure 101: Asia Pacific Market Value (US$ Million) Analysis by Country, 2018 to 2033
Figure 102: Asia Pacific Market Volume (Units) Analysis by Country, 2018 to 2033
Figure 103: Asia Pacific Market Value Share (%) and BPS Analysis by Country, 2023 to 2033
Figure 104: Asia Pacific Market Y-o-Y Growth (%) Projections by Country, 2023 to 2033
Figure 105: Asia Pacific Market Value (US$ Million) Analysis by Service, 2018 to 2033
Figure 106: Asia Pacific Market Volume (Units) Analysis by Service, 2018 to 2033
Figure 107: Asia Pacific Market Value Share (%) and BPS Analysis by Service, 2023 to 2033
Figure 108: Asia Pacific Market Y-o-Y Growth (%) Projections by Service, 2023 to 2033
Figure 109: Asia Pacific Market Value (US$ Million) Analysis by Product, 2018 to 2033
Figure 110: Asia Pacific Market Volume (Units) Analysis by Product, 2018 to 2033
Figure 111: Asia Pacific Market Value Share (%) and BPS Analysis by Product, 2023 to 2033
Figure 112: Asia Pacific Market Y-o-Y Growth (%) Projections by Product, 2023 to 2033
Figure 113: Asia Pacific Market Value (US$ Million) Analysis by Form, 2018 to 2033
Figure 114: Asia Pacific Market Volume (Units) Analysis by Form, 2018 to 2033
Figure 115: Asia Pacific Market Value Share (%) and BPS Analysis by Form, 2023 to 2033
Figure 116: Asia Pacific Market Y-o-Y Growth (%) Projections by Form, 2023 to 2033
Figure 117: Asia Pacific Market Attractiveness by Service, 2023 to 2033
Figure 118: Asia Pacific Market Attractiveness by Product, 2023 to 2033
Figure 119: Asia Pacific Market Attractiveness by Form, 2023 to 2033
Figure 120: Asia Pacific Market Attractiveness by Country, 2023 to 2033
Figure 121: MEA Market Value (US$ Million) by Service, 2023 to 2033
Figure 122: MEA Market Value (US$ Million) by Product, 2023 to 2033
Figure 123: MEA Market Value (US$ Million) by Form, 2023 to 2033
Figure 124: MEA Market Value (US$ Million) by Country, 2023 to 2033
Figure 125: MEA Market Value (US$ Million) Analysis by Country, 2018 to 2033
Figure 126: MEA Market Volume (Units) Analysis by Country, 2018 to 2033
Figure 127: MEA Market Value Share (%) and BPS Analysis by Country, 2023 to 2033
Figure 128: MEA Market Y-o-Y Growth (%) Projections by Country, 2023 to 2033
Figure 129: MEA Market Value (US$ Million) Analysis by Service, 2018 to 2033
Figure 130: MEA Market Volume (Units) Analysis by Service, 2018 to 2033
Figure 131: MEA Market Value Share (%) and BPS Analysis by Service, 2023 to 2033
Figure 132: MEA Market Y-o-Y Growth (%) Projections by Service, 2023 to 2033
Figure 133: MEA Market Value (US$ Million) Analysis by Product, 2018 to 2033
Figure 134: MEA Market Volume (Units) Analysis by Product, 2018 to 2033
Figure 135: MEA Market Value Share (%) and BPS Analysis by Product, 2023 to 2033
Figure 136: MEA Market Y-o-Y Growth (%) Projections by Product, 2023 to 2033
Figure 137: MEA Market Value (US$ Million) Analysis by Form, 2018 to 2033
Figure 138: MEA Market Volume (Units) Analysis by Form, 2018 to 2033
Figure 139: MEA Market Value Share (%) and BPS Analysis by Form, 2023 to 2033
Figure 140: MEA Market Y-o-Y Growth (%) Projections by Form, 2023 to 2033
Figure 141: MEA Market Attractiveness by Service, 2023 to 2033
Figure 142: MEA Market Attractiveness by Product, 2023 to 2033
Figure 143: MEA Market Attractiveness by Form, 2023 to 2033
Figure 144: MEA Market Attractiveness by Country, 2023 to 2033


Full Research Suite comprises of:
Market outlook & trends analysis
Interviews & case studies
Strategic recommendations
Vendor profiles & capabilities analysis
5-year forecasts
8 regions and 60+ country-level data splits
Market segment data splits
12 months of continuous data updates
DELIVERED AS:
PDF EXCEL ONLINE

Thank you!
You will receive an email from our Business Development Manager. Please be sure to check your SPAM/JUNK folder too.
Chat With
MaRIA