Co-Emulsifiers Market Size and Share Forecast Outlook 2025 to 2035

The Co-Emulsifiers Market is expected to record a valuation of USD 2,304.2 million in 2025 and USD 4,801.2 million in 2035, with an increase of USD 2,497.0 million, which equals a growth of 108% over the decade. The overall expansion represents a CAGR of 7.6% and a near 2.1X increase in market size.
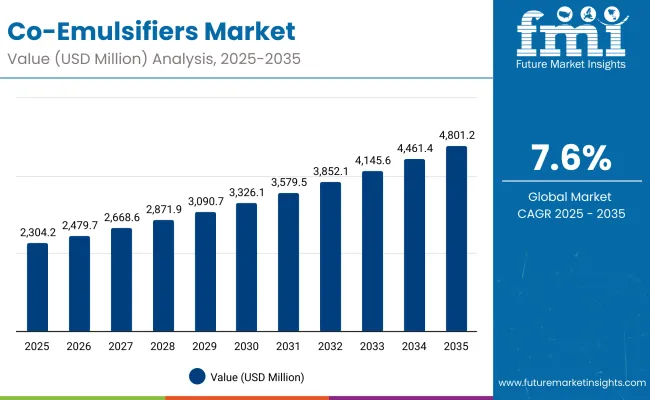
Quick Stats for Co-Emulsifiers Market

  • Co-Emulsifiers Market Value (2025): USD 2,304.2 million
  • Co-Emulsifiers Market Forecast Value (2035): USD 4,801.2 million
  • Co-Emulsifiers Market Forecast CAGR (2025 to 2035): 7.6%
  • Leading Segment in 2025: HLB balancing aids (35.6% share)
  • Key Growth Regions: Asia-Pacific, North America, Europe
  • Top Key Players: Croda, Evonik, BASF, Gattefossé, Clariant, Seppic, Inolex, Ashland, Nouryon, KosterKeunen

Co Emulsifiers Market

Co-Emulsifiers Market Key Takeaways

Metric Value
Co-Emulsifiers Market Estimated Value in (2025E) USD 2,304.2 million
Co-Emulsifiers Market Forecast Value in (2035F) USD 4,801.2 million
Forecast CAGR (2025 to 2035) 7.6%

During the first five-year period from 2025 to 2030, the market increases from USD 2,304.2 million to USD 3,090.7 million, adding USD 786.5 million, which accounts for 31% of the total decade growth. This phase records steady adoption across skincare, sun care, and haircare formulations, with formulators prioritizing HLB balancing aids and polyglyceryl esters for stable and mild emulsions. Free-form grades dominate this period, catering to over 52% of application needs due to their versatility in cold- and hot-process systems.

The second half from 2030 to 2035 contributes USD 1,710.5 million, equal to 69% of total growth, as the market jumps from USD 3,090.7 million to USD 4,801.2 million. This acceleration is powered by premiumization in cosmetics, palm-free and PEG-free demand, and compliance with COSMOS/RSPO standards. Pre-blended bases and encapsulated co-emulsifiers gain wider adoption for high-performance dermocosmetic and pharmaceutical emulsions, while bio-based and multifunctional co-emulsifiers capture increasing share by 2035.

From 2020 to 2024, the Co-Emulsifiers Market steadily expanded, supported by growing demand for mild, multifunctional emulsifier systems in personal care, sun care, and dermocosmetic formulations. During this period, the competitive landscape was dominated by global suppliers focusing on polyglyceryl esters and co-emulsifying waxes, which together accounted for the majority of new product launches. Differentiation relied on sustainability credentials, clean-label positioning, and palm-free sourcing, while RSPO-certified and COSMOS-approved ingredients gained prominence.

Demand for Co-Emulsifiers will expand to USD 2,304.2 million in 2025, with revenue increasingly driven by bio-based, PEG-free, and pre-blended solutions. Traditional suppliers face rising competition from specialty players offering encapsulated delivery systems, multifunctional co-emulsifiers, and fermentation-derived alternatives. Major incumbents are pivoting toward value-added services such as formulation guidance, claim substantiation, and digital sample libraries to retain customer loyalty. The competitive advantage is shifting from commodity emulsifiers to integrated ingredient ecosystems, where compliance, sustainability, and scalability are as important as technical performance.

Why the Co-Emulsifiers Market is growing?

Global brands are reformulating emulsions with alkyl glucosides and polyglyceryl esters to meet clean-label, palm-free, and PEG-free claims. This shift is not just regulatory-driven but consumer-led, as beauty and personal care buyers increasingly associate “free-from” co-emulsifiers with safety and sustainability. Suppliers offering RSPO-certified, COSMOS-approved, and fermentation-derived grades are winning disproportionate share, fueling structural growth in premium and dermocosmetic product categories.

Formulators are moving from single-function ingredients to pre-blended, multifunctional co-emulsifier systems that deliver stability, viscosity control, and sensory enhancement in one package. This reduces R&D cycles and processing complexity, especially for cold-process emulsions and water-sensitive actives. Growth is strongest in skincare and suncare, where multifunctional co-emulsifiers support rapid product launches and improve cost efficiency, creating a clear competitive edge for suppliers with advanced blending capabilities.

Segmental Analysis

The Co-Emulsifiers Market is segmented by functional role, chemistry type, delivery system, physical form, application, end use, and region. Functional roles include HLB balancing aids, viscosity and rheology assist, stability enhancers, and sensory modifiers, which underpin formulation performance.

By chemistry type, the market covers co-emulsifying waxes, polyglyceryl esters, sorbitan esters, and PEG-free alkyl glucosides, reflecting diverse clean-label and technical needs. Delivery formats range from free-form grades to pre-blended bases and encapsulated systems, while physical forms include flakes, liquid concentrates, and pellets/powders for flexible processing.

Applications span creams and lotions, serums, balms and sticks, and sunscreens, with end uses across skincare, sun care, haircare, and color cosmetics. Regionally, the market is analyzed across North America, Europe, East Asia, South Asia & Pacific, Latin America, and the Middle East & Africa, with high-growth countries such as India, China, Japan, the USA, Germany, and the U.K. leading adoption.
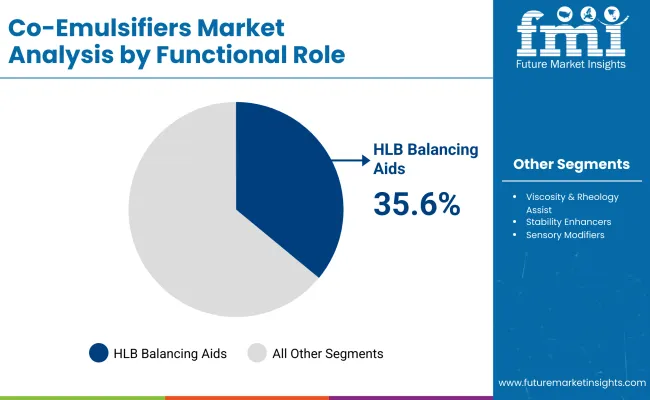
Insights into the Functional Role Segment with HLB Balancing Aids Leading in Market Share

Co Emulsifiers Market By Functional Role

Functional Role Value Share % 2025
HLB balancing aids 35.6%
Others 64.4%

The HLB balancing aids segment is projected to contribute 35.6% of the Co-Emulsifiers Market revenue in 2025, maintaining its lead as the most influential functional role category. Growth is driven by the critical role of HLB adjusters in optimizing emulsion stability, enabling formulators to fine-tune oil/water compatibility across skincare, sun care, and haircare applications.

The segment’s expansion is further supported by clean-label reformulation trends, as brands increasingly rely on polyglyceryl esters and alkyl glucosides to achieve mildness and palm-free credentials. By offering versatility across both cold- and hot-process emulsions, HLB balancing aids are expected to remain a cornerstone in cosmetic and pharmaceutical formulations, supporting premium textures and enhanced stability.
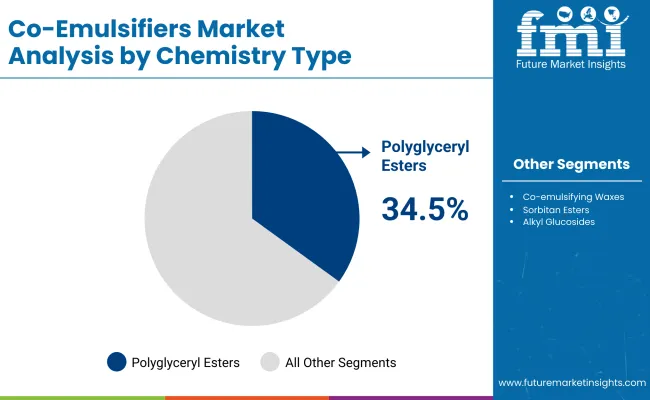
Insights into the Chemistry Segment with Polyglyceryl Esters Leading in Market Share

Co Emulsifiers Market By Chemistry Type

Chemistry Type Value Share % 2025
Polyglyceryl esters 34.5%
Others 65.5%

The polyglyceryl esters segment is forecasted to hold 34.5% of the market share in 2025, driven by its wide application in clean-label skincare, sun care, and baby care formulations. These esters are favored for their mildness, excellent emulsifying efficiency, and compatibility with natural oils, making them indispensable in products requiring both stability and sensory appeal. Their versatility in palm-free and PEG-free systems has further facilitated widespread adoption among global brands seeking sustainable and consumer-friendly solutions.

Growth is also bolstered by their ability to support cold-process emulsions and multifunctional roles such as moisturization and skin barrier reinforcement. As cosmetic and dermopharma markets increasingly prioritize eco-certified and bio-based emulsifiers, polyglyceryl esters are expected to continue their strong momentum over the forecast period.
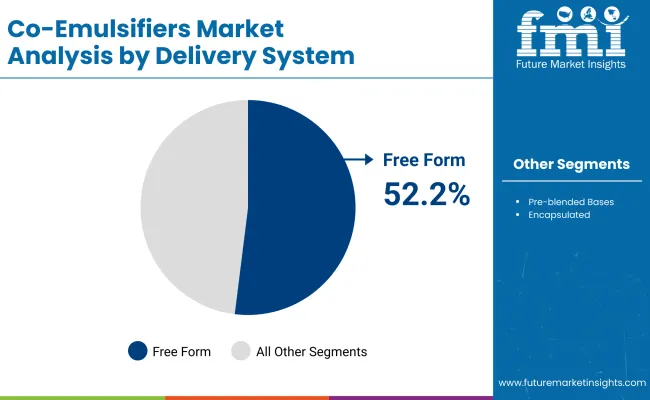
Insights into the Delivery System Segment with Free Form Grades Leading in Market Share

Co Emulsifiers Market By Delicvary Sys

Delivery System Value Share % 2025
Free form 52.2%
Others 47.8%

The free form delivery system segment is projected to account for 52.2% of the Co-Emulsifiers Market revenue in 2025, establishing it as the leading format. Free form grades are preferred by formulators for their flexibility in dosage adjustment, broad compatibility with oils and actives, and ease of incorporation into cold- and hot-process emulsions.

Their suitability across diverse formulations such as creams, lotions, and sunscreens has driven widespread adoption, particularly in skincare and sun care products. In addition, free form co-emulsifiers enable faster product development cycles by reducing the need for complex pre-processing steps. With demand rising for cost-effective yet multifunctional emulsifier systems, free form grades are expected to maintain their leadership over the forecast period.

What are the Drivers, Restraints, and Key Trends of the Co-Emulsifiers Market?

Rising Demand for Clean-Label and PEG-Free Formulations

The Co-Emulsifiers Market is being propelled by the surge in demand for clean-label products, especially PEG-free, palm-free, and naturally derived ingredients. Brands are actively reformulating to comply with COSMOS, NATRUE, and RSPO certifications, which favor the use of polyglyceryl esters and alkyl glucosides as mild and sustainable alternatives.

This is reinforced by consumer preference for transparent ingredient lists and “free-from” claims in personal care and cosmetics. As regulatory bodies tighten restrictions on ethoxylated compounds, suppliers focusing on bio-based and eco-certified co-emulsifiers are capturing faster adoption across skincare and sun care portfolios.

Expansion of Premium and Multifunctional Cosmetic Products

Growth is strongly supported by the expansion of premium cosmetics and dermocosmetics requiring co-emulsifiers with multifunctional properties such as stability enhancement, sensory improvement, and moisturizing benefits. Pre-blended and encapsulated delivery systems allow formulators to shorten development cycles while offering performance in complex emulsions like sunscreens and color cosmetics.

Rising consumer willingness to pay for premium textures and high-performance formulations has created consistent demand for advanced co-emulsifiers. This shift benefits suppliers with strong R&D pipelines and the ability to combine multiple functionalities into a single ingredient system, improving both cost efficiency and product differentiation.

Volatility in Raw Material Sourcing and Compliance Costs

A key restraint for the Co-Emulsifiers Market is the volatility of raw material sourcing, particularly for fatty alcohols, palm derivatives, and specialty esters. Price fluctuations linked to palm oil supply, combined with sustainability pressures, have increased procurement costs for manufacturers.

Additionally, compliance with evolving standards such as REACH, Prop 65, and RSPO adds both operational complexity and certification expenses. Smaller players face challenges in scaling eco-certified supply chains, while global suppliers must continually invest in traceability and alternative feedstocks. These pressures limit margins and can slow adoption in cost-sensitive applications like mass-market personal care and home care.

Adoption of Pre-Blended and Encapsulated Co-Emulsifiers

A clear trend shaping the Co-Emulsifiers Market is the growing adoption of pre-blended and encapsulated formats. Unlike free-form ingredients, these systems offer improved emulsion stability, ease of incorporation, and compatibility with sensitive actives, making them ideal for high-performance dermocosmetics and pharmaceutical topicals.

Their use supports cold-process manufacturing, reducing energy costs and enabling faster formulation cycles. Encapsulation further enhances controlled release, texture, and sensory experience. As global brands seek efficiency and differentiation, suppliers providing turnkey pre-blended or encapsulated solutions are emerging as preferred partners, reshaping the competitive dynamics of the co-emulsifier landscape.
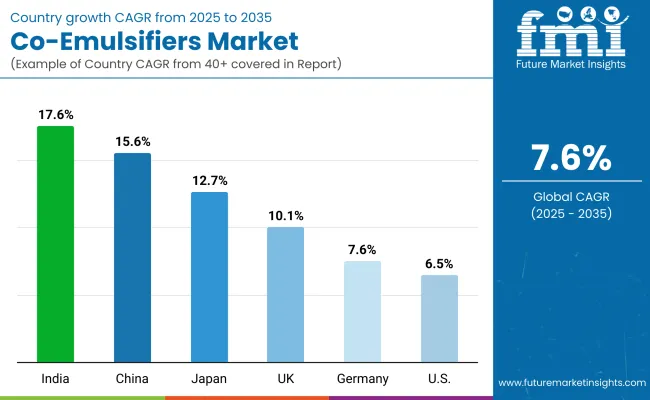
Analysis of Co-Emulsifiers Market By Key Countries

Country Co Emulsifiers Market

Country Estimated CAGR (2025 to 2035)
China 15.6%
USA 6.5%
India 17.6%
UK 10.1%
Germany 7.6%
Japan 12.7%

The global Co-Emulsifiers Market displays clear regional disparities in growth, largely influenced by consumer preferences, regulatory compliance, and the shift toward clean-label formulations. Asia-Pacific is the fastest-growing region, anchored by India (17.6% CAGR) and China (15.6% CAGR). India’s surge reflects the rapid expansion of mass skincare and suncare categories, with local brands adopting palm-free and bio-based co-emulsifiers to meet consumer and export demands. China, on the other hand, benefits from large-scale adoption of polyglyceryl esters and alkyl glucosides in premium skincare and color cosmetics, supported by strong domestic production and evolving safety standards.

Europe maintains steady growth, led by Germany (7.6% CAGR) and the UK (10.1% CAGR), underpinned by stringent EU compliance requirements and consumer demand for COSMOS- and RSPO-certified ingredients. Growth is further supported by the region’s leadership in dermocosmetics and high-end suncare, where multifunctional co-emulsifiers play a critical role. Japan (12.7% CAGR) also reflects rising demand for encapsulated and multifunctional systems, tied to its premium dermocosmetic innovation.

North America, with the USA at 6.5% CAGR, shows moderate expansion due to its mature market structure. Growth here is more service- and compliance-driven, with brands focusing on RSPO-certified sourcing, palm-free portfolios, and PEG-free claims, while premium skincare and baby care continue to be strong demand drivers.
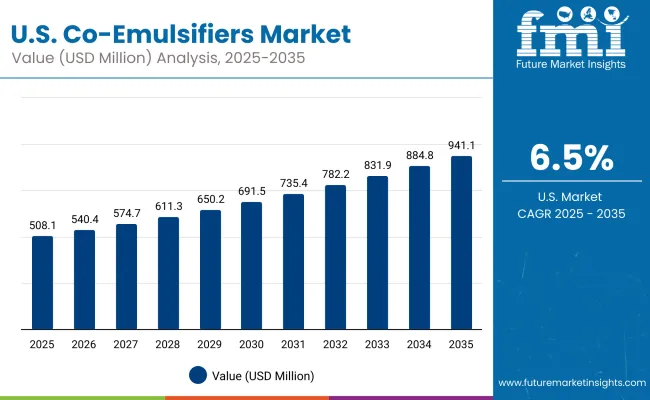
Sales Outlook for Co-Emulsifiers in the United States

Usa Co Emulsifiers Market

Year USA Market (USD Million)
2025 508.13
2026 540.43
2027 574.79
2028 611.33
2029 650.20
2030 691.53
2031 735.49
2032 782.25
2033 831.98
2034 884.88
2035 941.13

The Co-Emulsifiers Market in the United States is projected to grow at a CAGR of 6.5%, led by rising adoption of PEG-free and palm-free co-emulsifiers in personal care and dermocosmetic formulations. Strong consumer preference for clean-label skincare, baby care, and sun care products is accelerating demand for polyglyceryl esters and co-emulsifying waxes.

Compliance with RSPO, COSMOS, and Prop 65 standards further strengthens the USA market as formulators shift portfolios toward eco-certified and safe emulsifier systems. Growth is also supported by pre-blended co-emulsifier systems, which simplify processing and shorten formulation timelines for local brands competing in fast-moving premium and mass-market segments.

  • Skincare remains the dominant category, with co-emulsifiers enabling stability and sensory optimization.
  • Baby care and dermocosmetics are high-growth niches due to clean-label claims and mildness requirements.
  • Pre-blended systems and multifunctional co-emulsifiers are increasingly preferred for R&D and manufacturing efficiency.

Growth and Expansion Outlook for Co-Emulsifiers Market in the United Kingdom

The Co-Emulsifiers Market in the United Kingdom is expected to grow at a CAGR of 10.1% between 2025 and 2035, supported by strong adoption in premium skincare, sun care, and color cosmetics. Demand is driven by consumer preference for clean-label, RSPO-certified, and palm-free co-emulsifiers, with polyglyceryl esters and alkyl glucosides gaining traction as mild, multifunctional alternatives.

The market is also benefiting from growing investments in dermocosmetic R&D and a shift toward encapsulated and pre-blended emulsifier systems that reduce formulation timelines. Collaborative initiatives between academic institutions, formulators, and ingredient suppliers are further fostering innovation in sustainable and high-performance emulsifier technologies.

  • Skincare and sun care remain the leading application segments, with strong demand for stability and sensory enhancers.
  • Clean-label positioning and RSPO-certified sourcing are shaping retail preferences in personal care and cosmetics.
  • Pre-blended and multifunctional co-emulsifiers are fueling efficiency gains in U.K.-based formulation labs and contract manufacturers.

Growth and Expansion Outlook for Co-Emulsifiers Market in India

India is witnessing rapid expansion in the Co-Emulsifiers Market, projected to grow at a CAGR of 17.6% through 2035. The surge is driven by strong demand for affordable skincare and sun care products, alongside rising adoption of palm-free, PEG-free, and bio-based co-emulsifiers by local and regional brands.

Tier-2 and tier-3 cities are emerging growth hubs, as MSMEs and contract manufacturers increasingly adopt pre-blended co-emulsifier systems that lower production costs and simplify formulation. Government initiatives encouraging sustainable cosmetics and herbal-based innovation are further strengthening domestic adoption and export competitiveness.

  • Tier-2 and tier-3 cities are boosting demand for cost-effective palm-free and bio-based emulsifiers.
  • Local skincare and sun care brands are scaling rapidly, fueling higher consumption of polyglyceryl esters.
  • Herbal and natural cosmetic positioning is creating strong preference for clean-label, RSPO-certified systems.

Sales Outlook for Co-Emulsifiers in China

The Co-Emulsifiers Market in China is expected to grow at a CAGR of 15.6%, the highest among leading economies. Growth momentum is driven by surging demand for premium skincare, sun care, and color cosmetics, combined with strong domestic production of polyglyceryl esters and alkyl glucosides.

Local manufacturers are rapidly scaling capacity for palm-free and PEG-free emulsifiers, making sustainable options more affordable and accessible. Government-backed initiatives promoting green chemistry and cosmetic safety compliance are further propelling adoption. With Chinese consumers increasingly favoring bio-based, multifunctional, and encapsulated co-emulsifiers, the market is positioned for sustained double-digit growth through 2035.
  • Local producers are scaling palm-free and PEG-free co-emulsifiers, improving affordability.
  • Premium skincare and color cosmetics are driving large-scale adoption of multifunctional systems.
  • Government support for green chemistry and compliance standards is accelerating mainstream use.

In-depth Analysis of Co-Emulsifiers in Germany

Europe Co Emulsifiers Market

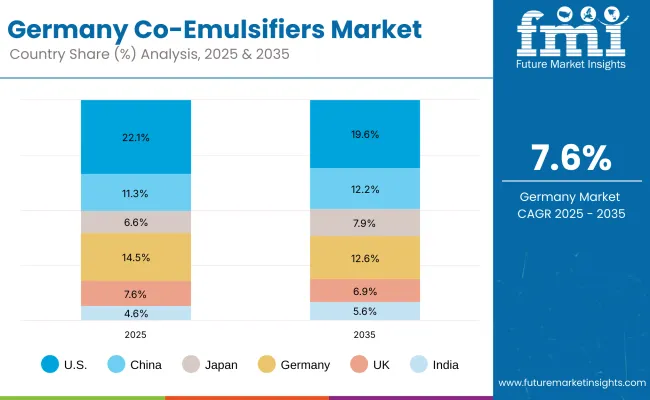
Country 2025 Share (%)
USA 22.1%
China 11.3%
Japan 6.6%
Germany 14.5%
UK 7.6%
India 4.6%
Country 2035 Share (%)
USA 19.6%
China 12.2%
Japan 7.9%
Germany 12.6%
UK 6.9%
India 5.6%

The Co-Emulsifiers Market in Germany is projected to grow at a CAGR of 7.6%, supported by the country’s position as a leader in high-quality personal care and dermocosmetic innovation. German formulators are actively incorporating COSMOS- and RSPO-certified co-emulsifiers to comply with stringent EU regulations on sustainability and ingredient safety.

Demand is particularly strong in skincare and suncare categories, where HLB balancing aids and polyglyceryl esters are critical for stable, mild, and multifunctional emulsions. Growth is also driven by premiumization trends, with pharmaceutical and dermo brands increasingly adopting pre-blended and encapsulated delivery systems to improve stability, processing efficiency, and product differentiation.
  • Inline adoption of eco-certified emulsifiers supports compliance with EU cosmetic regulations.
  • Polyglyceryl esters are favored in skincare and suncare for stability and mildness.
  • Pre-blended and encapsulated formats are gaining traction among dermo-pharma manufacturers.

Growth Outlook for Co-Emulsifiers Market in USA

Usa1 Co Emulsifiers Market

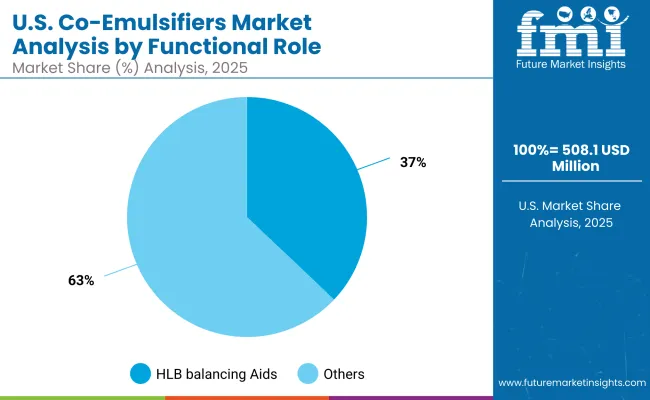
USA By Functional Role Value Share % 2025
HLB balancing aids 37.1%
Others 62.9%

The Co-Emulsifiers Market in the United States is projected to reach USD 508.1 million in 2025, growing at a CAGR of 6.5% through 2035. HLB balancing aids lead with 37.1% share, reflecting their critical role in stabilizing emulsions across skincare, suncare, and baby care applications.

Growth is increasingly driven by PEG-free and palm-free formulations, as USA consumers demand transparency and safer cosmetic ingredients. Suppliers are also seeing higher adoption of pre-blended bases, which simplify formulation, reduce R&D costs, and enable faster product launches.

The country’s regulatory landscape including Prop 65 compliance, RSPO certification, and FDA oversight for dermocosmetics further encourages innovation in bio-based, multifunctional, and eco-certified co-emulsifiers. Over the next decade, the USA market will continue to shift toward premium skincare, baby care, and clean-label categories, making sustainability and functionality the core growth levers.
  • The USA market accounts for 22.1% of global share in 2025, declining slightly to 19.6% by 2035 due to faster growth in Asia.
  • HLB balancing aids remain a cornerstone of formulations, securing over one-third of the domestic market.
  • Demand is strongly supported by clean-label, palm-free, and multifunctional emulsifier systems in personal care.

Opportunity Analysis of China Co-Emulsifiers Market

China Co Emulsifiers Market

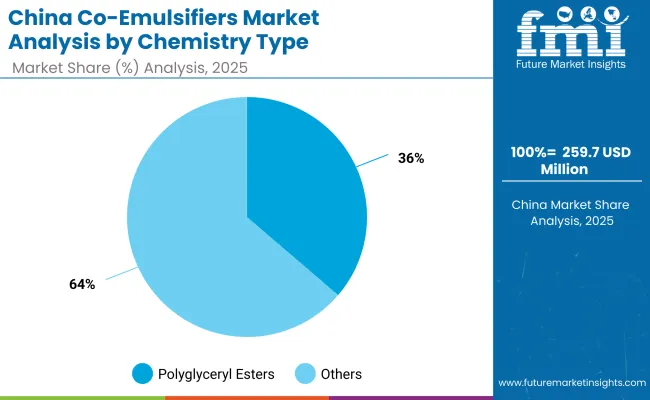
China By Chemistry Type Value Share % 2025
Polyglyceryl esters 36.3%
Others 63.7%

The Co-Emulsifiers Market in China is expected to expand rapidly, reaching USD 259.7 million in 2025 and growing at a CAGR of 15.6% through 2035. A key opportunity lies in the rising adoption of polyglyceryl esters, which already account for 36.3% of market share, as they align with clean-label and palm-free formulation trends. China’s strong domestic cosmetics and skincare ecosystem, combined with government support for green chemistry and regulatory compliance, is creating demand for eco-certified, multifunctional, and encapsulated co-emulsifiers.

China’s market opportunity is further amplified by local production advantages. Domestic suppliers are scaling palm-free and PEG-free alternatives at competitive prices, making sustainable co-emulsifiers accessible for both multinational and local brands. With rising consumer preference for premium skincare, color cosmetics, and multifunctional products, China is positioned to be a central hub for innovation and export-oriented supply in the global co-emulsifier landscape.
  • 2025 market size for China: USD 259.7 million
  • Global share: 11.3% in 2025 → 12.2% by 2035
  • Polyglyceryl esters lead with 36.3% share, driven by clean-label adoption and local manufacturing scale

Competitive Landscape of Co-Emulsifiers Market

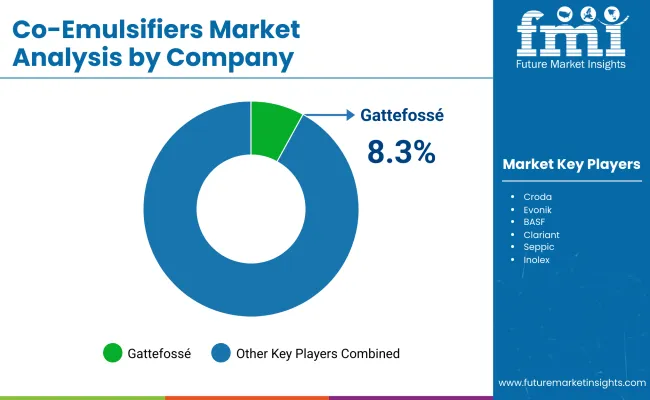
Co Emulsifiers Market By Company

Company Global Value Share 2025
Gattefossé 8.3%
Others 91.7%

The Co-Emulsifiers Market is moderately fragmented, with a mix of global ingredient leaders, regional specialists, and niche-focused innovators competing across diverse formulation applications. Global leaders such as Croda, BASF, Evonik, Clariant, and Seppic hold significant positions, leveraging broad portfolios of polyglyceryl esters, co-emulsifying waxes, and alkyl glucosides. Their strategies emphasize clean-label innovation, RSPO-certified sourcing, and multifunctional delivery systems to align with regulatory and consumer demands.

Mid-sized innovators including Gattefossé, Inolex, and Ashland focus on pre-blended and encapsulated co-emulsifier systems that simplify formulation and accelerate time-to-market, particularly in dermocosmetics and premium skincare. Their ability to deliver tailored solutions and strong technical support makes them highly competitive in value-added segments.

Specialist providers such as KosterKeunen and Nouryon cater to application-specific needs with wax-based and bio-based co-emulsifiers, addressing niches in baby care, natural cosmetics, and pharmaceutical topicals. Their strength lies in sustainability credentials, custom blends, and regional adaptability rather than sheer scale.

Competitive differentiation is increasingly shifting away from commodity emulsifiers toward integrated ingredient ecosystems that combine compliance, sustainability, multifunctionality, and supplier-backed formulation services. Players able to combine bio-based innovation with scalable supply chains are expected to strengthen their leadership over the next decade.

Key Developments in Co-Emulsifiers Market

  • On February 3, 2025, Gattefossé launched a new pre-blended co-emulsifier system designed for cold-process formulations in skincare and suncare. The blend improves emulsion stability under high electrolyte and UV filter loads, supporting faster formulation cycles and energy-efficient production.
  • On May 27, 2025, Evonik announced the expansion of its alkyl glucoside (PEG-free) production line in China, targeting the fast-growing demand for palm-free, clean-label emulsifiers in Asia-Pacific. The expansion enhances supply security for regional customers and supports RSPO-certified sourcing initiatives.

Scope of the Report

Item Value
Quantitative Units USD 2,304.2 Million
Functional Role HLB balancing aids, Viscosity & rheology assist, Stability enhancers, Sensory modifiers
Chemistry Type Co-emulsifying waxes, Polyglyceryl esters, Sorbitan esters, Alkyl glucosides (PEG-free)
Delivery System Free form, Pre-blended bases, Encapsulated
Physical Form Flakes/pastilles, Liquid concentrate, Pellets/powder
Application Creams & lotions, Serums, Balms & sticks, Sunscreens
End Use Skincare, Sun care, Haircare, Color cosmetics
Regions Covered North America, Europe, Asia-Pacific, Latin America, Middle East & Africa
Country Covered United States, Canada, Germany, France, United Kingdom, China, Japan, India, Brazil, South Africa
Key Companies Profiled Croda , Evonik , BASF, Gattefossé , Clariant , Seppic , Inolex , Ashland, Nouryon , Koster Keunen
Additional Attributes Dollar sales by chemistry type and end use, HLB-band mix, delivery system split (free-form vs pre-blends), PEG-free/palm-free adoption, growth in skincare and suncare , RSPO/COSMOS compliance impact, APAC acceleration (China, India), shift to pre-blended/encapsulated systems, cold-process/energy-saving use, innovation in polyglyceryl esters and alkyl glucosides.

Key Segments

By Functional Role:

  • HLB balancing aids
  • Viscosity & rheology assist
  • Stability enhancers
  • Sensory modifiers

By Chemistry:

  • Co-emulsifying waxes
  • Polyglyceryl esters
  • Sorbitan esters
  • Alkyl glucosides (PEG-free)

By End Usr:

  • Free form
  • Pre-blended bases
  • Encapsulated

By Physical Form:

  • Flakes/pastilles
  • Liquid concentrate
  • Pellets/powder

By Application:

  • Creams & lotions
  • Serums
  • Balms & sticks
  • Sunscreens

By End Use:

  • Skincare
  • Sun care
  • Haircare
  • Color cosmetics

By Region:

  • North America
  • Latin America
  • Europe
  • East Asia
  • South Asia & Pacific
  • Middle East and Africa

Table of Content

  1. Executive Summary
    • Global Market Outlook
    • Demand-side Trends
    • Supply-side Trends
    • Technology Roadmap Analysis
    • Analysis and Recommendations
  2. Market Overview
    • Market Coverage / Taxonomy
    • Market Definition / Scope / Limitations
  3. Market Background
    • Market Dynamics
      • Drivers
      • Restraints
      • Opportunity
      • Trends
    • Scenario Forecast
      • Demand in Optimistic Scenario
      • Demand in Likely Scenario
      • Demand in Conservative Scenario
    • Opportunity Map Analysis
    • Product Life Cycle Analysis
    • Supply Chain Analysis
      • Supply Side Participants and their Roles
        • Producers
        • Mid-Level Participants (Traders/ Agents/ Brokers)
        • Wholesalers and Distributors
      • Value Added and Value Created at Node in the Supply Chain
      • List of Raw Material Suppliers
      • List of Existing and Potential Buyer’s
    • Investment Feasibility Matrix
    • Value Chain Analysis
      • Profit Margin Analysis
      • Wholesalers and Distributors
      • Retailers
    • PESTLE and Porter’s Analysis
    • Regulatory Landscape
      • By Key Regions
      • By Key Countries
    • Regional Parent Market Outlook
    • Production and Consumption Statistics
    • Import and Export Statistics
  4. Global Market Analysis 2020 to 2024 and Forecast, 2025 to 2035
    • Historical Market Size Value (USD Million) & Volume (Units) Analysis, 2020 to 2024
    • Current and Future Market Size Value (USD Million) & Volume (Units) Projections, 2025 to 2035
      • Y-o-Y Growth Trend Analysis
      • Absolute $ Opportunity Analysis
  5. Global Market Analysis 2020 to 2024 and Forecast 2025 to 2035, By Functional Role
    • Introduction / Key Findings
    • Historical Market Size Value (USD Million) & Volume (Units) Analysis By Functional Role, 2020 to 2024
    • Current and Future Market Size Value (USD Million) & Volume (Units) Analysis and Forecast By Functional Role, 2025 to 2035
      • HLB balancing aids
      • Viscosity & rheology assist
      • Stability enhancers
      • Sensory modifiers
    • Y-o-Y Growth Trend Analysis By Functional Role, 2020 to 2024
    • Absolute $ Opportunity Analysis By Functional Role, 2025 to 2035
  6. Global Market Analysis 2020 to 2024 and Forecast 2025 to 2035, By Chemistry
    • Introduction / Key Findings
    • Historical Market Size Value (USD Million) & Volume (Units) Analysis By Chemistry, 2020 to 2024
    • Current and Future Market Size Value (USD Million) & Volume (Units) Analysis and Forecast By Chemistry, 2025 to 2035
      • Co-emulsifying waxes
      • Polyglyceryl esters
      • Sorbitan esters
      • Alkyl glucosides (PEG-free)
    • Y-o-Y Growth Trend Analysis By Chemistry, 2020 to 2024
    • Absolute $ Opportunity Analysis By Chemistry, 2025 to 2035
  7. Global Market Analysis 2020 to 2024 and Forecast 2025 to 2035, By End Usr
    • Introduction / Key Findings
    • Historical Market Size Value (USD Million) & Volume (Units) Analysis By End Usr , 2020 to 2024
    • Current and Future Market Size Value (USD Million) & Volume (Units) Analysis and Forecast By End Usr , 2025 to 2035
      • Free form
      • Pre-blended bases
      • Encapsulated
    • Y-o-Y Growth Trend Analysis By End Usr , 2020 to 2024
    • Absolute $ Opportunity Analysis By End Usr , 2025 to 2035
  8. Global Market Analysis 2020 to 2024 and Forecast 2025 to 2035, By Physical Form
    • Introduction / Key Findings
    • Historical Market Size Value (USD Million) & Volume (Units) Analysis By Physical Form, 2020 to 2024
    • Current and Future Market Size Value (USD Million) & Volume (Units) Analysis and Forecast By Physical Form, 2025 to 2035
      • Flakes/pastilles
      • Liquid concentrate
      • Pellets/powder
    • Y-o-Y Growth Trend Analysis By Physical Form, 2020 to 2024
    • Absolute $ Opportunity Analysis By Physical Form, 2025 to 2035
  9. Global Market Analysis 2020 to 2024 and Forecast 2025 to 2035, By Application
    • Introduction / Key Findings
    • Historical Market Size Value (USD Million) & Volume (Units) Analysis By Application, 2020 to 2024
    • Current and Future Market Size Value (USD Million) & Volume (Units) Analysis and Forecast By Application, 2025 to 2035
      • Creams & lotions
      • Serums
      • Balms & sticks
      • Sunscreens
    • Y-o-Y Growth Trend Analysis By Application, 2020 to 2024
    • Absolute $ Opportunity Analysis By Application, 2025 to 2035
  10. Global Market Analysis 2020 to 2024 and Forecast 2025 to 2035, By End Use
    • Introduction / Key Findings
    • Historical Market Size Value (USD Million) & Volume (Units) Analysis By End Use, 2020 to 2024
    • Current and Future Market Size Value (USD Million) & Volume (Units) Analysis and Forecast By End Use, 2025 to 2035
      • Skincare
      • Sun care
      • Haircare
      • Color cosmetics
    • Y-o-Y Growth Trend Analysis By End Use, 2020 to 2024
    • Absolute $ Opportunity Analysis By End Use, 2025 to 2035
  11. Global Market Analysis 2020 to 2024 and Forecast 2025 to 2035, By Region
    • Introduction
    • Historical Market Size Value (USD Million) & Volume (Units) Analysis By Region, 2020 to 2024
    • Current Market Size Value (USD Million) & Volume (Units) Analysis and Forecast By Region, 2025 to 2035
      • North America
      • Latin America
      • Europe
      • East Asia
      • South Asia & Pacific
      • Middle East and Africa
    • Market Attractiveness Analysis By Region
  12. North America Market Analysis 2020 to 2024 and Forecast 2025 to 2035, By Country
    • Historical Market Size Value (USD Million) & Volume (Units) Trend Analysis By Market Taxonomy, 2020 to 2024
    • Market Size Value (USD Million) & Volume (Units) Forecast By Market Taxonomy, 2025 to 2035
      • By Country
        • USA
        • Canada
      • By Functional Role
      • By Chemistry
      • By End Usr
      • By Physical Form
      • By Application
      • By End Use
    • Market Attractiveness Analysis
      • By Country
      • By Functional Role
      • By Chemistry
      • By End Usr
      • By Physical Form
      • By Application
      • By End Use
    • Key Takeaways
  13. Latin America Market Analysis 2020 to 2024 and Forecast 2025 to 2035, By Country
    • Historical Market Size Value (USD Million) & Volume (Units) Trend Analysis By Market Taxonomy, 2020 to 2024
    • Market Size Value (USD Million) & Volume (Units) Forecast By Market Taxonomy, 2025 to 2035
      • By Country
        • Brazil
        • Mexico
        • Colombia
        • Rest of Latin America
      • By Functional Role
      • By Chemistry
      • By End Usr
      • By Physical Form
      • By Application
      • By End Use
    • Market Attractiveness Analysis
      • By Country
      • By Functional Role
      • By Chemistry
      • By End Usr
      • By Physical Form
      • By Application
      • By End Use
    • Key Takeaways
  14. Europe Market Analysis 2020 to 2024 and Forecast 2025 to 2035, By Country
    • Historical Market Size Value (USD Million) & Volume (Units) Trend Analysis By Market Taxonomy, 2020 to 2024
    • Market Size Value (USD Million) & Volume (Units) Forecast By Market Taxonomy, 2025 to 2035
      • By Country
        • Germany
        • UK
        • France
        • Italy
        • Spain
        • Belgium
        • Netherlands
        • Nordic
        • Switzerland
        • Russia
        • Poland
        • Rest of Europe
      • By Functional Role
      • By Chemistry
      • By End Usr
      • By Physical Form
      • By Application
      • By End Use
    • Market Attractiveness Analysis
      • By Country
      • By Functional Role
      • By Chemistry
      • By End Usr
      • By Physical Form
      • By Application
      • By End Use
    • Key Takeaways
  15. East Asia Market Analysis 2020 to 2024 and Forecast 2025 to 2035, By Country
    • Historical Market Size Value (USD Million) & Volume (Units) Trend Analysis By Market Taxonomy, 2020 to 2024
    • Market Size Value (USD Million) & Volume (Units) Forecast By Market Taxonomy, 2025 to 2035
      • By Country
        • China
        • Japan
        • South Korea
      • By Functional Role
      • By Chemistry
      • By End Usr
      • By Physical Form
      • By Application
      • By End Use
    • Market Attractiveness Analysis
      • By Country
      • By Functional Role
      • By Chemistry
      • By End Usr
      • By Physical Form
      • By Application
      • By End Use
    • Key Takeaways
  16. South Asia & Pacific Market Analysis 2020 to 2024 and Forecast 2025 to 2035, By Country
    • Historical Market Size Value (USD Million) & Volume (Units) Trend Analysis By Market Taxonomy, 2020 to 2024
    • Market Size Value (USD Million) & Volume (Units) Forecast By Market Taxonomy, 2025 to 2035
      • By Country
        • India
        • Thailand
        • Malaysia
        • Indonesia
        • Singapore
        • Vietnam
        • Australia
        • New Zealand
        • Rest of South Asia
      • By Functional Role
      • By Chemistry
      • By End Usr
      • By Physical Form
      • By Application
      • By End Use
    • Market Attractiveness Analysis
      • By Country
      • By Functional Role
      • By Chemistry
      • By End Usr
      • By Physical Form
      • By Application
      • By End Use
    • Key Takeaways
  17. Middle East and Africa Market Analysis 2020 to 2024 and Forecast 2025 to 2035, By Country
    • Historical Market Size Value (USD Million) & Volume (Units) Trend Analysis By Market Taxonomy, 2020 to 2024
    • Market Size Value (USD Million) & Volume (Units) Forecast By Market Taxonomy, 2025 to 2035
      • By Country
        • Turkey
        • UAE
        • Saudi Arabia
        • Israel
        • Other GCC Countries
        • North Africa
        • South Africa
      • By Functional Role
      • By Chemistry
      • By End Usr
      • By Physical Form
      • By Application
      • By End Use
    • Market Attractiveness Analysis
      • By Country
      • By Functional Role
      • By Chemistry
      • By End Usr
      • By Physical Form
      • By Application
      • By End Use
    • Key Takeaways
  18. Key Countries Market Analysis
    • USA
      • Pricing Analysis
      • Market Share Analysis, 2024
        • By Functional Role
        • By Chemistry
        • By End Usr
        • By Physical Form
        • By Application
        • By End Use
    • Canada
      • Pricing Analysis
      • Market Share Analysis, 2024
        • By Functional Role
        • By Chemistry
        • By End Usr
        • By Physical Form
        • By Application
        • By End Use
    • Brazil
      • Pricing Analysis
      • Market Share Analysis, 2024
        • By Functional Role
        • By Chemistry
        • By End Usr
        • By Physical Form
        • By Application
        • By End Use
    • Mexico
      • Pricing Analysis
      • Market Share Analysis, 2024
        • By Functional Role
        • By Chemistry
        • By End Usr
        • By Physical Form
        • By Application
        • By End Use
    • Colombia
      • Pricing Analysis
      • Market Share Analysis, 2024
        • By Functional Role
        • By Chemistry
        • By End Usr
        • By Physical Form
        • By Application
        • By End Use
    • Germany
      • Pricing Analysis
      • Market Share Analysis, 2024
        • By Functional Role
        • By Chemistry
        • By End Usr
        • By Physical Form
        • By Application
        • By End Use
    • UK
      • Pricing Analysis
      • Market Share Analysis, 2024
        • By Functional Role
        • By Chemistry
        • By End Usr
        • By Physical Form
        • By Application
        • By End Use
    • France
      • Pricing Analysis
      • Market Share Analysis, 2024
        • By Functional Role
        • By Chemistry
        • By End Usr
        • By Physical Form
        • By Application
        • By End Use
    • Italy
      • Pricing Analysis
      • Market Share Analysis, 2024
        • By Functional Role
        • By Chemistry
        • By End Usr
        • By Physical Form
        • By Application
        • By End Use
    • Spain
      • Pricing Analysis
      • Market Share Analysis, 2024
        • By Functional Role
        • By Chemistry
        • By End Usr
        • By Physical Form
        • By Application
        • By End Use
    • Belgium
      • Pricing Analysis
      • Market Share Analysis, 2024
        • By Functional Role
        • By Chemistry
        • By End Usr
        • By Physical Form
        • By Application
        • By End Use
    • Netherlands
      • Pricing Analysis
      • Market Share Analysis, 2024
        • By Functional Role
        • By Chemistry
        • By End Usr
        • By Physical Form
        • By Application
        • By End Use
    • Nordic
      • Pricing Analysis
      • Market Share Analysis, 2024
        • By Functional Role
        • By Chemistry
        • By End Usr
        • By Physical Form
        • By Application
        • By End Use
    • Switzerland
      • Pricing Analysis
      • Market Share Analysis, 2024
        • By Functional Role
        • By Chemistry
        • By End Usr
        • By Physical Form
        • By Application
        • By End Use
    • Russia
      • Pricing Analysis
      • Market Share Analysis, 2024
        • By Functional Role
        • By Chemistry
        • By End Usr
        • By Physical Form
        • By Application
        • By End Use
    • Poland
      • Pricing Analysis
      • Market Share Analysis, 2024
        • By Functional Role
        • By Chemistry
        • By End Usr
        • By Physical Form
        • By Application
        • By End Use
    • China
      • Pricing Analysis
      • Market Share Analysis, 2024
        • By Functional Role
        • By Chemistry
        • By End Usr
        • By Physical Form
        • By Application
        • By End Use
    • Japan
      • Pricing Analysis
      • Market Share Analysis, 2024
        • By Functional Role
        • By Chemistry
        • By End Usr
        • By Physical Form
        • By Application
        • By End Use
    • South Korea
      • Pricing Analysis
      • Market Share Analysis, 2024
        • By Functional Role
        • By Chemistry
        • By End Usr
        • By Physical Form
        • By Application
        • By End Use
    • India
      • Pricing Analysis
      • Market Share Analysis, 2024
        • By Functional Role
        • By Chemistry
        • By End Usr
        • By Physical Form
        • By Application
        • By End Use
    • Thailand
      • Pricing Analysis
      • Market Share Analysis, 2024
        • By Functional Role
        • By Chemistry
        • By End Usr
        • By Physical Form
        • By Application
        • By End Use
    • Indonesia
      • Pricing Analysis
      • Market Share Analysis, 2024
        • By Functional Role
        • By Chemistry
        • By End Usr
        • By Physical Form
        • By Application
        • By End Use
    • Australia
      • Pricing Analysis
      • Market Share Analysis, 2024
        • By Functional Role
        • By Chemistry
        • By End Usr
        • By Physical Form
        • By Application
        • By End Use
    • New Zealand
      • Pricing Analysis
      • Market Share Analysis, 2024
        • By Functional Role
        • By Chemistry
        • By End Usr
        • By Physical Form
        • By Application
        • By End Use
    • Turkey
      • Pricing Analysis
      • Market Share Analysis, 2024
        • By Functional Role
        • By Chemistry
        • By End Usr
        • By Physical Form
        • By Application
        • By End Use
    • UAE
      • Pricing Analysis
      • Market Share Analysis, 2024
        • By Functional Role
        • By Chemistry
        • By End Usr
        • By Physical Form
        • By Application
        • By End Use
    • Saudi Arabia
      • Pricing Analysis
      • Market Share Analysis, 2024
        • By Functional Role
        • By Chemistry
        • By End Usr
        • By Physical Form
        • By Application
        • By End Use
    • Israel
      • Pricing Analysis
      • Market Share Analysis, 2024
        • By Functional Role
        • By Chemistry
        • By End Usr
        • By Physical Form
        • By Application
        • By End Use
    • North Africa
      • Pricing Analysis
      • Market Share Analysis, 2024
        • By Functional Role
        • By Chemistry
        • By End Usr
        • By Physical Form
        • By Application
        • By End Use
    • South Africa
      • Pricing Analysis
      • Market Share Analysis, 2024
        • By Functional Role
        • By Chemistry
        • By End Usr
        • By Physical Form
        • By Application
        • By End Use
  19. Market Structure Analysis
    • Competition Dashboard
    • Competition Benchmarking
    • Market Share Analysis of Top Players
      • By Regional
      • By Functional Role
      • By Chemistry
      • By End Usr
      • By Physical Form
      • By Application
      • By End Use
  20. Competition Analysis
    • Competition Deep Dive
      • Croda
        • Overview
        • Product Portfolio
        • Profitability by Market Segments (Product/Age /Sales Channel/Region)
        • Sales Footprint
        • Strategy Overview
          • Marketing Strategy
          • Product Strategy
          • Channel Strategy
      • Evonik
        • Overview
        • Product Portfolio
        • Profitability by Market Segments (Product/Age /Sales Channel/Region)
        • Sales Footprint
        • Strategy Overview
          • Marketing Strategy
          • Product Strategy
          • Channel Strategy
      • BASF
        • Overview
        • Product Portfolio
        • Profitability by Market Segments (Product/Age /Sales Channel/Region)
        • Sales Footprint
        • Strategy Overview
          • Marketing Strategy
          • Product Strategy
          • Channel Strategy
      • Gattefossé
        • Overview
        • Product Portfolio
        • Profitability by Market Segments (Product/Age /Sales Channel/Region)
        • Sales Footprint
        • Strategy Overview
          • Marketing Strategy
          • Product Strategy
          • Channel Strategy
      • Clariant
        • Overview
        • Product Portfolio
        • Profitability by Market Segments (Product/Age /Sales Channel/Region)
        • Sales Footprint
        • Strategy Overview
          • Marketing Strategy
          • Product Strategy
          • Channel Strategy
      • Seppic
        • Overview
        • Product Portfolio
        • Profitability by Market Segments (Product/Age /Sales Channel/Region)
        • Sales Footprint
        • Strategy Overview
          • Marketing Strategy
          • Product Strategy
          • Channel Strategy
      • Inolex
        • Overview
        • Product Portfolio
        • Profitability by Market Segments (Product/Age /Sales Channel/Region)
        • Sales Footprint
        • Strategy Overview
          • Marketing Strategy
          • Product Strategy
          • Channel Strategy
      • Ashland
        • Overview
        • Product Portfolio
        • Profitability by Market Segments (Product/Age /Sales Channel/Region)
        • Sales Footprint
        • Strategy Overview
          • Marketing Strategy
          • Product Strategy
          • Channel Strategy
      • Nouryon
        • Overview
        • Product Portfolio
        • Profitability by Market Segments (Product/Age /Sales Channel/Region)
        • Sales Footprint
        • Strategy Overview
          • Marketing Strategy
          • Product Strategy
          • Channel Strategy
      • Koster Keunen
        • Overview
        • Product Portfolio
        • Profitability by Market Segments (Product/Age /Sales Channel/Region)
        • Sales Footprint
        • Strategy Overview
          • Marketing Strategy
          • Product Strategy
          • Channel Strategy
      • Others
        • Overview
        • Product Portfolio
        • Profitability by Market Segments (Product/Age /Sales Channel/Region)
        • Sales Footprint
        • Strategy Overview
          • Marketing Strategy
          • Product Strategy
          • Channel Strategy
  21. Assumptions & Acronyms Used
  22. Research Methodology

List of Tables

  • Table 1: Global Market Value (USD Million) Forecast by Region, 2020-2035
  • Table 2: Global Market Volume (Units) Forecast by Region, 2020-2035
  • Table 3: Global Market Value (USD Million) Forecast by Functional Role, 2020-2035
  • Table 4: Global Market Volume (Units) Forecast by Functional Role, 2020-2035
  • Table 5: Global Market Value (USD Million) Forecast by Chemistry, 2020-2035
  • Table 6: Global Market Volume (Units) Forecast by Chemistry, 2020-2035
  • Table 7: Global Market Value (USD Million) Forecast by End Usr , 2020-2035
  • Table 8: Global Market Volume (Units) Forecast by End Usr , 2020-2035
  • Table 9: Global Market Value (USD Million) Forecast by Physical Form, 2020-2035
  • Table 10: Global Market Volume (Units) Forecast by Physical Form, 2020-2035
  • Table 11: Global Market Value (USD Million) Forecast by Application, 2020-2035
  • Table 12: Global Market Volume (Units) Forecast by Application, 2020-2035
  • Table 13: Global Market Value (USD Million) Forecast by End Use, 2020-2035
  • Table 14: Global Market Volume (Units) Forecast by End Use, 2020-2035
  • Table 15: North America Market Value (USD Million) Forecast by Country, 2020-2035
  • Table 16: North America Market Volume (Units) Forecast by Country, 2020-2035
  • Table 17: North America Market Value (USD Million) Forecast by Functional Role, 2020-2035
  • Table 18: North America Market Volume (Units) Forecast by Functional Role, 2020-2035
  • Table 19: North America Market Value (USD Million) Forecast by Chemistry, 2020-2035
  • Table 20: North America Market Volume (Units) Forecast by Chemistry, 2020-2035
  • Table 21: North America Market Value (USD Million) Forecast by End Usr , 2020-2035
  • Table 22: North America Market Volume (Units) Forecast by End Usr , 2020-2035
  • Table 23: North America Market Value (USD Million) Forecast by Physical Form, 2020-2035
  • Table 24: North America Market Volume (Units) Forecast by Physical Form, 2020-2035
  • Table 25: North America Market Value (USD Million) Forecast by Application, 2020-2035
  • Table 26: North America Market Volume (Units) Forecast by Application, 2020-2035
  • Table 27: North America Market Value (USD Million) Forecast by End Use, 2020-2035
  • Table 28: North America Market Volume (Units) Forecast by End Use, 2020-2035
  • Table 29: Latin America Market Value (USD Million) Forecast by Country, 2020-2035
  • Table 30: Latin America Market Volume (Units) Forecast by Country, 2020-2035
  • Table 31: Latin America Market Value (USD Million) Forecast by Functional Role, 2020-2035
  • Table 32: Latin America Market Volume (Units) Forecast by Functional Role, 2020-2035
  • Table 33: Latin America Market Value (USD Million) Forecast by Chemistry, 2020-2035
  • Table 34: Latin America Market Volume (Units) Forecast by Chemistry, 2020-2035
  • Table 35: Latin America Market Value (USD Million) Forecast by End Usr , 2020-2035
  • Table 36: Latin America Market Volume (Units) Forecast by End Usr , 2020-2035
  • Table 37: Latin America Market Value (USD Million) Forecast by Physical Form, 2020-2035
  • Table 38: Latin America Market Volume (Units) Forecast by Physical Form, 2020-2035
  • Table 39: Latin America Market Value (USD Million) Forecast by Application, 2020-2035
  • Table 40: Latin America Market Volume (Units) Forecast by Application, 2020-2035
  • Table 41: Latin America Market Value (USD Million) Forecast by End Use, 2020-2035
  • Table 42: Latin America Market Volume (Units) Forecast by End Use, 2020-2035
  • Table 43: Europe Market Value (USD Million) Forecast by Country, 2020-2035
  • Table 44: Europe Market Volume (Units) Forecast by Country, 2020-2035
  • Table 45: Europe Market Value (USD Million) Forecast by Functional Role, 2020-2035
  • Table 46: Europe Market Volume (Units) Forecast by Functional Role, 2020-2035
  • Table 47: Europe Market Value (USD Million) Forecast by Chemistry, 2020-2035
  • Table 48: Europe Market Volume (Units) Forecast by Chemistry, 2020-2035
  • Table 49: Europe Market Value (USD Million) Forecast by End Usr , 2020-2035
  • Table 50: Europe Market Volume (Units) Forecast by End Usr , 2020-2035
  • Table 51: Europe Market Value (USD Million) Forecast by Physical Form, 2020-2035
  • Table 52: Europe Market Volume (Units) Forecast by Physical Form, 2020-2035
  • Table 53: Europe Market Value (USD Million) Forecast by Application, 2020-2035
  • Table 54: Europe Market Volume (Units) Forecast by Application, 2020-2035
  • Table 55: Europe Market Value (USD Million) Forecast by End Use, 2020-2035
  • Table 56: Europe Market Volume (Units) Forecast by End Use, 2020-2035
  • Table 57: East Asia Market Value (USD Million) Forecast by Country, 2020-2035
  • Table 58: East Asia Market Volume (Units) Forecast by Country, 2020-2035
  • Table 59: East Asia Market Value (USD Million) Forecast by Functional Role, 2020-2035
  • Table 60: East Asia Market Volume (Units) Forecast by Functional Role, 2020-2035
  • Table 61: East Asia Market Value (USD Million) Forecast by Chemistry, 2020-2035
  • Table 62: East Asia Market Volume (Units) Forecast by Chemistry, 2020-2035
  • Table 63: East Asia Market Value (USD Million) Forecast by End Usr , 2020-2035
  • Table 64: East Asia Market Volume (Units) Forecast by End Usr , 2020-2035
  • Table 65: East Asia Market Value (USD Million) Forecast by Physical Form, 2020-2035
  • Table 66: East Asia Market Volume (Units) Forecast by Physical Form, 2020-2035
  • Table 67: East Asia Market Value (USD Million) Forecast by Application, 2020-2035
  • Table 68: East Asia Market Volume (Units) Forecast by Application, 2020-2035
  • Table 69: East Asia Market Value (USD Million) Forecast by End Use, 2020-2035
  • Table 70: East Asia Market Volume (Units) Forecast by End Use, 2020-2035
  • Table 71: South Asia & Pacific Market Value (USD Million) Forecast by Country, 2020-2035
  • Table 72: South Asia & Pacific Market Volume (Units) Forecast by Country, 2020-2035
  • Table 73: South Asia & Pacific Market Value (USD Million) Forecast by Functional Role, 2020-2035
  • Table 74: South Asia & Pacific Market Volume (Units) Forecast by Functional Role, 2020-2035
  • Table 75: South Asia & Pacific Market Value (USD Million) Forecast by Chemistry, 2020-2035
  • Table 76: South Asia & Pacific Market Volume (Units) Forecast by Chemistry, 2020-2035
  • Table 77: South Asia & Pacific Market Value (USD Million) Forecast by End Usr , 2020-2035
  • Table 78: South Asia & Pacific Market Volume (Units) Forecast by End Usr , 2020-2035
  • Table 79: South Asia & Pacific Market Value (USD Million) Forecast by Physical Form, 2020-2035
  • Table 80: South Asia & Pacific Market Volume (Units) Forecast by Physical Form, 2020-2035
  • Table 81: South Asia & Pacific Market Value (USD Million) Forecast by Application, 2020-2035
  • Table 82: South Asia & Pacific Market Volume (Units) Forecast by Application, 2020-2035
  • Table 83: South Asia & Pacific Market Value (USD Million) Forecast by End Use, 2020-2035
  • Table 84: South Asia & Pacific Market Volume (Units) Forecast by End Use, 2020-2035
  • Table 85: Middle East and Africa Market Value (USD Million) Forecast by Country, 2020-2035
  • Table 86: Middle East and Africa Market Volume (Units) Forecast by Country, 2020-2035
  • Table 87: Middle East and Africa Market Value (USD Million) Forecast by Functional Role, 2020-2035
  • Table 88: Middle East and Africa Market Volume (Units) Forecast by Functional Role, 2020-2035
  • Table 89: Middle East and Africa Market Value (USD Million) Forecast by Chemistry, 2020-2035
  • Table 90: Middle East and Africa Market Volume (Units) Forecast by Chemistry, 2020-2035
  • Table 91: Middle East and Africa Market Value (USD Million) Forecast by End Usr , 2020-2035
  • Table 92: Middle East and Africa Market Volume (Units) Forecast by End Usr , 2020-2035
  • Table 93: Middle East and Africa Market Value (USD Million) Forecast by Physical Form, 2020-2035
  • Table 94: Middle East and Africa Market Volume (Units) Forecast by Physical Form, 2020-2035
  • Table 95: Middle East and Africa Market Value (USD Million) Forecast by Application, 2020-2035
  • Table 96: Middle East and Africa Market Volume (Units) Forecast by Application, 2020-2035
  • Table 97: Middle East and Africa Market Value (USD Million) Forecast by End Use, 2020-2035
  • Table 98: Middle East and Africa Market Volume (Units) Forecast by End Use, 2020-2035

List of Figures

  • Figure 1: Global Market Value (USD Million) by Functional Role, 2025-2035
  • Figure 2: Global Market Value (USD Million) by Chemistry, 2025-2035
  • Figure 3: Global Market Value (USD Million) by End Usr , 2025-2035
  • Figure 4: Global Market Value (USD Million) by Physical Form, 2025-2035
  • Figure 5: Global Market Value (USD Million) by Application, 2025-2035
  • Figure 6: Global Market Value (USD Million) by End Use, 2025-2035
  • Figure 7: Global Market Value (USD Million) by Region, 2025-2035
  • Figure 8: Global Market Value (USD Million) Analysis by Region, 2020-2035
  • Figure 9: Global Market Volume (Units) Analysis by Region, 2020-2035
  • Figure 10: Global Market Value Share (%) and BPS Analysis by Region, 2025-2035
  • Figure 11: Global Market Y-o-Y Growth (%) Projections by Region, 2025-2035
  • Figure 12: Global Market Value (USD Million) Analysis by Functional Role, 2020-2035
  • Figure 13: Global Market Volume (Units) Analysis by Functional Role, 2020-2035
  • Figure 14: Global Market Value Share (%) and BPS Analysis by Functional Role, 2025-2035
  • Figure 15: Global Market Y-o-Y Growth (%) Projections by Functional Role, 2025-2035
  • Figure 16: Global Market Value (USD Million) Analysis by Chemistry, 2020-2035
  • Figure 17: Global Market Volume (Units) Analysis by Chemistry, 2020-2035
  • Figure 18: Global Market Value Share (%) and BPS Analysis by Chemistry, 2025-2035
  • Figure 19: Global Market Y-o-Y Growth (%) Projections by Chemistry, 2025-2035
  • Figure 20: Global Market Value (USD Million) Analysis by End Usr , 2020-2035
  • Figure 21: Global Market Volume (Units) Analysis by End Usr , 2020-2035
  • Figure 22: Global Market Value Share (%) and BPS Analysis by End Usr , 2025-2035
  • Figure 23: Global Market Y-o-Y Growth (%) Projections by End Usr , 2025-2035
  • Figure 24: Global Market Value (USD Million) Analysis by Physical Form, 2020-2035
  • Figure 25: Global Market Volume (Units) Analysis by Physical Form, 2020-2035
  • Figure 26: Global Market Value Share (%) and BPS Analysis by Physical Form, 2025-2035
  • Figure 27: Global Market Y-o-Y Growth (%) Projections by Physical Form, 2025-2035
  • Figure 28: Global Market Value (USD Million) Analysis by Application, 2020-2035
  • Figure 29: Global Market Volume (Units) Analysis by Application, 2020-2035
  • Figure 30: Global Market Value Share (%) and BPS Analysis by Application, 2025-2035
  • Figure 31: Global Market Y-o-Y Growth (%) Projections by Application, 2025-2035
  • Figure 32: Global Market Value (USD Million) Analysis by End Use, 2020-2035
  • Figure 33: Global Market Volume (Units) Analysis by End Use, 2020-2035
  • Figure 34: Global Market Value Share (%) and BPS Analysis by End Use, 2025-2035
  • Figure 35: Global Market Y-o-Y Growth (%) Projections by End Use, 2025-2035
  • Figure 36: Global Market Attractiveness by Functional Role, 2025-2035
  • Figure 37: Global Market Attractiveness by Chemistry, 2025-2035
  • Figure 38: Global Market Attractiveness by End Usr , 2025-2035
  • Figure 39: Global Market Attractiveness by Physical Form, 2025-2035
  • Figure 40: Global Market Attractiveness by Application, 2025-2035
  • Figure 41: Global Market Attractiveness by End Use, 2025-2035
  • Figure 42: Global Market Attractiveness by Region, 2025-2035
  • Figure 43: North America Market Value (USD Million) by Functional Role, 2025-2035
  • Figure 44: North America Market Value (USD Million) by Chemistry, 2025-2035
  • Figure 45: North America Market Value (USD Million) by End Usr , 2025-2035
  • Figure 46: North America Market Value (USD Million) by Physical Form, 2025-2035
  • Figure 47: North America Market Value (USD Million) by Application, 2025-2035
  • Figure 48: North America Market Value (USD Million) by End Use, 2025-2035
  • Figure 49: North America Market Value (USD Million) by Country, 2025-2035
  • Figure 50: North America Market Value (USD Million) Analysis by Country, 2020-2035
  • Figure 51: North America Market Volume (Units) Analysis by Country, 2020-2035
  • Figure 52: North America Market Value Share (%) and BPS Analysis by Country, 2025-2035
  • Figure 53: North America Market Y-o-Y Growth (%) Projections by Country, 2025-2035
  • Figure 54: North America Market Value (USD Million) Analysis by Functional Role, 2020-2035
  • Figure 55: North America Market Volume (Units) Analysis by Functional Role, 2020-2035
  • Figure 56: North America Market Value Share (%) and BPS Analysis by Functional Role, 2025-2035
  • Figure 57: North America Market Y-o-Y Growth (%) Projections by Functional Role, 2025-2035
  • Figure 58: North America Market Value (USD Million) Analysis by Chemistry, 2020-2035
  • Figure 59: North America Market Volume (Units) Analysis by Chemistry, 2020-2035
  • Figure 60: North America Market Value Share (%) and BPS Analysis by Chemistry, 2025-2035
  • Figure 61: North America Market Y-o-Y Growth (%) Projections by Chemistry, 2025-2035
  • Figure 62: North America Market Value (USD Million) Analysis by End Usr , 2020-2035
  • Figure 63: North America Market Volume (Units) Analysis by End Usr , 2020-2035
  • Figure 64: North America Market Value Share (%) and BPS Analysis by End Usr , 2025-2035
  • Figure 65: North America Market Y-o-Y Growth (%) Projections by End Usr , 2025-2035
  • Figure 66: North America Market Value (USD Million) Analysis by Physical Form, 2020-2035
  • Figure 67: North America Market Volume (Units) Analysis by Physical Form, 2020-2035
  • Figure 68: North America Market Value Share (%) and BPS Analysis by Physical Form, 2025-2035
  • Figure 69: North America Market Y-o-Y Growth (%) Projections by Physical Form, 2025-2035
  • Figure 70: North America Market Value (USD Million) Analysis by Application, 2020-2035
  • Figure 71: North America Market Volume (Units) Analysis by Application, 2020-2035
  • Figure 72: North America Market Value Share (%) and BPS Analysis by Application, 2025-2035
  • Figure 73: North America Market Y-o-Y Growth (%) Projections by Application, 2025-2035
  • Figure 74: North America Market Value (USD Million) Analysis by End Use, 2020-2035
  • Figure 75: North America Market Volume (Units) Analysis by End Use, 2020-2035
  • Figure 76: North America Market Value Share (%) and BPS Analysis by End Use, 2025-2035
  • Figure 77: North America Market Y-o-Y Growth (%) Projections by End Use, 2025-2035
  • Figure 78: North America Market Attractiveness by Functional Role, 2025-2035
  • Figure 79: North America Market Attractiveness by Chemistry, 2025-2035
  • Figure 80: North America Market Attractiveness by End Usr , 2025-2035
  • Figure 81: North America Market Attractiveness by Physical Form, 2025-2035
  • Figure 82: North America Market Attractiveness by Application, 2025-2035
  • Figure 83: North America Market Attractiveness by End Use, 2025-2035
  • Figure 84: North America Market Attractiveness by Country, 2025-2035
  • Figure 85: Latin America Market Value (USD Million) by Functional Role, 2025-2035
  • Figure 86: Latin America Market Value (USD Million) by Chemistry, 2025-2035
  • Figure 87: Latin America Market Value (USD Million) by End Usr , 2025-2035
  • Figure 88: Latin America Market Value (USD Million) by Physical Form, 2025-2035
  • Figure 89: Latin America Market Value (USD Million) by Application, 2025-2035
  • Figure 90: Latin America Market Value (USD Million) by End Use, 2025-2035
  • Figure 91: Latin America Market Value (USD Million) by Country, 2025-2035
  • Figure 92: Latin America Market Value (USD Million) Analysis by Country, 2020-2035
  • Figure 93: Latin America Market Volume (Units) Analysis by Country, 2020-2035
  • Figure 94: Latin America Market Value Share (%) and BPS Analysis by Country, 2025-2035
  • Figure 95: Latin America Market Y-o-Y Growth (%) Projections by Country, 2025-2035
  • Figure 96: Latin America Market Value (USD Million) Analysis by Functional Role, 2020-2035
  • Figure 97: Latin America Market Volume (Units) Analysis by Functional Role, 2020-2035
  • Figure 98: Latin America Market Value Share (%) and BPS Analysis by Functional Role, 2025-2035
  • Figure 99: Latin America Market Y-o-Y Growth (%) Projections by Functional Role, 2025-2035
  • Figure 100: Latin America Market Value (USD Million) Analysis by Chemistry, 2020-2035
  • Figure 101: Latin America Market Volume (Units) Analysis by Chemistry, 2020-2035
  • Figure 102: Latin America Market Value Share (%) and BPS Analysis by Chemistry, 2025-2035
  • Figure 103: Latin America Market Y-o-Y Growth (%) Projections by Chemistry, 2025-2035
  • Figure 104: Latin America Market Value (USD Million) Analysis by End Usr , 2020-2035
  • Figure 105: Latin America Market Volume (Units) Analysis by End Usr , 2020-2035
  • Figure 106: Latin America Market Value Share (%) and BPS Analysis by End Usr , 2025-2035
  • Figure 107: Latin America Market Y-o-Y Growth (%) Projections by End Usr , 2025-2035
  • Figure 108: Latin America Market Value (USD Million) Analysis by Physical Form, 2020-2035
  • Figure 109: Latin America Market Volume (Units) Analysis by Physical Form, 2020-2035
  • Figure 110: Latin America Market Value Share (%) and BPS Analysis by Physical Form, 2025-2035
  • Figure 111: Latin America Market Y-o-Y Growth (%) Projections by Physical Form, 2025-2035
  • Figure 112: Latin America Market Value (USD Million) Analysis by Application, 2020-2035
  • Figure 113: Latin America Market Volume (Units) Analysis by Application, 2020-2035
  • Figure 114: Latin America Market Value Share (%) and BPS Analysis by Application, 2025-2035
  • Figure 115: Latin America Market Y-o-Y Growth (%) Projections by Application, 2025-2035
  • Figure 116: Latin America Market Value (USD Million) Analysis by End Use, 2020-2035
  • Figure 117: Latin America Market Volume (Units) Analysis by End Use, 2020-2035
  • Figure 118: Latin America Market Value Share (%) and BPS Analysis by End Use, 2025-2035
  • Figure 119: Latin America Market Y-o-Y Growth (%) Projections by End Use, 2025-2035
  • Figure 120: Latin America Market Attractiveness by Functional Role, 2025-2035
  • Figure 121: Latin America Market Attractiveness by Chemistry, 2025-2035
  • Figure 122: Latin America Market Attractiveness by End Usr , 2025-2035
  • Figure 123: Latin America Market Attractiveness by Physical Form, 2025-2035
  • Figure 124: Latin America Market Attractiveness by Application, 2025-2035
  • Figure 125: Latin America Market Attractiveness by End Use, 2025-2035
  • Figure 126: Latin America Market Attractiveness by Country, 2025-2035
  • Figure 127: Europe Market Value (USD Million) by Functional Role, 2025-2035
  • Figure 128: Europe Market Value (USD Million) by Chemistry, 2025-2035
  • Figure 129: Europe Market Value (USD Million) by End Usr , 2025-2035
  • Figure 130: Europe Market Value (USD Million) by Physical Form, 2025-2035
  • Figure 131: Europe Market Value (USD Million) by Application, 2025-2035
  • Figure 132: Europe Market Value (USD Million) by End Use, 2025-2035
  • Figure 133: Europe Market Value (USD Million) by Country, 2025-2035
  • Figure 134: Europe Market Value (USD Million) Analysis by Country, 2020-2035
  • Figure 135: Europe Market Volume (Units) Analysis by Country, 2020-2035
  • Figure 136: Europe Market Value Share (%) and BPS Analysis by Country, 2025-2035
  • Figure 137: Europe Market Y-o-Y Growth (%) Projections by Country, 2025-2035
  • Figure 138: Europe Market Value (USD Million) Analysis by Functional Role, 2020-2035
  • Figure 139: Europe Market Volume (Units) Analysis by Functional Role, 2020-2035
  • Figure 140: Europe Market Value Share (%) and BPS Analysis by Functional Role, 2025-2035
  • Figure 141: Europe Market Y-o-Y Growth (%) Projections by Functional Role, 2025-2035
  • Figure 142: Europe Market Value (USD Million) Analysis by Chemistry, 2020-2035
  • Figure 143: Europe Market Volume (Units) Analysis by Chemistry, 2020-2035
  • Figure 144: Europe Market Value Share (%) and BPS Analysis by Chemistry, 2025-2035
  • Figure 145: Europe Market Y-o-Y Growth (%) Projections by Chemistry, 2025-2035
  • Figure 146: Europe Market Value (USD Million) Analysis by End Usr , 2020-2035
  • Figure 147: Europe Market Volume (Units) Analysis by End Usr , 2020-2035
  • Figure 148: Europe Market Value Share (%) and BPS Analysis by End Usr , 2025-2035
  • Figure 149: Europe Market Y-o-Y Growth (%) Projections by End Usr , 2025-2035
  • Figure 150: Europe Market Value (USD Million) Analysis by Physical Form, 2020-2035
  • Figure 151: Europe Market Volume (Units) Analysis by Physical Form, 2020-2035
  • Figure 152: Europe Market Value Share (%) and BPS Analysis by Physical Form, 2025-2035
  • Figure 153: Europe Market Y-o-Y Growth (%) Projections by Physical Form, 2025-2035
  • Figure 154: Europe Market Value (USD Million) Analysis by Application, 2020-2035
  • Figure 155: Europe Market Volume (Units) Analysis by Application, 2020-2035
  • Figure 156: Europe Market Value Share (%) and BPS Analysis by Application, 2025-2035
  • Figure 157: Europe Market Y-o-Y Growth (%) Projections by Application, 2025-2035
  • Figure 158: Europe Market Value (USD Million) Analysis by End Use, 2020-2035
  • Figure 159: Europe Market Volume (Units) Analysis by End Use, 2020-2035
  • Figure 160: Europe Market Value Share (%) and BPS Analysis by End Use, 2025-2035
  • Figure 161: Europe Market Y-o-Y Growth (%) Projections by End Use, 2025-2035
  • Figure 162: Europe Market Attractiveness by Functional Role, 2025-2035
  • Figure 163: Europe Market Attractiveness by Chemistry, 2025-2035
  • Figure 164: Europe Market Attractiveness by End Usr , 2025-2035
  • Figure 165: Europe Market Attractiveness by Physical Form, 2025-2035
  • Figure 166: Europe Market Attractiveness by Application, 2025-2035
  • Figure 167: Europe Market Attractiveness by End Use, 2025-2035
  • Figure 168: Europe Market Attractiveness by Country, 2025-2035
  • Figure 169: East Asia Market Value (USD Million) by Functional Role, 2025-2035
  • Figure 170: East Asia Market Value (USD Million) by Chemistry, 2025-2035
  • Figure 171: East Asia Market Value (USD Million) by End Usr , 2025-2035
  • Figure 172: East Asia Market Value (USD Million) by Physical Form, 2025-2035
  • Figure 173: East Asia Market Value (USD Million) by Application, 2025-2035
  • Figure 174: East Asia Market Value (USD Million) by End Use, 2025-2035
  • Figure 175: East Asia Market Value (USD Million) by Country, 2025-2035
  • Figure 176: East Asia Market Value (USD Million) Analysis by Country, 2020-2035
  • Figure 177: East Asia Market Volume (Units) Analysis by Country, 2020-2035
  • Figure 178: East Asia Market Value Share (%) and BPS Analysis by Country, 2025-2035
  • Figure 179: East Asia Market Y-o-Y Growth (%) Projections by Country, 2025-2035
  • Figure 180: East Asia Market Value (USD Million) Analysis by Functional Role, 2020-2035
  • Figure 181: East Asia Market Volume (Units) Analysis by Functional Role, 2020-2035
  • Figure 182: East Asia Market Value Share (%) and BPS Analysis by Functional Role, 2025-2035
  • Figure 183: East Asia Market Y-o-Y Growth (%) Projections by Functional Role, 2025-2035
  • Figure 184: East Asia Market Value (USD Million) Analysis by Chemistry, 2020-2035
  • Figure 185: East Asia Market Volume (Units) Analysis by Chemistry, 2020-2035
  • Figure 186: East Asia Market Value Share (%) and BPS Analysis by Chemistry, 2025-2035
  • Figure 187: East Asia Market Y-o-Y Growth (%) Projections by Chemistry, 2025-2035
  • Figure 188: East Asia Market Value (USD Million) Analysis by End Usr , 2020-2035
  • Figure 189: East Asia Market Volume (Units) Analysis by End Usr , 2020-2035
  • Figure 190: East Asia Market Value Share (%) and BPS Analysis by End Usr , 2025-2035
  • Figure 191: East Asia Market Y-o-Y Growth (%) Projections by End Usr , 2025-2035
  • Figure 192: East Asia Market Value (USD Million) Analysis by Physical Form, 2020-2035
  • Figure 193: East Asia Market Volume (Units) Analysis by Physical Form, 2020-2035
  • Figure 194: East Asia Market Value Share (%) and BPS Analysis by Physical Form, 2025-2035
  • Figure 195: East Asia Market Y-o-Y Growth (%) Projections by Physical Form, 2025-2035
  • Figure 196: East Asia Market Value (USD Million) Analysis by Application, 2020-2035
  • Figure 197: East Asia Market Volume (Units) Analysis by Application, 2020-2035
  • Figure 198: East Asia Market Value Share (%) and BPS Analysis by Application, 2025-2035
  • Figure 199: East Asia Market Y-o-Y Growth (%) Projections by Application, 2025-2035
  • Figure 200: East Asia Market Value (USD Million) Analysis by End Use, 2020-2035
  • Figure 201: East Asia Market Volume (Units) Analysis by End Use, 2020-2035
  • Figure 202: East Asia Market Value Share (%) and BPS Analysis by End Use, 2025-2035
  • Figure 203: East Asia Market Y-o-Y Growth (%) Projections by End Use, 2025-2035
  • Figure 204: East Asia Market Attractiveness by Functional Role, 2025-2035
  • Figure 205: East Asia Market Attractiveness by Chemistry, 2025-2035
  • Figure 206: East Asia Market Attractiveness by End Usr , 2025-2035
  • Figure 207: East Asia Market Attractiveness by Physical Form, 2025-2035
  • Figure 208: East Asia Market Attractiveness by Application, 2025-2035
  • Figure 209: East Asia Market Attractiveness by End Use, 2025-2035
  • Figure 210: East Asia Market Attractiveness by Country, 2025-2035
  • Figure 211: South Asia & Pacific Market Value (USD Million) by Functional Role, 2025-2035
  • Figure 212: South Asia & Pacific Market Value (USD Million) by Chemistry, 2025-2035
  • Figure 213: South Asia & Pacific Market Value (USD Million) by End Usr , 2025-2035
  • Figure 214: South Asia & Pacific Market Value (USD Million) by Physical Form, 2025-2035
  • Figure 215: South Asia & Pacific Market Value (USD Million) by Application, 2025-2035
  • Figure 216: South Asia & Pacific Market Value (USD Million) by End Use, 2025-2035
  • Figure 217: South Asia & Pacific Market Value (USD Million) by Country, 2025-2035
  • Figure 218: South Asia & Pacific Market Value (USD Million) Analysis by Country, 2020-2035
  • Figure 219: South Asia & Pacific Market Volume (Units) Analysis by Country, 2020-2035
  • Figure 220: South Asia & Pacific Market Value Share (%) and BPS Analysis by Country, 2025-2035
  • Figure 221: South Asia & Pacific Market Y-o-Y Growth (%) Projections by Country, 2025-2035
  • Figure 222: South Asia & Pacific Market Value (USD Million) Analysis by Functional Role, 2020-2035
  • Figure 223: South Asia & Pacific Market Volume (Units) Analysis by Functional Role, 2020-2035
  • Figure 224: South Asia & Pacific Market Value Share (%) and BPS Analysis by Functional Role, 2025-2035
  • Figure 225: South Asia & Pacific Market Y-o-Y Growth (%) Projections by Functional Role, 2025-2035
  • Figure 226: South Asia & Pacific Market Value (USD Million) Analysis by Chemistry, 2020-2035
  • Figure 227: South Asia & Pacific Market Volume (Units) Analysis by Chemistry, 2020-2035
  • Figure 228: South Asia & Pacific Market Value Share (%) and BPS Analysis by Chemistry, 2025-2035
  • Figure 229: South Asia & Pacific Market Y-o-Y Growth (%) Projections by Chemistry, 2025-2035
  • Figure 230: South Asia & Pacific Market Value (USD Million) Analysis by End Usr , 2020-2035
  • Figure 231: South Asia & Pacific Market Volume (Units) Analysis by End Usr , 2020-2035
  • Figure 232: South Asia & Pacific Market Value Share (%) and BPS Analysis by End Usr , 2025-2035
  • Figure 233: South Asia & Pacific Market Y-o-Y Growth (%) Projections by End Usr , 2025-2035
  • Figure 234: South Asia & Pacific Market Value (USD Million) Analysis by Physical Form, 2020-2035
  • Figure 235: South Asia & Pacific Market Volume (Units) Analysis by Physical Form, 2020-2035
  • Figure 236: South Asia & Pacific Market Value Share (%) and BPS Analysis by Physical Form, 2025-2035
  • Figure 237: South Asia & Pacific Market Y-o-Y Growth (%) Projections by Physical Form, 2025-2035
  • Figure 238: South Asia & Pacific Market Value (USD Million) Analysis by Application, 2020-2035
  • Figure 239: South Asia & Pacific Market Volume (Units) Analysis by Application, 2020-2035
  • Figure 240: South Asia & Pacific Market Value Share (%) and BPS Analysis by Application, 2025-2035
  • Figure 241: South Asia & Pacific Market Y-o-Y Growth (%) Projections by Application, 2025-2035
  • Figure 242: South Asia & Pacific Market Value (USD Million) Analysis by End Use, 2020-2035
  • Figure 243: South Asia & Pacific Market Volume (Units) Analysis by End Use, 2020-2035
  • Figure 244: South Asia & Pacific Market Value Share (%) and BPS Analysis by End Use, 2025-2035
  • Figure 245: South Asia & Pacific Market Y-o-Y Growth (%) Projections by End Use, 2025-2035
  • Figure 246: South Asia & Pacific Market Attractiveness by Functional Role, 2025-2035
  • Figure 247: South Asia & Pacific Market Attractiveness by Chemistry, 2025-2035
  • Figure 248: South Asia & Pacific Market Attractiveness by End Usr , 2025-2035
  • Figure 249: South Asia & Pacific Market Attractiveness by Physical Form, 2025-2035
  • Figure 250: South Asia & Pacific Market Attractiveness by Application, 2025-2035
  • Figure 251: South Asia & Pacific Market Attractiveness by End Use, 2025-2035
  • Figure 252: South Asia & Pacific Market Attractiveness by Country, 2025-2035
  • Figure 253: Middle East and Africa Market Value (USD Million) by Functional Role, 2025-2035
  • Figure 254: Middle East and Africa Market Value (USD Million) by Chemistry, 2025-2035
  • Figure 255: Middle East and Africa Market Value (USD Million) by End Usr , 2025-2035
  • Figure 256: Middle East and Africa Market Value (USD Million) by Physical Form, 2025-2035
  • Figure 257: Middle East and Africa Market Value (USD Million) by Application, 2025-2035
  • Figure 258: Middle East and Africa Market Value (USD Million) by End Use, 2025-2035
  • Figure 259: Middle East and Africa Market Value (USD Million) by Country, 2025-2035
  • Figure 260: Middle East and Africa Market Value (USD Million) Analysis by Country, 2020-2035
  • Figure 261: Middle East and Africa Market Volume (Units) Analysis by Country, 2020-2035
  • Figure 262: Middle East and Africa Market Value Share (%) and BPS Analysis by Country, 2025-2035
  • Figure 263: Middle East and Africa Market Y-o-Y Growth (%) Projections by Country, 2025-2035
  • Figure 264: Middle East and Africa Market Value (USD Million) Analysis by Functional Role, 2020-2035
  • Figure 265: Middle East and Africa Market Volume (Units) Analysis by Functional Role, 2020-2035
  • Figure 266: Middle East and Africa Market Value Share (%) and BPS Analysis by Functional Role, 2025-2035
  • Figure 267: Middle East and Africa Market Y-o-Y Growth (%) Projections by Functional Role, 2025-2035
  • Figure 268: Middle East and Africa Market Value (USD Million) Analysis by Chemistry, 2020-2035
  • Figure 269: Middle East and Africa Market Volume (Units) Analysis by Chemistry, 2020-2035
  • Figure 270: Middle East and Africa Market Value Share (%) and BPS Analysis by Chemistry, 2025-2035
  • Figure 271: Middle East and Africa Market Y-o-Y Growth (%) Projections by Chemistry, 2025-2035
  • Figure 272: Middle East and Africa Market Value (USD Million) Analysis by End Usr , 2020-2035
  • Figure 273: Middle East and Africa Market Volume (Units) Analysis by End Usr , 2020-2035
  • Figure 274: Middle East and Africa Market Value Share (%) and BPS Analysis by End Usr , 2025-2035
  • Figure 275: Middle East and Africa Market Y-o-Y Growth (%) Projections by End Usr , 2025-2035
  • Figure 276: Middle East and Africa Market Value (USD Million) Analysis by Physical Form, 2020-2035
  • Figure 277: Middle East and Africa Market Volume (Units) Analysis by Physical Form, 2020-2035
  • Figure 278: Middle East and Africa Market Value Share (%) and BPS Analysis by Physical Form, 2025-2035
  • Figure 279: Middle East and Africa Market Y-o-Y Growth (%) Projections by Physical Form, 2025-2035
  • Figure 280: Middle East and Africa Market Value (USD Million) Analysis by Application, 2020-2035
  • Figure 281: Middle East and Africa Market Volume (Units) Analysis by Application, 2020-2035
  • Figure 282: Middle East and Africa Market Value Share (%) and BPS Analysis by Application, 2025-2035
  • Figure 283: Middle East and Africa Market Y-o-Y Growth (%) Projections by Application, 2025-2035
  • Figure 284: Middle East and Africa Market Value (USD Million) Analysis by End Use, 2020-2035
  • Figure 285: Middle East and Africa Market Volume (Units) Analysis by End Use, 2020-2035
  • Figure 286: Middle East and Africa Market Value Share (%) and BPS Analysis by End Use, 2025-2035
  • Figure 287: Middle East and Africa Market Y-o-Y Growth (%) Projections by End Use, 2025-2035
  • Figure 288: Middle East and Africa Market Attractiveness by Functional Role, 2025-2035
  • Figure 289: Middle East and Africa Market Attractiveness by Chemistry, 2025-2035
  • Figure 290: Middle East and Africa Market Attractiveness by End Usr , 2025-2035
  • Figure 291: Middle East and Africa Market Attractiveness by Physical Form, 2025-2035
  • Figure 292: Middle East and Africa Market Attractiveness by Application, 2025-2035
  • Figure 293: Middle East and Africa Market Attractiveness by End Use, 2025-2035
  • Figure 294: Middle East and Africa Market Attractiveness by Country, 2025-2035

Frequently Asked Questions

How big is the Co-Emulsifiers Market in 2025?

The global Co-Emulsifiers Market is estimated to be valued at USD 2,304.2 million in 2025.

What will be the size of Co-Emulsifiers Market in 2035?

The market size for the Co-Emulsifiers Market is projected to reach USD 4,801.2 million by 2035.

How much will be the Co-Emulsifiers Market growth between 2025 and 2035?

The Co-Emulsifiers Market is expected to grow at a 7.6% CAGR between 2025 and 2035.

What are the key chemistry types in the Co-Emulsifiers Market?

The key chemistry types in the Co-Emulsifiers Market are co-emulsifying waxes, polyglyceryl esters, sorbitan esters, and alkyl glucosides (PEG-free).

Which range segment to contribute significant share in the Co-Emulsifiers Market in 2025?

In terms of delivery systems, the free-form segment is set to command the significant share in 2025, accounting for 52.2% of market value.

Future Market Insights

Co-Emulsifiers Market

Chat With

MaRIA

Hi There, I am MaRIA, Your Market Research Intelligence Assistant. How may I help you?