Coenzyme Q10 Market Size, Share, and Forecast Outlook 2025 to 2035

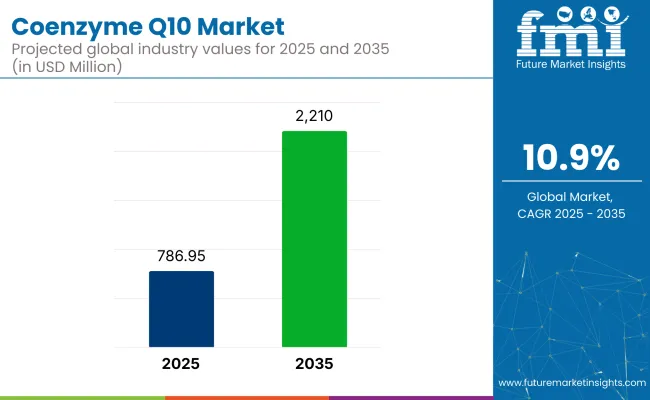
The Coenzyme Q10 market is expected to see significant growth, driven by rising consumer awareness of its health benefits, particularly in energy production, heart health, and anti-aging. The industry is expected to grow from USD 786.95 million in 2025 to USD 2,210 million by 2035, reflecting a CAGR of 10.9%.
Quick Stats for the Coenzyme Q10 Market

  • Market Value (2025): USD 786.95 million
  • Forecast Value (2035): USD 2,210 million
  • Forecast CAGR: 10.9%
  • Leading Segment in 2025: Dietary Supplements
  • Key Growth Region: North America (United States)
  • Top Key Players: Country Life, LLC, Doctor’s Best, DSM, GNC Holdings, Inc., Healthy Origins

Coenzyme Q10 Market

In a recent interview, Duke Pitts, President of Healthy Extracts, emphasized the importance of Coenzyme Q10 for those on statin therapy, stating, “If you take a statin, our new STAT10 is a must-have addition to your daily health regime.” This highlights the growing recognition of CoQ10’s role in supporting heart health and its critical contribution to individuals managing statin-induced nutrient depletion, thus promoting overall wellness.

The coenzyme Q10 market holds varying shares within its parent markets. Within the nutraceuticals market, Coenzyme Q10 accounts for approximately 5-7%, driven by its widespread use in supplements for heart health and energy. In the vitamins and supplements market, its share is around 3-5%, as it competes with other popular supplements like vitamins C and D.

Within the pharmaceuticals market, Coenzyme Q10 represents a smaller share of about 1-2%, mainly used in specialized treatments for cardiovascular diseases and as an adjunct therapy for other conditions. In the cosmetics and personal care market, its share is approximately 2-3%, due to its inclusion in anti-aging products. In the functional foods and beverages market, Coenzyme Q10 holds around 1-2%, added to energy drinks and health-boosting foods.

Key players such as Kaneka Corporation, DSM, and Doctor’s Best are enhancing their portfolios through innovations in formulations and advanced delivery systems. As demand for natural health supplements continues to rise, CoQ10’s role in energy production, anti-aging, and cardiovascular health is driving its strong growth globally, particularly in regions like North America, Europe, and Asia-Pacific.

Analyzing Coenzyme Q10 Market by Top Investment Segments

The Coenzyme Q10 market is expected to grow, driven by key segments including Ubiquinol, pharmaceutical-grade products, dietary supplements, and distribution channels like supermarkets. Ubiquinol and pharmaceutical-grade CoQ10 will continue leading, with strong demand for functional and effective supplements.

Ubiquinol (reduced form) leads the product segment in 2025

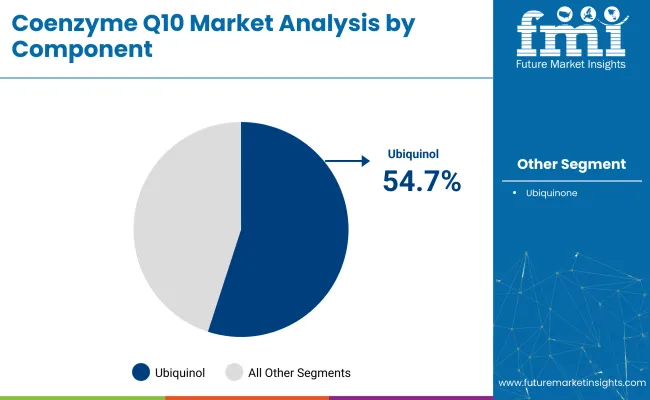
Ubiquinol is projected to dominate the CoQ10 product segment in 2025, capturing 54.7% of the industry share. Known for its higher bioavailability than ubiquinone (oxidized form), ubiquinol is widely used in dietary supplements and functional foods.

Leading manufacturers such as Kaneka Corporation and DSM continue to focus on improving ubiquinol’s formulation efficiency to meet consumer demand for natural and effective supplements. Ubiquinol’s superior absorption makes it a preferred choice for consumers seeking energy, anti-aging, and cardiovascular health benefits.
  • Higher bioavailability makes it a preferred choice
  • Popular in energy, anti-aging, and heart health supplements
  • Leading manufacturers focus on improving formulation efficiency

Coenzyme Q10 Market Analysis By Component

Pharmaceutical grade CoQ10 to lead the grade segment in 2025

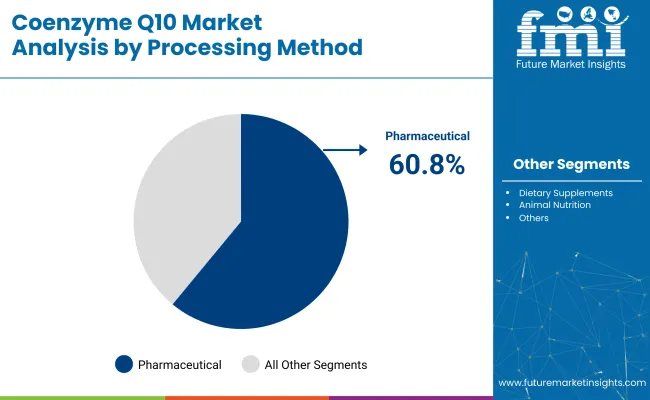
Pharmaceutical-grade CoQ10 is expected to hold a 60.8% share of the industry by 2025. This form of CoQ10 is extensively used in medical applications, particularly for heart health treatments and clinical supplements. Pharmaceutical-grade CoQ10 is essential in prescription medications and is highly valued for its efficacy in managing cardiovascular health.

Key companies like Kaneka Corporation and Pharma Nord are heavily investing in R&D to meet the growing demand for effective, high-quality CoQ10 products. The segment is projected to continue growing, driven by increasing awareness of its health benefits.
  • Widely used in clinical and medical applications
  • Increased demand for high-quality, effective CoQ10
  • R&D investments to improve product effectiveness and quality

Coenzyme Q10 Market Analysis By Processing Method

Powder & crystalline forms to dominate the formulation segment

Powder and crystalline CoQ10 formulations are set to dominate the industry with a 26.5% share in 2025. These formulations are preferred for their versatility and ease of incorporation into dietary supplements, functional foods, and energy drinks. Companies like Jarrow Formulas and DSM focus on enhancing the absorption of powder-based CoQ10 to increase product effectiveness.

The growing demand for energy-boosting and heart health supplements ensures powder and crystalline CoQ10 forms remain a leading choice. These forms are seen as both affordable and efficient solutions for consumers seeking daily health maintenance.

  • Versatile and easy to incorporate into various products
  • Popular in energy-boosting and heart health supplements
  • Enhanced absorption makes them a top choice for consumers

Dietary supplements to dominate the application segment in 2025

Dietary supplements are expected to capture 42.1% of the CoQ10 industry in 2025. The rising consumer focus on health and wellness, particularly in areas such as cardiovascular health, anti-aging, and energy-boosting benefits, is driving demand for CoQ10 in various forms like softgels, chewables, and powders.

Leading brands such as Doctor’s Best and GNC Holdings, Inc. are expanding their CoQ10 product offerings in line with consumer preferences. The dietary supplements segment is expected to lead industry growth, particularly in North America and Europe, as awareness of CoQ10’s benefits increases.

  • Rising interest in cardiovascular health, anti-aging, and energy
  • Growing consumer demand for heart health supplements
  • Expanding product offerings to meet global demand

Retail pharmacies & drug stores lead the distribution channel in 2025

Retail pharmacies and drug stores are expected to account for 20.3% of the CoQ10 industry in 2025. These channels are preferred for their accessibility and consumer trust in established pharmacies for health products. Companies like GNC Holdings and Vitamin Shoppe are expanding their retail networks, providing easier access to CoQ10 supplements.

The offline retail environment remains important, as it allows consumers to examine product labels, receive professional guidance, and take advantage of in-store promotions. This trust and convenience continue to strengthen retail pharmacies and drug stores as a key distribution channel.

  • Preferred for accessibility and consumer trust
  • In-store promotions drive sales in offline retail environments
  • Growing investment by key players in retail networks

Top Coenzyme Q10 Market Dynamic

The coenzyme Q10 market is growing due to increasing demand for natural supplements that support heart health, energy production, and anti-aging. However, regulatory challenges and raw material sourcing issues hinder growth, prompting companies to focus on improving efficiency and compliance.

Rising Demand for Natural Health Supplements Driving Market Growth

The coenzyme Q10 (CoQ10) industry is expanding, largely driven by increasing consumer demand for natural health supplements. As more individuals seek to enhance heart health, boost energy levels, and slow the effects of aging, the popularity of CoQ10 in dietary supplements and functional foods is growing.

CoQ10’s well-documented benefits in supporting cellular energy production are fueling its adoption, particularly in the wellness and anti-aging sectors. As consumer awareness continues to rise, CoQ10’s role in holistic health management is significantly strengthening industry demand.

  • CoQ10’s health benefits, including energy production and anti-aging, are propelling its industry growth.
  • The growing focus on heart health and energy management is driving CoQ10 adoption in dietary supplements.
  • Rising consumer interest in holistic wellness solutions is expanding CoQ10’s industry presence.

Regulatory Challenges and Raw Material Sourcing Pose Challenges

Despite strong demand, the CoQ10 industry faces significant hurdles due to regulatory compliance and raw material sourcing issues. Stringent regulations, particularly in the pharmaceutical and food industries, complicate product approvals in several key industries. Additionally, the extraction of CoQ10 from natural sources remains costly, affecting both production timelines and cost-efficiency.

To address these obstacles, companies are focusing on enhancing production efficiency, exploring synthetic alternatives, and ensuring compliance with global standards to mitigate risks and reduce operational costs, thereby maintaining steady industry growth.
  • Strict regulatory requirements complicate the approval process for CoQ10 in key industries.
  • High costs associated with sourcing natural CoQ10 materials impact overall production efficiency.
  • Companies are adopting more efficient production methods and exploring synthetic alternatives to overcome challenges.

Analyzing Top Countries Manufacturing, Distributing, and Supplying Coenzyme Q10

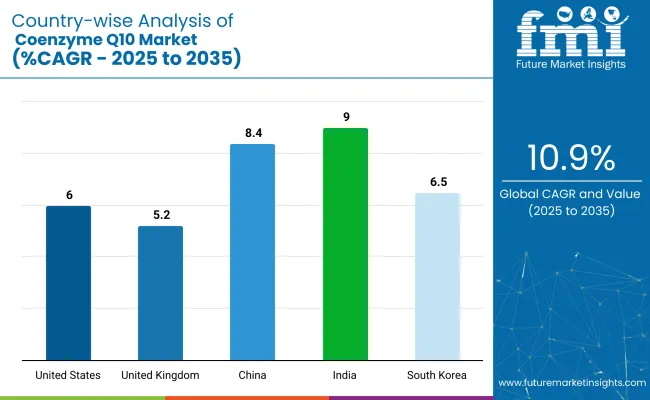
Country Wise Analysis Of Coenzyme Q10 Market Cagr 2025 To 2035

Countries CAGR (2025 to 2035)
United States 6%
United Kingdom 5.2%
China 8.4%
India 9%
South Korea 6.5%

The global Coenzyme Q10 Market is projected to grow at a CAGR of 10.9% from 2025 to 2035. The United States, with a CAGR of 6%, shows steady growth, supported by strong demand for CoQ10 in dietary supplements and its growing application in the pharmaceutical and cosmetic industries. The United Kingdom, at 5.2%, demonstrates more modest growth, driven by the increasing popularity of natural health supplements and awareness of CoQ10’s benefits for energy production and anti-aging.

China, with a CAGR of 8.4%, reflects stronger growth as the demand for health supplements rises among the growing middle class and with an increasing focus on wellness and aging. India, at 9%, shows significant growth, driven by expanding health-conscious consumer segments and increasing adoption of CoQ10 for wellness and longevity.

South Korea, at 6.5%, sees steady growth due to the rising demand for CoQ10 in functional foods and cosmetics. While OECD countries experience moderate growth, India and China stand out with their faster-paced growth, marking them as key players in shaping the future of the global industry.

The report covers in-depth analysis of 40+ countries; five top-performing OECD and BRICS countries are highlighted below.

Growth Analysis of Coenzyme Q10 Market in the United States

The CoQ10 industry in the United States is expected to grow at a steady CAGR of 6% from 2025 to 2035. This growth is fueled by a health-conscious population, an aging demographic, and a high prevalence of cardiovascular and neurodegenerative diseases.

Advanced distribution networks, regulatory clarity, and ongoing product innovation-such as clean-label and combination supplements-are further strengthening industry growth. Manufacturers are also focusing on transparency and clinically backed formulations to meet consumer expectations.

  • Aging population and chronic disease prevalence drive steady demand for CoQ10.
  • Clean-label, innovative, and combination products are increasingly popular.
  • Broad retail and e-commerce access ensures widespread product availability.

Future Outlook for Coenzyme Q10 Market in the United Kingdom

With a projected CAGR of 5.2% through 2035, the market in United Kingdom is supported by growing health awareness and a national focus on preventive wellness. NHS and private practitioners are increasingly recommending CoQ10 for heart health and statin side effects. The industry is also witnessing a surge in demand for vegan and allergen-free CoQ10, while e-commerce and pharmacy chains have made supplements more accessible to consumers nationwide.

  • Preventive wellness and NHS recommendations boost CoQ10 adoption.
  • Demand is rising for vegan and allergen-free supplement options.
  • E-commerce and pharmacy chains enhance industry reach and accessibility.

Analysis of Coenzyme Q10 Market in India

Growing at a CAGR of 9% from 2025 to 2035, the Coenzyme Q10 industry in India is set to be the fastest expanding globally. This growth is driven by increasing awareness of lifestyle diseases, a rapidly expanding middle class, and rising healthcare expenditure. CoQ10 is gaining popularity in cardiac care, diabetes management, and fertility treatments.

Affordable, locally produced supplements and the surge in e-commerce are making CoQ10 accessible to a broader population, while domestic pharmaceutical companies are introducing cost-effective formulations to cater to price-sensitive consumers.

  • Rising awareness of lifestyle diseases and healthcare spending fuels demand.
  • Affordable, locally manufactured supplements expand industry reach.
  • E-commerce growth is rapidly increasing product accessibility nationwide.

Demand Forecast for Coenzyme Q10 Market in China

The industry in China is projected to grow at a robust CAGR of 8.4% between 2025 and 2035, making it one of the fastest-growing industries worldwide. CoQ10 is popular for its anti-aging, energy, and cardiovascular benefits, appealing to both older adults and younger fitness enthusiasts. The country’s strong domestic production supports both local and export industries, while government initiatives promoting healthy aging further accelerate adoption.

  • Development and higher incomes are driving increased supplement consumption.
  • Strong domestic manufacturing supports both local and export demand.
  • Government health campaigns encourage CoQ10 use for healthy aging.

Coenzyme Q10 Market Growth Outlook in South Korea

The industry in South Korea is projected to grow at a CAGR of 6.5% from 2025 to 2035, driven by a sophisticated consumer base and a strong culture of preventive health. CoQ10 is widely used in cosmeceuticals and functional foods, in addition to traditional supplements. Innovative delivery forms and premium, science-backed products are in high demand, supported by dynamic promotion and a robust online retail ecosystem.

  • Preventive health culture and cosmeceutical applications drive demand.
  • Innovative formats (chewables, drinks, skincare) are highly popular.
  • Premium, science-backed brands and strong online sales fuel industry growth.

Leading Coenzyme Q10 Suppliers

The global industry features a competitive landscape with dominant players, key players, and emerging players. Dominant players such as Kaneka Corporation, DSM, and SourceOne Global Partners, LLC lead the industry with extensive product portfolios, strong R&D capabilities, and robust distribution networks across dietary supplements, pharmaceuticals, and cosmetics sectors.

Key players including Healthy Origins, Vitamin Shoppe, Inc., and Pharmavite LLC offer specialized formulations tailored to specific applications and regional markets. Emerging players, such as Xiamen Kingdomway Group, Kyowa Hakko USA Inc., and Tishcon Corporation, focus on innovative extraction technologies and cost-effective solutions, expanding their presence in the global industry.

Recent Industry News

In April 2024, Beiersdorf announced the launch of the NIVEA Q10 Dual Action Serum, following nearly a decade of research on skin glycation and its impact on aging and wrinkles. The serum combines GLYCOSTOP™, a patented active ingredient that targets sugar-induced skin aging, with Coenzyme Q10 (Q10). GLYCOSTOP™ helps prevent the formation of advanced glycation end-products (AGEs) by neutralizing sugar molecules, which can weaken collagen and accelerate aging. The formula is designed to visibly reduce wrinkles in just two weeks. The product is eco-friendly, free from silicones and mineral oils, and packaged in recycled glass for sustainability.

Report Scope of the Market

Report Attributes Details
Estimated Industry Size (2025) USD 786.95 million
Projected Industry Size (2035) USD 2,210 million
CAGR (2025 to 2035) 10.9%
Base Year for Estimation 2024
Historical Period 2020 to 2024
Projections Period 2025 to 2035
Quantitative Units USD million for value and thousand units for volume
Product Types Analyzed (Segment 1) Ubiquinone (oxidized form), Ubiquinol (reduced form)
Grade Segmentation (Segment 2) Pharmaceutical grade, Food grade, Cosmetic grade
Formulation Segmentation (Segment 3) Powder & crystalline forms, Oil suspensions & solutions, Softgel capsules, Hard capsules, Tablets & chewables, Advanced delivery systems, Liposomal & micellar formulations, Nanoparticle-based systems, Other advanced formulations, Other formulations
Application Segmentation (Segment 4) Dietary supplements, Pharmaceuticals, Cosmetics & personal care, Functional foods & beverages, Animal nutrition, Other applications
Distribution Channel Segmentation (Segment 5) Retail pharmacies & drug stores, Supermarkets & hypermarkets, Specialty health stores, Online retail, E-commerce platforms, Direct-to-consumer websites, Subscription services, Healthcare practitioners, Other distribution channels
Regions Covered North America, Latin America, Europe, Asia-Pacific, Middle East & Africa
Countries Covered United States, Canada, Mexico, Brazil, Argentina, Germany, France, United Kingdom, Italy, Spain, Netherlands, China, India, Japan, South Korea, ANZ (Australia & New Zealand), GCC Countries, South Africa
Key Players Influencing the Industry Country Life, LLC, Doctor’s Best, DSM, GNC Holdings, Inc., Healthy Origins, Jarrow Formulas, Kaneka Corporation, Natural Organics, NBTY, Inc., Nordic Naturals, Inc., NOW Foods, Pharma Nord, Inc., Pharmavite LLC, QUTEN Research Institute LLC, SourceOne Global Partners, LLC, Tishcon Corp., Vitamin Shoppe, Inc., Xiamen Kingdomway Group
Additional Attributes Dollar sales by product type, grade, and formulation, growing consumer demand for anti-aging and energy supplements, increasing incorporation of CoQ10 in functional foods and beverages, regional trends in CoQ10 supplementation for heart health, growth of e-commerce platforms in supplement distribution.

Key Players in the Market

  • Country Life, LLC
  • Doctor’s Best
  • DSM
  • GNC Holdings, Inc.
  • Healthy Origins
  • Jarrow Formulas
  • Kaneka Corporation
  • Natural Organics
  • NBTY, Inc.
  • Nordic Naturals, Inc.
  • NOW Foods
  • Pharma Nord, Inc.
  • Pharmavite LLC
  • QUTEN Research Institute LLC
  • SourceOne Global Partners, LLC
  • Tishcon Corp.
  • Vitamin Shoppe, Inc.
  • Xiamen Kingdomway Group

Key Segments Studied in the Market

By Product Type:

The industry is segmented into ubiquinone (oxidized form) and ubiquinol (reduced form).

By Grade:

The industry is segmented into pharmaceutical grade, food grade, and cosmetic grade.

By Formulation:

The industry is segmented into powder & crystalline forms, oil suspensions & solutions, softgel capsules, hard capsules, tablets & chewables, advanced delivery systems, liposomal & micellar formulations, nanoparticle-based systems, and other advanced formulations.

By Application:

The industry is segmented into dietary supplements, pharmaceuticals, cosmetics & personal care, functional foods & beverages, animal nutrition, and other applications.

By Distribution Channel:

The industry is segmented into retail pharmacies & drug stores, supermarkets & hypermarkets, specialty health stores, online retail, e-commerce platforms, direct-to-consumer websites, subscription services, healthcare practitioners, and other distribution channels.

By Region:

The industry is segmented into North America, Latin America, Europe, Asia-Pacific, and Middle East & Africa.

Table of Content

  1. Executive Summary
    • Global Market Outlook
    • Demand-side Trends
    • Supply-side Trends
    • Technology Roadmap Analysis
    • Analysis and Recommendations
  2. Market Overview
    • Market Coverage / Taxonomy
    • Market Definition / Scope / Limitations
  3. Market Background
    • Market Dynamics
      • Drivers
      • Restraints
      • Opportunity
      • Trends
    • Scenario Forecast
      • Demand in Optimistic Scenario
      • Demand in Likely Scenario
      • Demand in Conservative Scenario
    • Opportunity Map Analysis
    • Product Life Cycle Analysis
    • Supply Chain Analysis
      • Supply Side Participants and their Roles
        • Producers
        • Mid-Level Participants (Traders/ Agents/ Brokers)
        • Wholesalers and Distributors
      • Value Added and Value Created at Node in the Supply Chain
      • List of Raw Material Suppliers
      • List of Existing and Potential Buyer’s
    • Investment Feasibility Matrix
    • Value Chain Analysis
      • Profit Margin Analysis
      • Wholesalers and Distributors
      • Retailers
    • PESTLE and Porter’s Analysis
    • Regulatory Landscape
      • By Key Regions
      • By Key Countries
    • Regional Parent Market Outlook
    • Production and Consumption Statistics
    • Import and Export Statistics
  4. Global Market Analysis 2020 to 2024 and Forecast, 2025 to 2035
    • Historical Market Size Value (USD Million) & Volume (Thousand Units) Analysis, 2020 to 2024
    • Current and Future Market Size Value (USD Million) & Volume (Thousand Units) Projections, 2025 to 2035
      • Y-o-Y Growth Trend Analysis
      • Absolute $ Opportunity Analysis
  5. Global Market Pricing Analysis 2020 to 2024 and Forecast 2025 to 2035
  6. Global Market Analysis 2020 to 2024 and Forecast 2025 to 2035, By Product Type
    • Introduction / Key Findings
    • Historical Market Size Value (USD Million) & Volume (Thousand Units) Analysis By Product Type, 2020 to 2024
    • Current and Future Market Size Value (USD Million) & Volume (Thousand Units) Analysis and Forecast By Product Type, 2025 to 2035
      • Ubiquinone
      • Ubiquinol
    • Y-o-Y Growth Trend Analysis By Product Type, 2020 to 2024
    • Absolute $ Opportunity Analysis By Product Type, 2025 to 2035
  7. Global Market Analysis 2020 to 2024 and Forecast 2025 to 2035, By Grade
    • Introduction / Key Findings
    • Historical Market Size Value (USD Million) & Volume (Thousand Units) Analysis By Grade, 2020 to 2024
    • Current and Future Market Size Value (USD Million) & Volume (Thousand Units) Analysis and Forecast By Grade, 2025 to 2035
      • Pharmaceutical Grade
      • Food Grade
      • Cosmetic Grade
    • Y-o-Y Growth Trend Analysis By Grade, 2020 to 2024
    • Absolute $ Opportunity Analysis By Grade, 2025 to 2035
  8. Global Market Analysis 2020 to 2024 and Forecast 2025 to 2035, By Formulation
    • Introduction / Key Findings
    • Historical Market Size Value (USD Million) & Volume (Thousand Units) Analysis By Formulation, 2020 to 2024
    • Current and Future Market Size Value (USD Million) & Volume (Thousand Units) Analysis and Forecast By Formulation, 2025 to 2035
      • Powder & Crystalline Forms
      • Oil Suspensions & Solutions
      • Softgel Capsules
      • Hard Capsules
      • Tablets & Chewables
      • Advanced Delivery Systems
      • Liposomal & Micellar Formulations
      • Nanoparticle-based Systems
      • Other Advanced Formulations
      • Other Formulations
    • Y-o-Y Growth Trend Analysis By Formulation, 2020 to 2024
    • Absolute $ Opportunity Analysis By Formulation, 2025 to 2035
  9. Global Market Analysis 2020 to 2024 and Forecast 2025 to 2035, By Application
    • Introduction / Key Findings
    • Historical Market Size Value (USD Million) & Volume (Thousand Units) Analysis By Application, 2020 to 2024
    • Current and Future Market Size Value (USD Million) & Volume (Thousand Units) Analysis and Forecast By Application, 2025 to 2035
      • Dietary Supplements
      • Pharmaceuticals
      • Cosmetics & Personal Care
      • Functional Foods & Beverages
      • Animal Nutrition
      • Other Applications
    • Y-o-Y Growth Trend Analysis By Application, 2020 to 2024
    • Absolute $ Opportunity Analysis By Application, 2025 to 2035
  10. Global Market Analysis 2020 to 2024 and Forecast 2025 to 2035, By Distribution Channel
    • Introduction / Key Findings
    • Historical Market Size Value (USD Million) & Volume (Thousand Units) Analysis By Distribution Channel, 2020 to 2024
    • Current and Future Market Size Value (USD Million) & Volume (Thousand Units) Analysis and Forecast By Distribution Channel, 2025 to 2035
      • Retail Pharmacies & Drug Stores
      • Supermarkets & Hypermarkets
      • Specialty health stores
      • Online Retail
      • E-commerce Platforms
      • Direct-to-consumer Websites
      • Subscription Services
      • Healthcare Practitioners
      • Other Distribution Channels
    • Y-o-Y Growth Trend Analysis By Distribution Channel, 2020 to 2024
    • Absolute $ Opportunity Analysis By Distribution Channel, 2025 to 2035
  11. Global Market Analysis 2020 to 2024 and Forecast 2025 to 2035, By Region
    • Introduction
    • Historical Market Size Value (USD Million) & Volume (Thousand Units) Analysis By Region, 2020 to 2024
    • Current Market Size Value (USD Million) & Volume (Thousand Units) Analysis and Forecast By Region, 2025 to 2035
      • North America
      • Latin America
      • Western Europe
      • Eastern Europe
      • East Asia
      • South Asia & Pacific
      • Middle East and Africa
    • Market Attractiveness Analysis By Region
  12. North America Market Analysis 2020 to 2024 and Forecast 2025 to 2035, By Country
    • Historical Market Size Value (USD Million) & Volume (Thousand Units) Trend Analysis By Market Taxonomy, 2020 to 2024
    • Market Size Value (USD Million) & Volume (Thousand Units) Forecast By Market Taxonomy, 2025 to 2035
      • By Country
        • USA
        • Canada
        • Mexico
      • By Product Type
      • By Grade
      • By Formulation
      • By Application
      • By Distribution Channel
    • Market Attractiveness Analysis
      • By Country
      • By Product Type
      • By Grade
      • By Formulation
      • By Application
      • By Distribution Channel
    • Key Takeaways
  13. Latin America Market Analysis 2020 to 2024 and Forecast 2025 to 2035, By Country
    • Historical Market Size Value (USD Million) & Volume (Thousand Units) Trend Analysis By Market Taxonomy, 2020 to 2024
    • Market Size Value (USD Million) & Volume (Thousand Units) Forecast By Market Taxonomy, 2025 to 2035
      • By Country
        • Brazil
        • Argentina
        • Rest of LATAM
      • By Product Type
      • By Grade
      • By Formulation
      • By Application
      • By Distribution Channel
    • Market Attractiveness Analysis
      • By Country
      • By Product Type
      • By Grade
      • By Formulation
      • By Application
      • By Distribution Channel
    • Key Takeaways
  14. Western Europe Market Analysis 2020 to 2024 and Forecast 2025 to 2035, By Country
    • Historical Market Size Value (USD Million) & Volume (Thousand Units) Trend Analysis By Market Taxonomy, 2020 to 2024
    • Market Size Value (USD Million) & Volume (Thousand Units) Forecast By Market Taxonomy, 2025 to 2035
      • By Country
        • Germany
        • Italy
        • France
        • UK
        • Spain
        • BENELUX
        • Nordic
        • Rest of W.Europe
      • By Product Type
      • By Grade
      • By Formulation
      • By Application
      • By Distribution Channel
    • Market Attractiveness Analysis
      • By Country
      • By Product Type
      • By Grade
      • By Formulation
      • By Application
      • By Distribution Channel
    • Key Takeaways
  15. Eastern Europe Market Analysis 2020 to 2024 and Forecast 2025 to 2035, By Country
    • Historical Market Size Value (USD Million) & Volume (Thousand Units) Trend Analysis By Market Taxonomy, 2020 to 2024
    • Market Size Value (USD Million) & Volume (Thousand Units) Forecast By Market Taxonomy, 2025 to 2035
      • By Country
        • Russia
        • Hungary
        • Poland
        • Balkan & Baltics
        • Rest of E. Europe
      • By Product Type
      • By Grade
      • By Formulation
      • By Application
      • By Distribution Channel
    • Market Attractiveness Analysis
      • By Country
      • By Product Type
      • By Grade
      • By Formulation
      • By Application
      • By Distribution Channel
    • Key Takeaways
  16. East Asia Market Analysis 2020 to 2024 and Forecast 2025 to 2035, By Country
    • Historical Market Size Value (USD Million) & Volume (Thousand Units) Trend Analysis By Market Taxonomy, 2020 to 2024
    • Market Size Value (USD Million) & Volume (Thousand Units) Forecast By Market Taxonomy, 2025 to 2035
      • By Country
        • China
        • Japan
        • South Korea
      • By Product Type
      • By Grade
      • By Formulation
      • By Application
      • By Distribution Channel
    • Market Attractiveness Analysis
      • By Country
      • By Product Type
      • By Grade
      • By Formulation
      • By Application
      • By Distribution Channel
    • Key Takeaways
  17. South Asia & Pacific Market Analysis 2020 to 2024 and Forecast 2025 to 2035, By Country
    • Historical Market Size Value (USD Million) & Volume (Thousand Units) Trend Analysis By Market Taxonomy, 2020 to 2024
    • Market Size Value (USD Million) & Volume (Thousand Units) Forecast By Market Taxonomy, 2025 to 2035
      • By Country
        • India
        • Australia & New Zealand
        • ASEAN
        • Rest of SAP
      • By Product Type
      • By Grade
      • By Formulation
      • By Application
      • By Distribution Channel
    • Market Attractiveness Analysis
      • By Country
      • By Product Type
      • By Grade
      • By Formulation
      • By Application
      • By Distribution Channel
    • Key Takeaways
  18. Middle East and Africa Market Analysis 2020 to 2024 and Forecast 2025 to 2035, By Country
    • Historical Market Size Value (USD Million) & Volume (Thousand Units) Trend Analysis By Market Taxonomy, 2020 to 2024
    • Market Size Value (USD Million) & Volume (Thousand Units) Forecast By Market Taxonomy, 2025 to 2035
      • By Country
        • GCC Countries
        • Northern Africa
        • South Africa
        • Turkiye
        • Rest of MEA
      • By Product Type
      • By Grade
      • By Formulation
      • By Application
      • By Distribution Channel
    • Market Attractiveness Analysis
      • By Country
      • By Product Type
      • By Grade
      • By Formulation
      • By Application
      • By Distribution Channel
    • Key Takeaways
  19. Key Countries Market Analysis
    • USA
      • Pricing Analysis
      • Market Share Analysis, 2024
        • By Product Type
        • By Grade
        • By Formulation
        • By Application
        • By Distribution Channel
    • Canada
      • Pricing Analysis
      • Market Share Analysis, 2024
        • By Product Type
        • By Grade
        • By Formulation
        • By Application
        • By Distribution Channel
    • Brazil
      • Pricing Analysis
      • Market Share Analysis, 2024
        • By Product Type
        • By Grade
        • By Formulation
        • By Application
        • By Distribution Channel
    • Mexico
      • Pricing Analysis
      • Market Share Analysis, 2024
        • By Product Type
        • By Grade
        • By Formulation
        • By Application
        • By Distribution Channel
    • Argentina
      • Pricing Analysis
      • Market Share Analysis, 2024
        • By Product Type
        • By Grade
        • By Formulation
        • By Application
        • By Distribution Channel
  20. Market Structure Analysis
    • Competition Dashboard
    • Competition Benchmarking
    • Market Share Analysis of Top Players
      • By Regional
      • By Product Type
      • By Grade
      • By Formulation
      • By Application
      • By Distribution Channel
  21. Competition Analysis
    • Competition Deep Dive
      • Country Life, LLC
        • Overview
        • Product Portfolio
        • Profitability by Market Segments (Product/Age /Sales Channel/Region)
        • Sales Footprint
        • Strategy Overview
          • Marketing Strategy
          • Product Strategy
          • Channel Strategy
      • Doctor’s Best
        • Overview
        • Product Portfolio
        • Profitability by Market Segments (Product/Age /Sales Channel/Region)
        • Sales Footprint
        • Strategy Overview
          • Marketing Strategy
          • Product Strategy
          • Channel Strategy
      • DSM
        • Overview
        • Product Portfolio
        • Profitability by Market Segments (Product/Age /Sales Channel/Region)
        • Sales Footprint
        • Strategy Overview
          • Marketing Strategy
          • Product Strategy
          • Channel Strategy
      • GNC Holdings, Inc.
        • Overview
        • Product Portfolio
        • Profitability by Market Segments (Product/Age /Sales Channel/Region)
        • Sales Footprint
        • Strategy Overview
          • Marketing Strategy
          • Product Strategy
          • Channel Strategy
      • Healthy Origins
        • Overview
        • Product Portfolio
        • Profitability by Market Segments (Product/Age /Sales Channel/Region)
        • Sales Footprint
        • Strategy Overview
          • Marketing Strategy
          • Product Strategy
          • Channel Strategy
      • Jarrow Formulas
        • Overview
        • Product Portfolio
        • Profitability by Market Segments (Product/Age /Sales Channel/Region)
        • Sales Footprint
        • Strategy Overview
          • Marketing Strategy
          • Product Strategy
          • Channel Strategy
      • Kaneka Corporation
        • Overview
        • Product Portfolio
        • Profitability by Market Segments (Product/Age /Sales Channel/Region)
        • Sales Footprint
        • Strategy Overview
          • Marketing Strategy
          • Product Strategy
          • Channel Strategy
      • Natural Organics
        • Overview
        • Product Portfolio
        • Profitability by Market Segments (Product/Age /Sales Channel/Region)
        • Sales Footprint
        • Strategy Overview
          • Marketing Strategy
          • Product Strategy
          • Channel Strategy
      • NBTY, Inc.
        • Overview
        • Product Portfolio
        • Profitability by Market Segments (Product/Age /Sales Channel/Region)
        • Sales Footprint
        • Strategy Overview
          • Marketing Strategy
          • Product Strategy
          • Channel Strategy
      • Nordic Naturals, Inc.
        • Overview
        • Product Portfolio
        • Profitability by Market Segments (Product/Age /Sales Channel/Region)
        • Sales Footprint
        • Strategy Overview
          • Marketing Strategy
          • Product Strategy
          • Channel Strategy
      • NOW Foods
        • Overview
        • Product Portfolio
        • Profitability by Market Segments (Product/Age /Sales Channel/Region)
        • Sales Footprint
        • Strategy Overview
          • Marketing Strategy
          • Product Strategy
          • Channel Strategy
      • Pharma Nord, Inc.
        • Overview
        • Product Portfolio
        • Profitability by Market Segments (Product/Age /Sales Channel/Region)
        • Sales Footprint
        • Strategy Overview
          • Marketing Strategy
          • Product Strategy
          • Channel Strategy
      • Pharmavite LLC
        • Overview
        • Product Portfolio
        • Profitability by Market Segments (Product/Age /Sales Channel/Region)
        • Sales Footprint
        • Strategy Overview
          • Marketing Strategy
          • Product Strategy
          • Channel Strategy
      • QUTEN Research Institute LLC
        • Overview
        • Product Portfolio
        • Profitability by Market Segments (Product/Age /Sales Channel/Region)
        • Sales Footprint
        • Strategy Overview
          • Marketing Strategy
          • Product Strategy
          • Channel Strategy
      • SourceOne Global Partners, LLC
        • Overview
        • Product Portfolio
        • Profitability by Market Segments (Product/Age /Sales Channel/Region)
        • Sales Footprint
        • Strategy Overview
          • Marketing Strategy
          • Product Strategy
          • Channel Strategy
      • Tishcon Corp.
        • Overview
        • Product Portfolio
        • Profitability by Market Segments (Product/Age /Sales Channel/Region)
        • Sales Footprint
        • Strategy Overview
          • Marketing Strategy
          • Product Strategy
          • Channel Strategy
      • Vitamin Shoppe, Inc.
        • Overview
        • Product Portfolio
        • Profitability by Market Segments (Product/Age /Sales Channel/Region)
        • Sales Footprint
        • Strategy Overview
          • Marketing Strategy
          • Product Strategy
          • Channel Strategy
      • Xiamen Kingdomway Group
        • Overview
        • Product Portfolio
        • Profitability by Market Segments (Product/Age /Sales Channel/Region)
        • Sales Footprint
        • Strategy Overview
          • Marketing Strategy
          • Product Strategy
          • Channel Strategy
  22. Assumptions & Acronyms Used
  23. Research Methodology

List of Tables

  • Table 1: Global Market Value (USD Million) Forecast by Region, 2020 to 2035
  • Table 2: Global Market Volume (Thousand Units) Forecast by Region, 2020 to 2035
  • Table 3: Global Market Value (USD Million) Forecast by Product Type, 2020 to 2035
  • Table 4: Global Market Volume (Thousand Units) Forecast by Product Type, 2020 to 2035
  • Table 5: Global Market Value (USD Million) Forecast by Grade, 2020 to 2035
  • Table 6: Global Market Volume (Thousand Units) Forecast by Grade, 2020 to 2035
  • Table 7: Global Market Value (USD Million) Forecast by Formulation, 2020 to 2035
  • Table 8: Global Market Volume (Thousand Units) Forecast by Formulation, 2020 to 2035
  • Table 9: Global Market Value (USD Million) Forecast by Application, 2020 to 2035
  • Table 10: Global Market Volume (Thousand Units) Forecast by Application, 2020 to 2035
  • Table 11: Global Market Value (USD Million) Forecast by Distribution Channel, 2020 to 2035
  • Table 12: Global Market Volume (Thousand Units) Forecast by Distribution Channel, 2020 to 2035
  • Table 13: North America Market Value (USD Million) Forecast by Country, 2020 to 2035
  • Table 14: North America Market Volume (Thousand Units) Forecast by Country, 2020 to 2035
  • Table 15: North America Market Value (USD Million) Forecast by Product Type, 2020 to 2035
  • Table 16: North America Market Volume (Thousand Units) Forecast by Product Type, 2020 to 2035
  • Table 17: North America Market Value (USD Million) Forecast by Grade, 2020 to 2035
  • Table 18: North America Market Volume (Thousand Units) Forecast by Grade, 2020 to 2035
  • Table 19: North America Market Value (USD Million) Forecast by Formulation, 2020 to 2035
  • Table 20: North America Market Volume (Thousand Units) Forecast by Formulation, 2020 to 2035
  • Table 21: North America Market Value (USD Million) Forecast by Application, 2020 to 2035
  • Table 22: North America Market Volume (Thousand Units) Forecast by Application, 2020 to 2035
  • Table 23: North America Market Value (USD Million) Forecast by Distribution Channel, 2020 to 2035
  • Table 24: North America Market Volume (Thousand Units) Forecast by Distribution Channel, 2020 to 2035
  • Table 25: Latin America Market Value (USD Million) Forecast by Country, 2020 to 2035
  • Table 26: Latin America Market Volume (Thousand Units) Forecast by Country, 2020 to 2035
  • Table 27: Latin America Market Value (USD Million) Forecast by Product Type, 2020 to 2035
  • Table 28: Latin America Market Volume (Thousand Units) Forecast by Product Type, 2020 to 2035
  • Table 29: Latin America Market Value (USD Million) Forecast by Grade, 2020 to 2035
  • Table 30: Latin America Market Volume (Thousand Units) Forecast by Grade, 2020 to 2035
  • Table 31: Latin America Market Value (USD Million) Forecast by Formulation, 2020 to 2035
  • Table 32: Latin America Market Volume (Thousand Units) Forecast by Formulation, 2020 to 2035
  • Table 33: Latin America Market Value (USD Million) Forecast by Application, 2020 to 2035
  • Table 34: Latin America Market Volume (Thousand Units) Forecast by Application, 2020 to 2035
  • Table 35: Latin America Market Value (USD Million) Forecast by Distribution Channel, 2020 to 2035
  • Table 36: Latin America Market Volume (Thousand Units) Forecast by Distribution Channel, 2020 to 2035
  • Table 37: Western Europe Market Value (USD Million) Forecast by Country, 2020 to 2035
  • Table 38: Western Europe Market Volume (Thousand Units) Forecast by Country, 2020 to 2035
  • Table 39: Western Europe Market Value (USD Million) Forecast by Product Type, 2020 to 2035
  • Table 40: Western Europe Market Volume (Thousand Units) Forecast by Product Type, 2020 to 2035
  • Table 41: Western Europe Market Value (USD Million) Forecast by Grade, 2020 to 2035
  • Table 42: Western Europe Market Volume (Thousand Units) Forecast by Grade, 2020 to 2035
  • Table 43: Western Europe Market Value (USD Million) Forecast by Formulation, 2020 to 2035
  • Table 44: Western Europe Market Volume (Thousand Units) Forecast by Formulation, 2020 to 2035
  • Table 45: Western Europe Market Value (USD Million) Forecast by Application, 2020 to 2035
  • Table 46: Western Europe Market Volume (Thousand Units) Forecast by Application, 2020 to 2035
  • Table 47: Western Europe Market Value (USD Million) Forecast by Distribution Channel, 2020 to 2035
  • Table 48: Western Europe Market Volume (Thousand Units) Forecast by Distribution Channel, 2020 to 2035
  • Table 49: Eastern Europe Market Value (USD Million) Forecast by Country, 2020 to 2035
  • Table 50: Eastern Europe Market Volume (Thousand Units) Forecast by Country, 2020 to 2035
  • Table 51: Eastern Europe Market Value (USD Million) Forecast by Product Type, 2020 to 2035
  • Table 52: Eastern Europe Market Volume (Thousand Units) Forecast by Product Type, 2020 to 2035
  • Table 53: Eastern Europe Market Value (USD Million) Forecast by Grade, 2020 to 2035
  • Table 54: Eastern Europe Market Volume (Thousand Units) Forecast by Grade, 2020 to 2035
  • Table 55: Eastern Europe Market Value (USD Million) Forecast by Formulation, 2020 to 2035
  • Table 56: Eastern Europe Market Volume (Thousand Units) Forecast by Formulation, 2020 to 2035
  • Table 57: Eastern Europe Market Value (USD Million) Forecast by Application, 2020 to 2035
  • Table 58: Eastern Europe Market Volume (Thousand Units) Forecast by Application, 2020 to 2035
  • Table 59: Eastern Europe Market Value (USD Million) Forecast by Distribution Channel, 2020 to 2035
  • Table 60: Eastern Europe Market Volume (Thousand Units) Forecast by Distribution Channel, 2020 to 2035
  • Table 61: East Asia Market Value (USD Million) Forecast by Country, 2020 to 2035
  • Table 62: East Asia Market Volume (Thousand Units) Forecast by Country, 2020 to 2035
  • Table 63: East Asia Market Value (USD Million) Forecast by Product Type, 2020 to 2035
  • Table 64: East Asia Market Volume (Thousand Units) Forecast by Product Type, 2020 to 2035
  • Table 65: East Asia Market Value (USD Million) Forecast by Grade, 2020 to 2035
  • Table 66: East Asia Market Volume (Thousand Units) Forecast by Grade, 2020 to 2035
  • Table 67: East Asia Market Value (USD Million) Forecast by Formulation, 2020 to 2035
  • Table 68: East Asia Market Volume (Thousand Units) Forecast by Formulation, 2020 to 2035
  • Table 69: East Asia Market Value (USD Million) Forecast by Application, 2020 to 2035
  • Table 70: East Asia Market Volume (Thousand Units) Forecast by Application, 2020 to 2035
  • Table 71: East Asia Market Value (USD Million) Forecast by Distribution Channel, 2020 to 2035
  • Table 72: East Asia Market Volume (Thousand Units) Forecast by Distribution Channel, 2020 to 2035
  • Table 73: South Asia & Pacific Market Value (USD Million) Forecast by Country, 2020 to 2035
  • Table 74: South Asia & Pacific Market Volume (Thousand Units) Forecast by Country, 2020 to 2035
  • Table 75: South Asia & Pacific Market Value (USD Million) Forecast by Product Type, 2020 to 2035
  • Table 76: South Asia & Pacific Market Volume (Thousand Units) Forecast by Product Type, 2020 to 2035
  • Table 77: South Asia & Pacific Market Value (USD Million) Forecast by Grade, 2020 to 2035
  • Table 78: South Asia & Pacific Market Volume (Thousand Units) Forecast by Grade, 2020 to 2035
  • Table 79: South Asia & Pacific Market Value (USD Million) Forecast by Formulation, 2020 to 2035
  • Table 80: South Asia & Pacific Market Volume (Thousand Units) Forecast by Formulation, 2020 to 2035
  • Table 81: South Asia & Pacific Market Value (USD Million) Forecast by Application, 2020 to 2035
  • Table 82: South Asia & Pacific Market Volume (Thousand Units) Forecast by Application, 2020 to 2035
  • Table 83: South Asia & Pacific Market Value (USD Million) Forecast by Distribution Channel, 2020 to 2035
  • Table 84: South Asia & Pacific Market Volume (Thousand Units) Forecast by Distribution Channel, 2020 to 2035
  • Table 85: Middle East and Africa Market Value (USD Million) Forecast by Country, 2020 to 2035
  • Table 86: Middle East and Africa Market Volume (Thousand Units) Forecast by Country, 2020 to 2035
  • Table 87: Middle East and Africa Market Value (USD Million) Forecast by Product Type, 2020 to 2035
  • Table 88: Middle East and Africa Market Volume (Thousand Units) Forecast by Product Type, 2020 to 2035
  • Table 89: Middle East and Africa Market Value (USD Million) Forecast by Grade, 2020 to 2035
  • Table 90: Middle East and Africa Market Volume (Thousand Units) Forecast by Grade, 2020 to 2035
  • Table 91: Middle East and Africa Market Value (USD Million) Forecast by Formulation, 2020 to 2035
  • Table 92: Middle East and Africa Market Volume (Thousand Units) Forecast by Formulation, 2020 to 2035
  • Table 93: Middle East and Africa Market Value (USD Million) Forecast by Application, 2020 to 2035
  • Table 94: Middle East and Africa Market Volume (Thousand Units) Forecast by Application, 2020 to 2035
  • Table 95: Middle East and Africa Market Value (USD Million) Forecast by Distribution Channel, 2020 to 2035
  • Table 96: Middle East and Africa Market Volume (Thousand Units) Forecast by Distribution Channel, 2020 to 2035

List of Figures

  • Figure 1: Global Market Volume (Thousand Units) Forecast 2020 to 2035
  • Figure 2: Global Market Pricing Analysis
  • Figure 3: Global Market Value (USD Million) Forecast 2020 to 2035
  • Figure 4: Global Market Value Share and BPS Analysis by Product Type, 2025 and 2035
  • Figure 5: Global Market Y-o-Y Growth Comparison by Product Type, 2025 to 2035
  • Figure 6: Global Market Attractiveness Analysis by Product Type
  • Figure 7: Global Market Value Share and BPS Analysis by Grade, 2025 and 2035
  • Figure 8: Global Market Y-o-Y Growth Comparison by Grade, 2025 to 2035
  • Figure 9: Global Market Attractiveness Analysis by Grade
  • Figure 10: Global Market Value Share and BPS Analysis by Formulation, 2025 and 2035
  • Figure 11: Global Market Y-o-Y Growth Comparison by Formulation, 2025 to 2035
  • Figure 12: Global Market Attractiveness Analysis by Formulation
  • Figure 13: Global Market Value Share and BPS Analysis by Application, 2025 and 2035
  • Figure 14: Global Market Y-o-Y Growth Comparison by Application, 2025 to 2035
  • Figure 15: Global Market Attractiveness Analysis by Application
  • Figure 16: Global Market Value Share and BPS Analysis by Distribution Channel, 2025 and 2035
  • Figure 17: Global Market Y-o-Y Growth Comparison by Distribution Channel, 2025 to 2035
  • Figure 18: Global Market Attractiveness Analysis by Distribution Channel
  • Figure 19: Global Market Value (USD Million) Share and BPS Analysis by Region, 2025 and 2035
  • Figure 20: Global Market Y-o-Y Growth Comparison by Region, 2025 to 2035
  • Figure 21: Global Market Attractiveness Analysis by Region
  • Figure 22: North America Market Incremental $ Opportunity, 2025 to 2035
  • Figure 23: Latin America Market Incremental $ Opportunity, 2025 to 2035
  • Figure 24: Western Europe Market Incremental $ Opportunity, 2025 to 2035
  • Figure 25: Eastern Europe Market Incremental $ Opportunity, 2025 to 2035
  • Figure 26: East Asia Market Incremental $ Opportunity, 2025 to 2035
  • Figure 27: South Asia & Pacific Market Incremental $ Opportunity, 2025 to 2035
  • Figure 28: Middle East and Africa Market Incremental $ Opportunity, 2025 to 2035
  • Figure 29: North America Market Value Share and BPS Analysis by Country, 2025 and 2035
  • Figure 30: North America Market Value Share and BPS Analysis by Product Type, 2025 and 2035
  • Figure 31: North America Market Y-o-Y Growth Comparison by Product Type, 2025 to 2035
  • Figure 32: North America Market Attractiveness Analysis by Product Type
  • Figure 33: North America Market Value Share and BPS Analysis by Grade, 2025 and 2035
  • Figure 34: North America Market Y-o-Y Growth Comparison by Grade, 2025 to 2035
  • Figure 35: North America Market Attractiveness Analysis by Grade
  • Figure 36: North America Market Value Share and BPS Analysis by Formulation, 2025 and 2035
  • Figure 37: North America Market Y-o-Y Growth Comparison by Formulation, 2025 to 2035
  • Figure 38: North America Market Attractiveness Analysis by Formulation
  • Figure 39: North America Market Value Share and BPS Analysis by Application, 2025 and 2035
  • Figure 40: North America Market Y-o-Y Growth Comparison by Application, 2025 to 2035
  • Figure 41: North America Market Attractiveness Analysis by Application
  • Figure 42: North America Market Value Share and BPS Analysis by Distribution Channel, 2025 and 2035
  • Figure 43: North America Market Y-o-Y Growth Comparison by Distribution Channel, 2025 to 2035
  • Figure 44: North America Market Attractiveness Analysis by Distribution Channel
  • Figure 45: Latin America Market Value Share and BPS Analysis by Country, 2025 and 2035
  • Figure 46: Latin America Market Value Share and BPS Analysis by Product Type, 2025 and 2035
  • Figure 47: Latin America Market Y-o-Y Growth Comparison by Product Type, 2025 to 2035
  • Figure 48: Latin America Market Attractiveness Analysis by Product Type
  • Figure 49: Latin America Market Value Share and BPS Analysis by Grade, 2025 and 2035
  • Figure 50: Latin America Market Y-o-Y Growth Comparison by Grade, 2025 to 2035
  • Figure 51: Latin America Market Attractiveness Analysis by Grade
  • Figure 52: Latin America Market Value Share and BPS Analysis by Formulation, 2025 and 2035
  • Figure 53: Latin America Market Y-o-Y Growth Comparison by Formulation, 2025 to 2035
  • Figure 54: Latin America Market Attractiveness Analysis by Formulation
  • Figure 55: Latin America Market Value Share and BPS Analysis by Application, 2025 and 2035
  • Figure 56: Latin America Market Y-o-Y Growth Comparison by Application, 2025 to 2035
  • Figure 57: Latin America Market Attractiveness Analysis by Application
  • Figure 58: Latin America Market Value Share and BPS Analysis by Distribution Channel, 2025 and 2035
  • Figure 59: Latin America Market Y-o-Y Growth Comparison by Distribution Channel, 2025 to 2035
  • Figure 60: Latin America Market Attractiveness Analysis by Distribution Channel
  • Figure 61: Western Europe Market Value Share and BPS Analysis by Country, 2025 and 2035
  • Figure 62: Western Europe Market Value Share and BPS Analysis by Product Type, 2025 and 2035
  • Figure 63: Western Europe Market Y-o-Y Growth Comparison by Product Type, 2025 to 2035
  • Figure 64: Western Europe Market Attractiveness Analysis by Product Type
  • Figure 65: Western Europe Market Value Share and BPS Analysis by Grade, 2025 and 2035
  • Figure 66: Western Europe Market Y-o-Y Growth Comparison by Grade, 2025 to 2035
  • Figure 67: Western Europe Market Attractiveness Analysis by Grade
  • Figure 68: Western Europe Market Value Share and BPS Analysis by Formulation, 2025 and 2035
  • Figure 69: Western Europe Market Y-o-Y Growth Comparison by Formulation, 2025 to 2035
  • Figure 70: Western Europe Market Attractiveness Analysis by Formulation
  • Figure 71: Western Europe Market Value Share and BPS Analysis by Application, 2025 and 2035
  • Figure 72: Western Europe Market Y-o-Y Growth Comparison by Application, 2025 to 2035
  • Figure 73: Western Europe Market Attractiveness Analysis by Application
  • Figure 74: Western Europe Market Value Share and BPS Analysis by Distribution Channel, 2025 and 2035
  • Figure 75: Western Europe Market Y-o-Y Growth Comparison by Distribution Channel, 2025 to 2035
  • Figure 76: Western Europe Market Attractiveness Analysis by Distribution Channel
  • Figure 77: Eastern Europe Market Value Share and BPS Analysis by Country, 2025 and 2035
  • Figure 78: Eastern Europe Market Value Share and BPS Analysis by Product Type, 2025 and 2035
  • Figure 79: Eastern Europe Market Y-o-Y Growth Comparison by Product Type, 2025 to 2035
  • Figure 80: Eastern Europe Market Attractiveness Analysis by Product Type
  • Figure 81: Eastern Europe Market Value Share and BPS Analysis by Grade, 2025 and 2035
  • Figure 82: Eastern Europe Market Y-o-Y Growth Comparison by Grade, 2025 to 2035
  • Figure 83: Eastern Europe Market Attractiveness Analysis by Grade
  • Figure 84: Eastern Europe Market Value Share and BPS Analysis by Formulation, 2025 and 2035
  • Figure 85: Eastern Europe Market Y-o-Y Growth Comparison by Formulation, 2025 to 2035
  • Figure 86: Eastern Europe Market Attractiveness Analysis by Formulation
  • Figure 87: Eastern Europe Market Value Share and BPS Analysis by Application, 2025 and 2035
  • Figure 88: Eastern Europe Market Y-o-Y Growth Comparison by Application, 2025 to 2035
  • Figure 89: Eastern Europe Market Attractiveness Analysis by Application
  • Figure 90: Eastern Europe Market Value Share and BPS Analysis by Distribution Channel, 2025 and 2035
  • Figure 91: Eastern Europe Market Y-o-Y Growth Comparison by Distribution Channel, 2025 to 2035
  • Figure 92: Eastern Europe Market Attractiveness Analysis by Distribution Channel
  • Figure 93: East Asia Market Value Share and BPS Analysis by Country, 2025 and 2035
  • Figure 94: East Asia Market Value Share and BPS Analysis by Product Type, 2025 and 2035
  • Figure 95: East Asia Market Y-o-Y Growth Comparison by Product Type, 2025 to 2035
  • Figure 96: East Asia Market Attractiveness Analysis by Product Type
  • Figure 97: East Asia Market Value Share and BPS Analysis by Grade, 2025 and 2035
  • Figure 98: East Asia Market Y-o-Y Growth Comparison by Grade, 2025 to 2035
  • Figure 99: East Asia Market Attractiveness Analysis by Grade
  • Figure 100: East Asia Market Value Share and BPS Analysis by Formulation, 2025 and 2035
  • Figure 101: East Asia Market Y-o-Y Growth Comparison by Formulation, 2025 to 2035
  • Figure 102: East Asia Market Attractiveness Analysis by Formulation
  • Figure 103: East Asia Market Value Share and BPS Analysis by Application, 2025 and 2035
  • Figure 104: East Asia Market Y-o-Y Growth Comparison by Application, 2025 to 2035
  • Figure 105: East Asia Market Attractiveness Analysis by Application
  • Figure 106: East Asia Market Value Share and BPS Analysis by Distribution Channel, 2025 and 2035
  • Figure 107: East Asia Market Y-o-Y Growth Comparison by Distribution Channel, 2025 to 2035
  • Figure 108: East Asia Market Attractiveness Analysis by Distribution Channel
  • Figure 109: South Asia & Pacific Market Value Share and BPS Analysis by Country, 2025 and 2035
  • Figure 110: South Asia & Pacific Market Value Share and BPS Analysis by Product Type, 2025 and 2035
  • Figure 111: South Asia & Pacific Market Y-o-Y Growth Comparison by Product Type, 2025 to 2035
  • Figure 112: South Asia & Pacific Market Attractiveness Analysis by Product Type
  • Figure 113: South Asia & Pacific Market Value Share and BPS Analysis by Grade, 2025 and 2035
  • Figure 114: South Asia & Pacific Market Y-o-Y Growth Comparison by Grade, 2025 to 2035
  • Figure 115: South Asia & Pacific Market Attractiveness Analysis by Grade
  • Figure 116: South Asia & Pacific Market Value Share and BPS Analysis by Formulation, 2025 and 2035
  • Figure 117: South Asia & Pacific Market Y-o-Y Growth Comparison by Formulation, 2025 to 2035
  • Figure 118: South Asia & Pacific Market Attractiveness Analysis by Formulation
  • Figure 119: South Asia & Pacific Market Value Share and BPS Analysis by Application, 2025 and 2035
  • Figure 120: South Asia & Pacific Market Y-o-Y Growth Comparison by Application, 2025 to 2035
  • Figure 121: South Asia & Pacific Market Attractiveness Analysis by Application
  • Figure 122: South Asia & Pacific Market Value Share and BPS Analysis by Distribution Channel, 2025 and 2035
  • Figure 123: South Asia & Pacific Market Y-o-Y Growth Comparison by Distribution Channel, 2025 to 2035
  • Figure 124: South Asia & Pacific Market Attractiveness Analysis by Distribution Channel
  • Figure 125: Middle East and Africa Market Value Share and BPS Analysis by Country, 2025 and 2035
  • Figure 126: Middle East and Africa Market Value Share and BPS Analysis by Product Type, 2025 and 2035
  • Figure 127: Middle East and Africa Market Y-o-Y Growth Comparison by Product Type, 2025 to 2035
  • Figure 128: Middle East and Africa Market Attractiveness Analysis by Product Type
  • Figure 129: Middle East and Africa Market Value Share and BPS Analysis by Grade, 2025 and 2035
  • Figure 130: Middle East and Africa Market Y-o-Y Growth Comparison by Grade, 2025 to 2035
  • Figure 131: Middle East and Africa Market Attractiveness Analysis by Grade
  • Figure 132: Middle East and Africa Market Value Share and BPS Analysis by Formulation, 2025 and 2035
  • Figure 133: Middle East and Africa Market Y-o-Y Growth Comparison by Formulation, 2025 to 2035
  • Figure 134: Middle East and Africa Market Attractiveness Analysis by Formulation
  • Figure 135: Middle East and Africa Market Value Share and BPS Analysis by Application, 2025 and 2035
  • Figure 136: Middle East and Africa Market Y-o-Y Growth Comparison by Application, 2025 to 2035
  • Figure 137: Middle East and Africa Market Attractiveness Analysis by Application
  • Figure 138: Middle East and Africa Market Value Share and BPS Analysis by Distribution Channel, 2025 and 2035
  • Figure 139: Middle East and Africa Market Y-o-Y Growth Comparison by Distribution Channel, 2025 to 2035
  • Figure 140: Middle East and Africa Market Attractiveness Analysis by Distribution Channel
  • Figure 141: Global Market - Tier Structure Analysis
  • Figure 142: Global Market - Company Share Analysis

Frequently Asked Questions

What is the projected size of the coenzyme Q10 market by 2035?

The global industry is expected to reach USD 2,210 million by 2035.

What is the market size of CoQ10 in 2025?

In 2025, the industry is valued at USD 786.95 million.

Which product form of the coenzyme Q10 market is expected to dominate?

Ubiquinol (the reduced form) is expected to dominate the industry in 2025 with 54.7% industry share.

Which application holds the largest share in the coenzyme Q10 market?

Dietary supplements will hold the largest industry share in 2025, accounting for 42.1%.

What is the leading distribution channel for the coenzyme Q10 market?

Retail pharmacies & drug stores are expected to be the leading distribution channel in 2025 with 20.3% industry share.

Explore Similar Insights

Future Market Insights

Coenzyme Q10 Market