Cryo-electron Microscopy Market Size and Share Forecast Outlook (2025 to 2035)
The Cryo-electron Microscopy Market is estimated to be valued at USD 1.8 billion in 2025 and is projected to reach USD 5.2 billion by 2035, registering a compound annual growth rate (CAGR) of 11.3% over the forecast period.
Quick Stats for Cryo-electron Microscopy Market
- Cryo-electron Microscopy Market Industry Value (2025): USD 1.8 billion
- Cryo-electron Microscopy Market Forecast Value (2035): USD 5.2 billion
- Cryo-electron Microscopy Market Forecast CAGR: 11.3%
- Leading Segment in Cryo-electron Microscopy Market in 2025: Instrument (45.3%)
- Key Growth Region in Cryo-electron Microscopy Market: North America, Asia-Pacific, Europe
- Top Key Players in Cryo-electron Microscopy Market: Thermo Fisher Scientific Inc., JEOL Ltd., Olympus Corporation, OPTIKA, Helmut Hund Gmbh, Labindia Instruments, Leica Microsystems, KEYENCE CORPORATION., ZEISS International, Molecular Devices LLC., Nikon Instruments Inc., Intertek Group plc, Caliber Imaging & Diagnostics, Lasertec Corporation, Thorlabs, Inc., Oxford Instruments
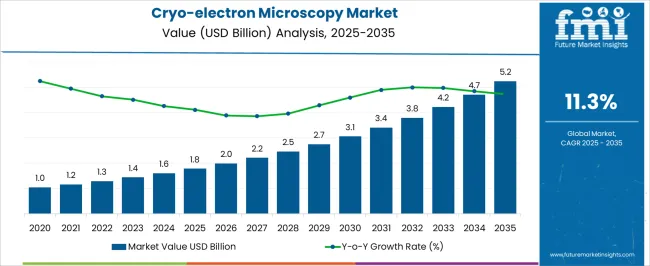
| Metric |
Value |
| Cryo-electron Microscopy Market Estimated Value in (2025 E) |
USD 1.8 billion |
| Cryo-electron Microscopy Market Forecast Value in (2035 F) |
USD 5.2 billion |
| Forecast CAGR (2025 to 2035) |
11.3% |
Rationale for Segmental Growth in the Cryo-Electron Microscopy Market
The cryo-electron microscopy market is growing at a notable pace, driven by its increasing role in structural biology, pharmaceutical research, and advanced life sciences applications. The demand is reinforced by the technology’s ability to provide high-resolution imaging of biomolecules without crystallization, positioning it as a preferred tool for next-generation drug discovery. The current scenario reflects a strong presence in academic and research institutes, where significant investments in advanced imaging facilities are accelerating adoption.
Technological advancements, including improved electron detectors and automation in sample preparation, have further enhanced accuracy and throughput. Industry collaborations between equipment manufacturers and research organizations are also driving market expansion.
Future growth is expected to be stimulated by expanding use cases in virology, immunology, and oncology, supported by rising global R&D spending. As the market continues to benefit from innovation and funding, cryo-electron microscopy is projected to remain a cornerstone in high-resolution imaging for biological research.
Segmental Analysis
Insights into the Instrument Segment
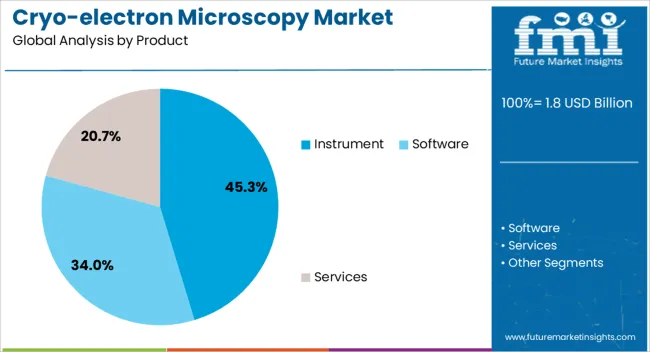
The instrument segment leads the product category in the cryo-electron microscopy market, holding approximately 45.30% share. Its dominance is attributed to the high capital investment required for advanced electron microscopes, which represent the core of the technology platform.
Instruments are widely adopted by research institutions and pharmaceutical companies to support drug target validation and structural analysis of proteins. This segment has benefited from continuous advancements in cryogenic sample handling and automation features that enhance imaging efficiency.
The long operational lifespan of instruments and the essential nature of these systems in biological research reinforce sustained demand. With the global emphasis on structural biology and molecular research, the instrument segment is expected to remain the primary revenue generator in the coming years.
Insights into the Transmission Electron Microscopy Segment:
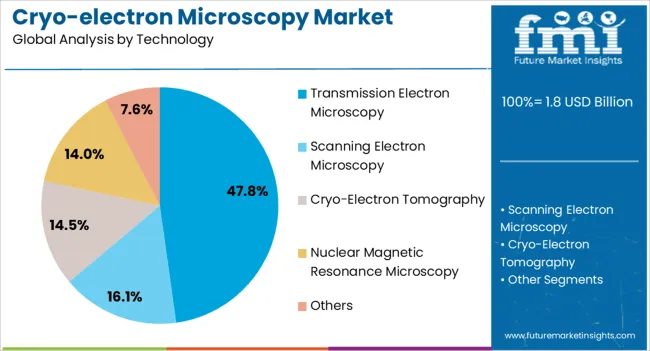
The transmission electron microscopy segment dominates the technology category with approximately 47.80% share, owing to its capability to deliver superior resolution and structural clarity of biological molecules. This technology enables visualization at near-atomic resolution, which has revolutionized research in virology, protein dynamics, and macromolecular complexes.
Its leadership is reinforced by advancements in direct electron detectors and image-processing software that improve accuracy and reduce analysis time. Transmission electron microscopy remains the gold standard for cryo-EM due to its established infrastructure and wide availability in academic research centers.
Continuous innovations are expected to further enhance resolution capabilities, consolidating its strong position within the market.
Insights into the Life Sciences Research and Academic Segment:
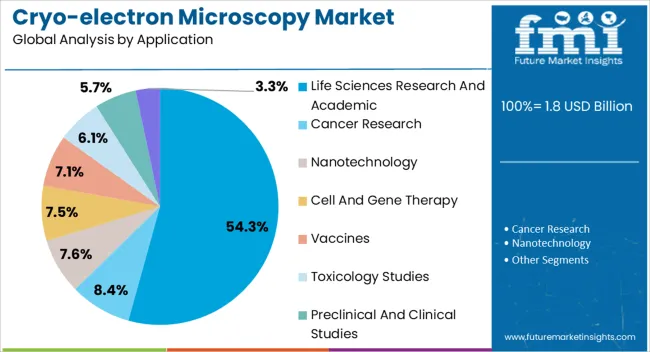
The life sciences research and academic segment holds the largest share of approximately 54.30% in the application category. This dominance is supported by significant investments from universities, research institutes, and government-funded laboratories focusing on structural biology and drug discovery.
The segment benefits from rising global collaborations aimed at accelerating the understanding of complex biological structures. Demand is further supported by the role of cryo-EM in addressing critical research challenges in infectious diseases and molecular biology.
With increasing publication output and the establishment of specialized cryo-EM facilities worldwide, the life sciences research and academic segment is expected to maintain its leadership in driving market expansion.
Consumption Trends in the Cryo-electron Microscopy Sector
- Cryo-electron microscopy (Cryo-EM) is gaining popularity because it provides high-resolution images of biological structures.
- Cryo-electron microscopy is preferred over traditional imaging techniques due to its ability to capture detailed molecular structures, leading to a shift in the market's adoption.
- The pharmaceutical and biotechnology industries recognize the instrumental role of cryo-electron microscopy in drug discovery and development, which has translated into robust sales.
- Cryo-electron microscopy’s versatility has increased sales as more research institutions and companies integrate it into their workflows.
- Collaborations and partnerships have also fueled cryo-electron microscopy’s growth, leading to shared resources and knowledge exchange.
- Educational initiatives and workshops play a crucial role in driving the adoption of cryo-electron microscopy, as researchers recognize its value in achieving groundbreaking insights.
- As awareness of the potential of cryo-electron microscopy grows, the demand for this advanced imaging technology is estimated to increase further.
Key Restraints Affecting Growth in the Cryo-electron Microscopy Market
The cryo-electron microscopy market is anticipated to surpass a valuation of USD 5.2 billion by 2035, with a growth rate of 11.4%.
While the cryo-electron microscopy market is experiencing growth, several restraining factors can adversely affect its development and expansion:
- The initial expense and ongoing maintenance costs of cryo-electron microscopy instruments can be substantial, making it challenging for smaller research institutions and laboratories with limited budgets to access this technology.
- The technical complexity of the technology can be a hindrance, leading to a shortage of skilled personnel and limiting the widespread adoption of cryo-electron microscopy.
- Traditional techniques like X-ray crystallography and nuclear magnetic resonance (NMR) spectroscopy still compete with cryo-electron microscopy. Researchers may choose alternative methods based on factors like cost, speed, and the specific requirements of their research.
- Establishing and maintaining a cryo-electron microscopy facility demands significant infrastructure, including specialized laboratories and controlled environments. The limited availability of such facilities can impede the widespread adoption of cryo-electron microscopy, particularly in regions with resource constraints.
- Using Cryo-electron microscopy may face regulatory challenges in certain applications, especially in drug development and clinical research. Compliance with ethical standards and regulatory approvals can obstruct the integration of cryo-electron microscopy in certain research areas.
Cryo-electron Microscopy Industry Analysis by Top Investment Segments
Data Processing, Image Analysis, and Overall Research Outcomes of Software on Cryo-electron Microscopy
Based on the product, the software segment dominates with a market share of 11.3%. This rising popularity is attributed to:
- The software is vital in handling the massive datasets generated by cryo-electron microscopy, which requires advanced image reconstruction, particle picking, and 3D modeling tools.
- As the field continues to evolve, the demand for innovative software products grows, enabling the seamless integration of cryo-EM into diverse research applications.
- The continuous advancements in software technologies have made cryo-EM more accessible to researchers with varying levels of expertise, facilitating collaboration and knowledge exchange within the scientific community.
| Attributes |
Details |
| Product |
Software |
| Market Share |
11.3% |
Exceptional Spatial Resolution and Detailed Imaging Capabilities of Transmission Electron Microscopy for Biological Samples
Based on the technology, transmission electron microscopy dominates the global market with a share of 11.2%. This rising popularity is attributed to:
- Researchers can visualize the internal structures of cells, organelles, and macromolecules at the nanoscale, providing vital insights into their morphology and organization.
- The high resolution of transmission electron microscopy is particularly significant in structural biology, enabling the observation of intricate details of biological specimens.
- Transmission electron microscopy's versatility, including both conventional and cryogenic applications, makes it an essential tool in various research fields, from cell biology to materials science.
| Attributes |
Details |
| Technology |
Transmission Electron Microscopy |
| Market Share |
11.2% |
Analysis of Top Countries Adopting Cryo-electron Microscopy Technologies
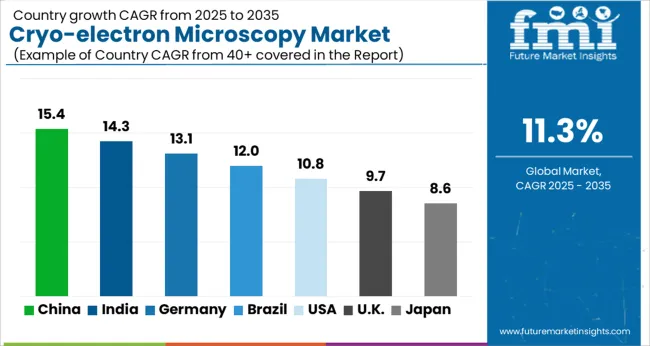
The section analyzes the cryo-electron microscopy market by country, including the United States, the United Kingdom, Japan, China, and South Korea. The table presents the CAGR for each country, indicating the expected market growth through 2035.
South Korea’s Commitment to Research Excellence, Strong Governmental Support, and Technological Advancements
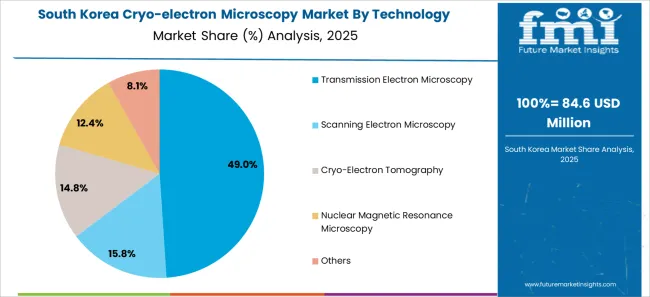
South Korea is the leading Asian country in the cryo-electron microscopy market. The South Korea cryo-electron microscopy market is expected to register a healthy growth of 13.5% until 2035.
- South Korea's emphasis on fostering a collaborative research environment and investing in infrastructure has led to the rapid adoption of cryo-electron microscopy in various scientific disciplines.
- South Korea's growing influence in structural biology research and its contributions to cryo-electron microscopy applications position the country as a significant player in the market.
- For instance, in 2025, JEOL, a manufacturer of electron microscopes, successfully conducted research along with Tohoku University to understand the chemical properties and functionality of proteins in aqueous solutions using a cryo-electron microscope.
Technological Prowess, Culture of Innovation, and Strategic Investments Fueling the Market in Japan
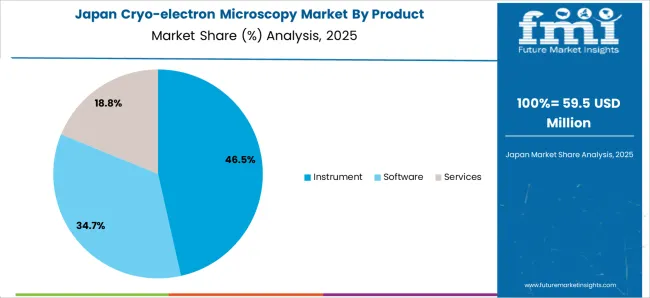
The Japan cryo-electron microscopy market is anticipated to register a CAGR of 12.2% through 2035.
- Several Japanese institutions and companies are early adopters of cryo-electron microscopy technology, contributing to its rapid integration into various research fields.
- Japan's commitment to scientific excellence and strong emphasis on interdisciplinary research position it as a leader in advancing cryo-electron microscopy applications and techniques.
- For instance, on May 31, 2024, Chugai Pharmaceutical Co. Ltd introduced a cryo-electron microscopy system in pharmaceuticals to accelerate research in drug discovery, including molecules and antibodies.
Growing Network of Research Institutions Driving the Marker in China
The China cryo-electron microscopy market is anticipated to register a CAGR of 11.8% through 2035.
- China’s commitment to fostering innovation, coupled with a surge in research funding, has propelled the adoption of cryo-electron microscopy in academic and industrial settings.
- China's increasing contributions to structural biology and its growing presence in the scientific community further solidify its position as a key player in the cryo-electron microscopy market.
The United States Holds a Strong Research Ecosystem, a Generous Funding Environment for Life Sciences
The United States dominates the cryo-electron microscopy market in the North American region. It is expected to exhibit a compound annual growth rate of 11.4% until 2035.
- The United States has established productive collaborations between academia and industry and significant investments in cutting-edge technologies, contributing to the country's leadership in advancing cryo-electron microscopic applications.
- The United States hosts numerous cryo-electron microscopy facilities and research centers, creating a conducive environment for innovation and developing advanced microscopy techniques.
The United Kingdom's Rich Scientific Heritage and Strong Emphasis on Structural Biology Research Upsurges the Market
The United Kingdom is leading the cryo-electron microscopy market in Europe, with a predicted growth of 12.1%.
- The country's top universities and research centers are at the forefront of cryo-electron microscopy advancements, fostering collaborations between academia and industry.
- The United Kingdom’s commitment to supporting scientific research and innovation positions it as a key player in driving. Moreover, the growth and application of cryo-electron microscopy technology across diverse scientific disciplines in the country fuel growth. For instance, the government is funding several research institutes with ultra-power imaging technology to probe molecules with cyro-EM.
Competitive Landscape of the Cryo-electron Microscopy Market
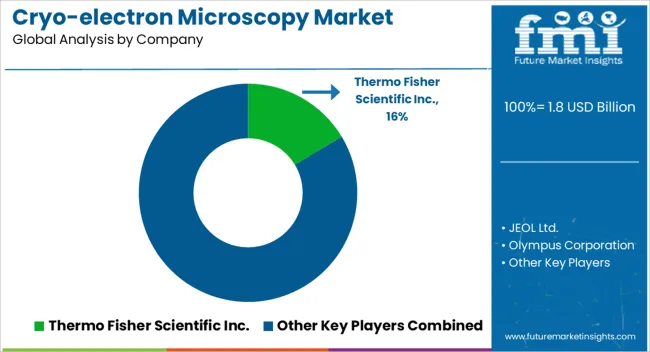
The global cryo-electron microscopy market is highly fragmented, with key players such as Thermo Fisher Scientific Inc., Olympus Corporation, OPTIKA, Helmut Hund Gmbh, Labindia Instruments, JEOL Ltd., Leica Microsystems, KEYENCE CORPORATION., ZEISS International, Molecular Devices, LLC., and Nikon Instruments Inc., among others.
These companies invest heavily in research and development to enhance cryo-electron microscopy instruments' capabilities, resolution, and workflows, making them more accessible and user-friendly.
Strategic partnerships and collaborations with pharmaceutical and biotech firms, academic research institutions, and government agencies also significantly expand the cryo-electron microscopy market and drive advancements in structural biology, drug discovery, and materials science applications.
Recent Developments:
- On November 9, 2025, Gatan's Latitude S software set a new standard for high-throughput collection of low-dose, single-particle cryo-electron microscopy datasets, offering enhanced capabilities for K3, BioContinuum, BioQuantum K3, and OneView cameras.
- On July 13, 2025, Generate Biomedicines launched a cryo-electron microscopy (cryo-EM) lab in Andover, Massachusetts. Utilizing AI for protein design, the lab aimed to expedite the discovery of protein-based therapeutics for oncology, immunology, and infectious diseases.
- On June 27, 2025, JEOL installed two Transmission Electron Microscopes, the CRYO ARM 200 and CRYO ARM 300, at Generate: Biomedicines in Andover, Massachusetts. These microscopes were crucial in capturing atomic-resolution details for accelerating drug discovery in oncology, immunology, and infectious diseases.
Leading Companies in the Cryo-electron Microscopy Sector
- JEOL Ltd.
- Thermo Fisher Scientific Inc.
- Olympus Corporation
- OPTIKA
- Helmut Hund Gmbh
- Labindia Instruments
- Leica Microsystems
- KEYENCE CORPORATION.
- ZEISS International
- Molecular Devices LLC.
- Nikon Instruments Inc.
- Intertek Group plc
- Caliber Imaging & Diagnostics
- Lasertec Corporation
- Thorlabs, Inc.
- Oxford Instruments
- Hamamatsu Photonics K.K.
- NanoFocus AG
- HORIBA, Ltd.
- Labomed, Inc.
- Creative Biostructure
- Gatan, Inc.
- Hitachi High-Tech Corporation
Top Segments Studied in the Cryo-electron Microscopy Market
By Product:
- Software
- Services
- Instrument
- Fully Automated Instruments
- Semi-Automated Instruments
By Technology:
- Transmission Electron Microscopy
- Scanning Electron Microscopy
- Cryo-Electron Tomography
- Nuclear Magnetic Resonance Microscopy
- Others
By Application:
- Cancer Research
- Nanotechnology
- Cell and Gene Therapy
- Vaccines
- Life Sciences Research and Academic
- Toxicology Studies
- Preclinical and Clinical Studies
- Healthcare
By Region:
- Asia Pacific
- Europe
- North America
- The Middle East & Africa
- Latin America
Frequently Asked Questions
How big is the cryo-electron microscopy market in 2025?
The global cryo-electron microscopy market is estimated to be valued at USD 1.8 billion in 2025.
What will be the size of cryo-electron microscopy market in 2035?
The market size for the cryo-electron microscopy market is projected to reach USD 5.2 billion by 2035.
How much will be the cryo-electron microscopy market growth between 2025 and 2035?
The cryo-electron microscopy market is expected to grow at a 11.3% CAGR between 2025 and 2035.
What are the key product types in the cryo-electron microscopy market?
The key product types in cryo-electron microscopy market are instrument, _fully automated instruments, _semi-automated instruments, software and services.
Which technology segment to contribute significant share in the cryo-electron microscopy market in 2025?
In terms of technology, transmission electron microscopy segment to command 47.8% share in the cryo-electron microscopy market in 2025.


