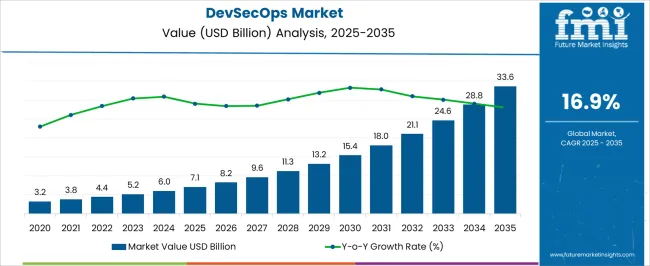
The DevSecOps Market is estimated to be valued at USD 7.1 billion in 2025 and is projected to reach USD 33.6 billion by 2035, registering a compound annual growth rate (CAGR) of 16.9% over the forecast period.
| Metric | Value |
|---|---|
| DevSecOps Market Estimated Value in (2025 E) | USD 7.1 billion |
| DevSecOps Market Forecast Value in (2035 F) | USD 33.6 billion |
| Forecast CAGR (2025 to 2035) | 16.9% |
The DevSecOps market is experiencing significant expansion as enterprises increasingly prioritize integrating security practices directly into development and operations workflows. The current market scenario is characterized by rising adoption of cloud-native architectures, containerization, microservices, and agile development practices, which have made traditional security approaches inadequate.
Security is being embedded earlier in the software development lifecycle to reduce vulnerabilities, enhance compliance, and improve risk management across organizations. Investments in automation, continuous integration, and continuous delivery pipelines are driving the adoption of DevSecOps solutions, particularly in large-scale enterprise environments.
The growing emphasis on regulatory compliance, cybersecurity threats, and data protection has made the integration of security tools and processes essential for enterprises seeking to maintain business continuity With the increasing complexity of IT ecosystems and the need for rapid software delivery, the DevSecOps market is poised for sustained growth, offering solutions that combine advanced security automation, monitoring, and analytics to ensure both agility and resilience in enterprise IT operations.
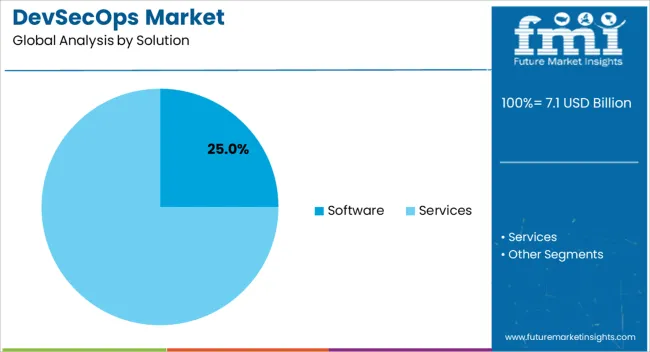
The Software solution segment is projected to hold 25.00% of the DevSecOps market revenue in 2025, establishing it as a leading solution category. This dominance is being attributed to the growing demand for platform-based tools that enable seamless integration of security checks into development and operational workflows.
Software solutions provide capabilities such as automated vulnerability scanning, code analysis, threat intelligence, and compliance monitoring, which are critical for minimizing risks during rapid software deployments. The adoption of cloud-native and containerized environments has further fueled the need for software-centric DevSecOps solutions, as these tools allow enterprises to maintain agility while ensuring robust security coverage.
Organizations are increasingly relying on software platforms that can be scaled across teams, integrated with multiple environments, and updated continuously without disrupting operations As a result, the software segment has witnessed accelerated deployment in organizations seeking to implement consistent security controls across complex development pipelines, driving its leading revenue share in the market.
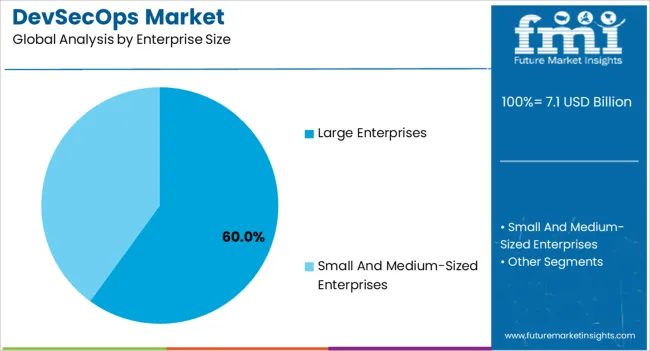
The large enterprise segment is expected to account for 60.00% of the DevSecOps market revenue in 2025, reflecting the predominant adoption by organizations with extensive IT operations. This leadership is being driven by the need for centralized security management across multiple teams, geographies, and complex application portfolios.
Large enterprises benefit from deploying DevSecOps practices as they enhance operational efficiency, reduce security vulnerabilities, and ensure regulatory compliance at scale. The integration of security into development and operations pipelines allows organizations to reduce time-to-market without compromising on risk management.
Additionally, large enterprises often have dedicated budgets and resources to implement enterprise-wide DevSecOps platforms, which supports automation, monitoring, and threat mitigation across numerous projects As cyber threats become increasingly sophisticated, these organizations continue to prioritize proactive security practices, reinforcing the growth of the large enterprise segment and its leadership position in the DevSecOps market.
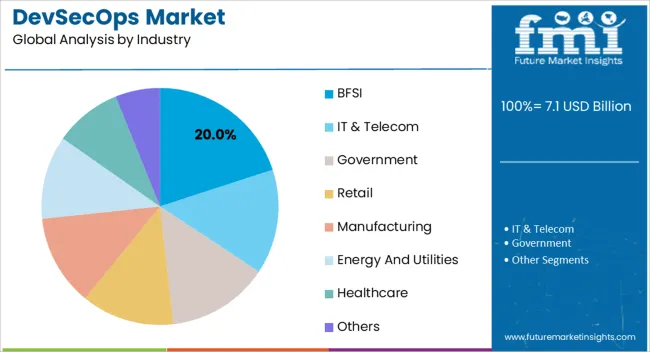
The BFSI industry segment is projected to capture 20.00% of the DevSecOps market revenue in 2025, positioning it as the leading industry adopter. This growth is being driven by the highly regulated nature of financial services, which requires rigorous security controls to safeguard sensitive customer data and comply with industry standards.
The adoption of DevSecOps practices in BFSI organizations enables real-time vulnerability detection, secure application deployment, and continuous monitoring of compliance requirements. The increasing frequency of cyberattacks targeting financial institutions has accelerated investment in automated security solutions that can be embedded within development pipelines.
Furthermore, BFSI enterprises are leveraging DevSecOps to enhance operational resilience, reduce risk exposure, and maintain trust with customers The combination of regulatory pressure, high-value digital assets, and the need for rapid, secure software delivery has reinforced the BFSI industry segment as a major contributor to the overall market growth, with continuous demand expected in the coming years.
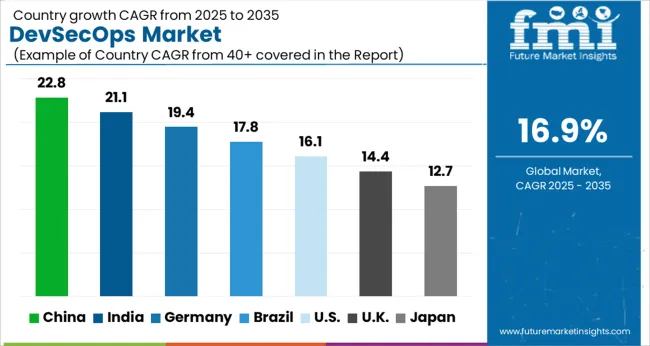
The global DevSecOps market is expected to grow at 17.8% CAGR between 2025 and 2035, in comparison to the 15.7% CAGR registered between 2020 to 2025. The rising need for highly secure continuous application delivery, increased focus on security and compliance, and surge in cyber crimes are some of the key factors driving growth in the global market.
Over the years, more and more companies have digitized their businesses and business operations to improve productivity. This has created demand for advanced solutions like DevSecOps and the trend is likely to continue during the forecast period.
Similarly, a growing concern among companies about cybersecurity is prompting them to use advanced security solutions. According to Accenture’s State of Cybersecurity survey 2024, which consisted of 4,744 respondents, 270 cyber-attacks were faced by companies and 29 of them were successful. The growing awareness of cyber threats and the steps to be taken to prevent them will therefore continue to encourage the adoption of development, security, and operation solutions.
DevSecOps is gaining traction because it is helping companies to create more agile and high-quality software. It can provide better security measures against cyber threats and hence industries like IT & telecom, government, BFSI, and others can benefit from it.
Services Segment to Witness the Highest Demand in 2025 & Beyond
DevSecOps is the application of tools and practices which help the development and operations teams with continuous integration and continuous deployment of software and applications. However, providing security features and maintaining the correct measures will require contribution from the operations teams as well.
As technology advances and so do the services for cyber-security. FMI predicts the services segment by the solution to grow at a stupendous CAGR of 21.1% during the forecast period.
These services assist in assessments, and implementation, and support secure product development with DevSecOps capability.
Growing Awareness of the Benefits of DevSecOps Fuelling Adoption in SMEs
By enterprise size, the large enterprise segment dominated the global market with a market share of around 55% in 2025. Large enterprises usually have the economic strength to purchase large-scale software products, systems, and applications, or develop them themselves. Due to this factor, they can digitize and implement other technical improvements. These enterprises are also the more attractive target for hackers and other cyber-attacks and hence they are required to implement greater security measures.
However, the small and medium-sized enterprises segment is poised to grow at the highest CAGR of 18.5% between 2025 and 2035, owing to the rising adoption of DevSecOps solutions in these businesses due to ease of use, increased agility, fast application delivery, and flexibility.
Besides this, the rise of threats and vulnerabilities will further boost the adoption of these security solutions in SMEs during the forecast period.
Rise in Cyber Threats Pushing Demand in the United States Market
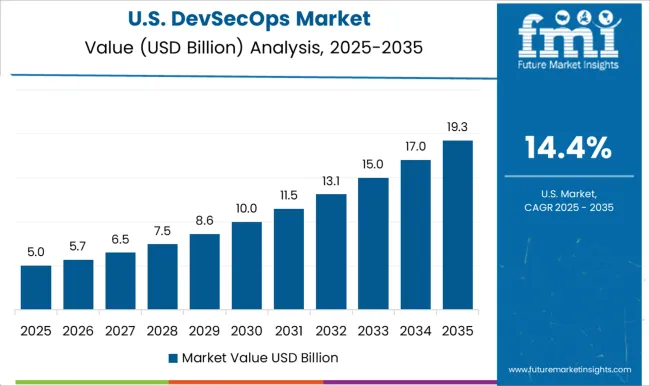
As per FMI, the United States accounted for around 77.7% share of the North American market in 2025 and it is anticipated to create an incremental D opportunity of around USD 2,195.8 million between 2025 and 2035. Growth in the market is driven by the strong presence of leading technological giants, the surge in cybercrimes, and the growing adoption of advanced technologies across numerous industries.
Due to the presence of large technology companies, there has been a sharp rise in data breach incidents across the United States during the last few years and the trend is likely to continue over the forecast period. For instance, the LinkedIn data breach in 2024, exposed information from 700 million users; or the Twitter data breach, exposed information from 5.4 million users. For such reasons, cyber security is a stark requirement in this country.
Constant security updates and bug fixes can help American organizations avoid data breaches and other cyber-attacks. Driven by this demand for DevSecOps solutions is expected to rise at a prolific pace across the United States during the forecast period.
Rising Adoption of DevSecOps in IT & Telecom Industry Propelling Sales in the Indian Market
In 2025, India held the largest share of 46.2% in the South Asia & Pacific market and it is further expected to create an incremental opportunity of USD 2,059.9 million by the end of 2035. The rapid expansion of end-use industries like BFSI and IT & telecom, the growing need for improving cybersecurity, and favorable government support are some of the factors driving growth in the Indian market.
India has the fastest-growing IT and telecom industry which is delivering solutions and services to clients both within and outside the country, which also raises cyber-security concerns. According to a survey that had 200 respondents and was conducted by Mezmo, a software company based in the United States, as of now the implementation of DevSecOps is low, but 62% of their respondents said that their organizations do intend to implement it in the future.
According to the same report, the users of DevSecOps witnessed a growth in incident detection and response speeds. Due to the growth in the IT and telecom industry as well as the inclination that companies have towards implementing advanced security solutions, India will continue to remain one of the most lucrative markets for DevSecOps.
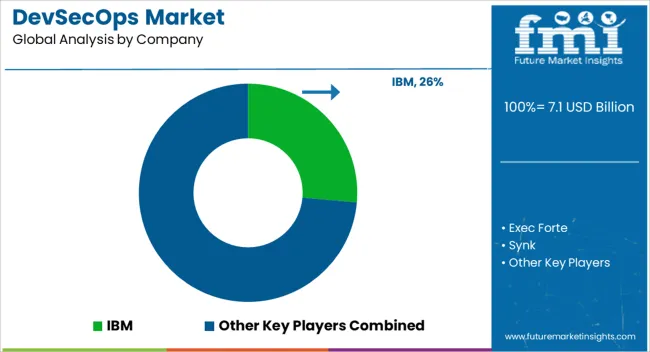
DevSecOps is provided by software companies that also tend to provide solutions and services in the cloud, software development, and cyber security.
It has also seen integrations with the cloud and IoT, as stated below:
Copado, Red Hat, and Snyk - Top 3 Front-Runners Fixing the Cybersecurity Vulnerabilities through DevSecOps
The Log4j vulnerability has made it quite evident that DevSecOps will be a critical component of cybersecurity. Sensing the need for addressing this vulnerability, the DevSecOps space has been witnessing a lot of investment from venture capitalists. For instance, password-less authentication provider Transmit Security, based in Israel, raised USD 543 million in Series A funding at a USD 2.3 billion pre-money valuation in June. Further, cloud security provider Lacework, based in San Jose, California, closed a USD 525 million round at a valuation of more than USD 1 billion in January.
Copado, a prominent DevSecOps company, is partnering with security testing platforms to consolidate its position. For instance, in December 2024, the company announced a partnership with DigitSec, which is a patented provider of SaaS Security Scanners. The partnership will help the company in finding vulnerabilities before deployment, a key area of concern for most companies today.
Copado is also going through the merger and acquisition route to add more capabilities to its offerings. For instance, in March 2024, it acquired New Context, a leading United States-based DevSecOps company, to expand its DevSecOps platform.
Red Hat has been increasing its share in the DevSecOps space through its popular OpenShift container platform. To further consolidate its position, Red Hat acquired VMware Tanzu in May 2025. This acquisition will give Red Hat more capabilities and eventually help it gain more vendors.
Red Hat is also betting big on the security automation tools. It is actively investing in security automation and acquiring companies that have expertise in this domain. For instance, Red Hat announced in 2024 that it will be purchasing the Kubernetes security business StackRox, which has raised over USD 65 million in funding since its establishment in 2014. The company purchased StackRox, a sophisticated security solution for cloud-native apps, and rebranded it as Red Hat Advanced Cluster Security (ACS) for Kubernetes. The business is now making ACS for Kubernetes available for open source under the moniker StackRox.
Similarly, in March 2025, the company unveiled new levels of security innovations and capabilities across its portfolio of open hybrid cloud technologies to help organizations mitigate risks and meet compliance requirements.
Snyk, another leading DevSecOps player, has announced Synk Cloud, as part of its strategy to boost its position in this domain. The Snyk Cloud offering expands the business's current Developer Security Platform, enabling more businesses to adopt DevSecOps and foster even more fruitful collaboration among their developer, operations, security, and compliance teams.
| Attributes | Details |
|---|---|
| Forecast Period | 2025 to 2035 |
| Historical Data Available for | 2020 to 2025 |
| Market Analysis | USD Billion for Value |
| Key Regions Covered | North America; Latin America; Europe; East Asia; South Asia and the Pacific; Middle East & Africa (MEA) |
| Key Countries Covered | United States, Canada, Germany, United Kingdom, Nordic, Russia, BENELUX, Poland, France, Spain, Italy, Czech Republic, Hungary, Rest of EMEAI, Brazil, Peru, Argentina, Mexico, South Africa, Northern Africa, GCC Countries, China, Japan, South Korea, India, ASEAN, Thailand, Malaysia, Indonesia, Australia, New Zealand, Others |
| Key Segments Covered | Solution, Enterprise Size, Industry, Region |
| Report Coverage | Market Forecast, Company Share Analysis, Competition Intelligence, Trend Analysis, Market Dynamics and Challenges, and Strategic Growth Initiatives |
The global devsecops market is estimated to be valued at USD 7.1 billion in 2025.
The market size for the devsecops market is projected to reach USD 33.6 billion by 2035.
The devsecops market is expected to grow at a 16.9% CAGR between 2025 and 2035.
The key product types in devsecops market are software, _on-premise, _cloud, services, _professional services and _managed services.
In terms of enterprise size, large enterprises segment to command 60.0% share in the devsecops market in 2025.


Our Research Products

The "Full Research Suite" delivers actionable market intel, deep dives on markets or technologies, so clients act faster, cut risk, and unlock growth.

The Leaderboard benchmarks and ranks top vendors, classifying them as Established Leaders, Leading Challengers, or Disruptors & Challengers.

Locates where complements amplify value and substitutes erode it, forecasting net impact by horizon

We deliver granular, decision-grade intel: market sizing, 5-year forecasts, pricing, adoption, usage, revenue, and operational KPIs—plus competitor tracking, regulation, and value chains—across 60 countries broadly.

Spot the shifts before they hit your P&L. We track inflection points, adoption curves, pricing moves, and ecosystem plays to show where demand is heading, why it is changing, and what to do next across high-growth markets and disruptive tech

Real-time reads of user behavior. We track shifting priorities, perceptions of today’s and next-gen services, and provider experience, then pace how fast tech moves from trial to adoption, blending buyer, consumer, and channel inputs with social signals (#WhySwitch, #UX).

Partner with our analyst team to build a custom report designed around your business priorities. From analysing market trends to assessing competitors or crafting bespoke datasets, we tailor insights to your needs.
Supplier Intelligence
Discovery & Profiling
Capacity & Footprint
Performance & Risk
Compliance & Governance
Commercial Readiness
Who Supplies Whom
Scorecards & Shortlists
Playbooks & Docs
Category Intelligence
Definition & Scope
Demand & Use Cases
Cost Drivers
Market Structure
Supply Chain Map
Trade & Policy
Operating Norms
Deliverables
Buyer Intelligence
Account Basics
Spend & Scope
Procurement Model
Vendor Requirements
Terms & Policies
Entry Strategy
Pain Points & Triggers
Outputs
Pricing Analysis
Benchmarks
Trends
Should-Cost
Indexation
Landed Cost
Commercial Terms
Deliverables
Brand Analysis
Positioning & Value Prop
Share & Presence
Customer Evidence
Go-to-Market
Digital & Reputation
Compliance & Trust
KPIs & Gaps
Outputs
Full Research Suite comprises of:
Market outlook & trends analysis
Interviews & case studies
Strategic recommendations
Vendor profiles & capabilities analysis
5-year forecasts
8 regions and 60+ country-level data splits
Market segment data splits
12 months of continuous data updates
DELIVERED AS:
PDF EXCEL ONLINE

Thank you!
You will receive an email from our Business Development Manager. Please be sure to check your SPAM/JUNK folder too.
Chat With
MaRIA