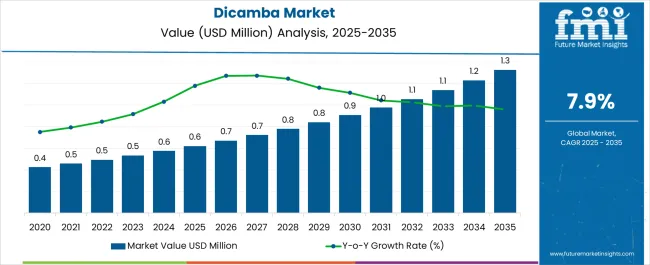
The global dicamba market is estimated to register a CAGR of 7.90% during the forecast period. The global market value is US$ 532.41 million in 2023 and is predicted to reach US$ 1,138.83 million by 2033.
Key Factors Upsurge the Global Dicamba Market Share
Rising Demand for Crop Protection:The increasing demand for food production enhances effective food production and surges the adoption of dicamba-dicamba.
Expanding Agriculture Sector:The rapidly growing agriculture industry is enhancing the market growth with the adoption of dicamba. Global agriculture is vast and widely used for the cultivation of crops, increasing the demand for dicamba.
Weed Resistance:The increasing adoption of dicamba helps to reduce weed cultivation and promote weed control solutions are driving the global market growth. Farmers are increasing the demand for dicamba to enhance their cultivation of plants and reduce unwanted plants and vegetation.
Technological Advancements:Ongoing technologies are developing eco-friendly dicamba with effective innovations. Manufacturers are making efforts to develop low-volatility formulations that reduce carbon footprints and limit off-target drift, which are gaining global market growth.
Government Regulations:The government imposes strict regulations and policies on the use of dicamba for crop cultivation with specific terms and conditions to develop suitable output to increase the adoption of dicamba.
Awareness and Education:Manufacturers are offering proper guidance and awareness about the dicamba application to ensure farmers' safety. Agriculture professionals are adopting proper techniques and measures to expand the global market revenue.
Climate Change and Weather Patterns:Rising pests, changing climate, and emerging weed plants are surging the demand for dicamba.
Attributes | Details |
---|---|
Dicamba Market Size, 2023 | US$ 532.41 million |
Dicamba Market Size, 2033 | US$ 1,138.83 million |
Value-based CAGR from 2023 to 2033 | 7.90% |
Don't pay for what you don't need
Customize your report by selecting specific countries or regions and save 30%!
Regulatory Scrutiny:Increasing regulation scrutiny may decline the demand for dicamba among farmers in various countries. The growing concerns about off-target drift and increasing adoption of organic farming may decline the global market growth.
Legal Issues:The increasing legal disputes and lawsuits against the use of dicamba in may cause a decline in market growth. These legal factors may face challenges among manufacturers and increase the prices of dicamba. Due to higher costs, farmers who are not prepared to buy these chemicals may also restrain the market growth.
Alternative Methods:Farmers are shifting towards alternative methods such as natural farming, cover cropping, and other cultivation methods that may decline the uses of dicamba.
Import-export Restrictions:The restriction of dicamba trade among various regions may affect the market growth among international borders.
The global market grew at a steady historical growth, with a valuation of US$ 493.43 million in 2022. The increasing farmer's demand for resistant unwanted plants is raising the adoption of dicamba for enhanced crop protection, and production is surging the market revenue. Key companies are introducing new and unique formulas to reduce off-target drift and reduce volatility.
Historical Market Valuation, 2022 | US$ 493.43 million |
---|
The key players are emerging legal battles related to dicamba products that damage farmers' crops, and landowners are seeking compensation for their losses. On the other side, they are invested heavily in research and development activities to improve dicamba formulations to reduce risks and damage to crops. Rising incidences of crop damage have a heavy impact on the country's economy, as the agriculture sector covers a relevant share in uplifting the country's GDP.
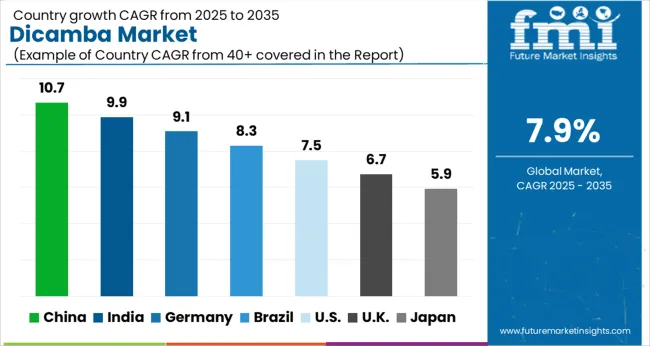
Countries | Forecast CAGR from 2023 to 2033 |
---|---|
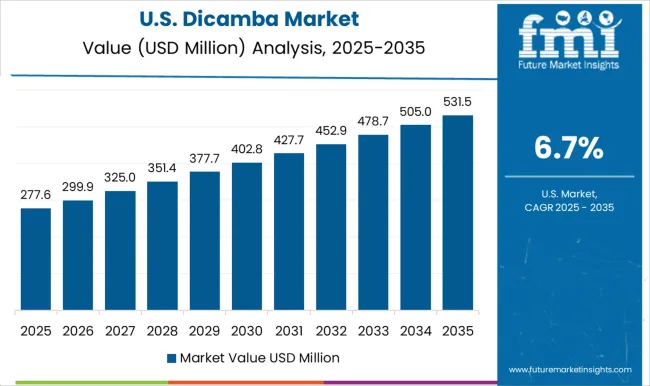
United States | 8.80% |
Canada | 7.70% |
Germany | 7.90% |
Italy | 5.50% |
France | 7.50% |
United Kingdom | 7.20% |
Spain | 6.70% |
China | 8.60% |
India | 8.80% |
Japan | 4.30% |
ASEAN | 8.50% |
Australia and New Zealand | 8.0% |
The United States market is estimated to capture a CAGR of 8.80% during the forecast period. Rising advanced farming technologies and farming practices are gaining vast popularity in the agriculture sector, increasing the adoption of dicamba in the country. The growing widespread of genetically modified crops such as cotton and soybeans is increasing the adoption of dicamba-related products for fertilization, which is driving the market growth.
Key companies are focusing on developing low-volatility formulations with smart technologies and investing vastly in research activities. These companies are making strategies to take action on developing herbicides that maintain the quality of crops without damaging them and are expanding the United States dicamba market growth.
The United Kingdom market is anticipated to secure a CAGR of 7.20% through 2033. The increasing demand fordicamba weed control solutionswith strict regulations is surging the United Kingdom's dicamba market size. Key players are approving their herbicides by the European Union Regulations to offer safe and registered dicamba to farmers for crop protection.
Increasing farmers' demand for advanced, safe, and authorized dicamba-related products may surge the market revenue in the country. Key players are focused on farmers' expectations related to their crop's production and safety and are offering new technical farming solutions that significantly boost the market growth in the country.
The market in Canada is anticipated to capture a CAGR of 7.70% over the forecast period. The increasing cultivation of a wide range of crops is significantly raising the demand for dicamba among farmers. Agriculture professionals are focused on environmental impact and developing low-hazardous dicamba with standardized regulations that enhance crop quality and production.
Canada's dicamba marketis propelled by changing weather conditions; temperatures and rainfall are surging the demand for herbicide products such as dicamba. Key companies are looking for collaboration with international companies to manage their strategies and plans with innovative ideas to expand the market in the country.
The market in China is estimated to capture a CAGR of 8.60% through 2033. Increasing agriculture practices with advanced technologies are raising crop production and enhancing their quality, accelerating the demand for dicamba among farmers. Farmers prefer dicamba for specific crops such as wheat and cotton to improve their production and reduce the uncertain growing of plants nearby them.
China is vast in the agriculture sector and produces a wide range of crops such as corn, wheat, and rice with the adoption of dicamba. Farmers in China exporting a wide range of products among various countries due to better crop production in the country are significantly increasing the China dicamba market size. China authorities are ensuring crop safety and production by imposing strict regulations on developing dicamba products to minimize environmental impacts.
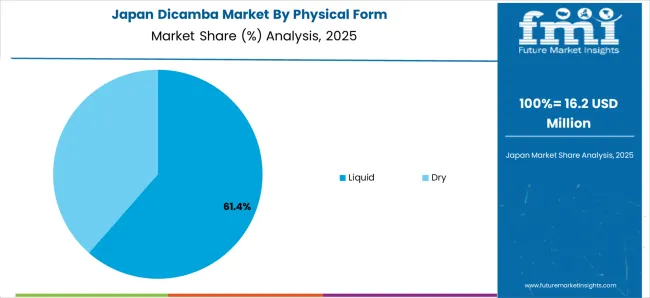
The Japanese market is estimated to register a CAGR of 4.30% over the forecast period. The increasing cultivation of a variety of crops with strict regulations is increasing the adoption of dicamba. Japan is vast in technology and is developing advanced solutions to increase crop production, offering suitable and specific dicamba-related products to meet farmers' desires.
Japan's dicamba marketis significantly growing by expanding the agriculture sector, improving sustainability, and focusing ondicamba weed control solutions. Key companies are focusing on effective weed control solutions to enhance crop quality and production in the country. They are choosing minimal environmental impact strategies in the country, increasing the demand for dicamba.
Top Application | Agriculture |
---|---|
Market Share in 2023 | 85.6% |
Based on application, the agriculture sector accounts for a share of 85.6% of the global dicamba market. The increasing demand for crop protection and the reduction of unwanted plants and bushes are expanding the adoption of dicamba. Farmers are making efforts to protect their crops from climate changes, root damage, and other conditions that are surging the demand for dicamba.
The rising demand for dicamba for adequate crop protection and control weeds in the agriculture practices. Farmers are producing high-yield crops by adopting dicamba-related products with sustainable options. They prefer lower doses of dicamba products to maintain environmental regulations. The global agriculture industry is widely accepting dicamba products, which are crucial in capturing vast revenue.
Get the data you need at a Fraction of the cost
Personalize your report by choosing insights you need
and save 40%!
The global dicamba market is fragmented by several major players, significantly boosting vast revenue. These players are investing their million-dollar amount in research and development activities to expand the market reach. Key players are adopting various marketing strategies to advance the global market, including collaborations, product launches, partnerships, and agreements.
Key players are focusing on developing cost-effective and durable products that satisfy end users' requirements. Manufacturers are focused on developing low-hazardous chemicals to reduce crop damage and enhance their productivity. They are experimenting with new formulations to develop eco-friendly products that enhance crop production.
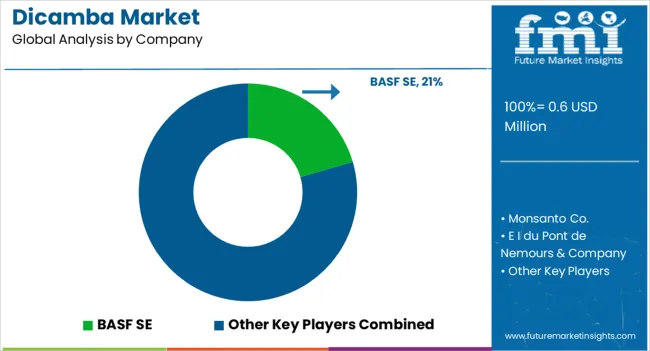
Top Two Players in the Global Dicamba Market
Recent Developments in the Global Dicamba Market
The dicamba market is estimated to secure a valuation of US$ 532.41 million in 2023.
The United States is leading the market for dicamba.
The dicamba market is likely to capture a CAGR of 7.90% through 2033.
The rising adoption of sustainable farming practices.
BASF SE and Monsanto Co. are the key players in the dicamba market.
1. Executive Summary 1.1. Global Market Outlook 1.2. Demand-side Trends 1.3. Supply-side Trends 1.4. Technology Roadmap Analysis 1.5. Analysis and Recommendations 2. Market Overview 2.1. Market Coverage / Taxonomy 2.2. Market Definition / Scope / Limitations 3. Market Background 3.1. Market Dynamics 3.1.1. Drivers 3.1.2. Restraints 3.1.3. Opportunity 3.1.4. Trends 3.2. Scenario Forecast 3.2.1. Demand in Optimistic Scenario 3.2.2. Demand in Likely Scenario 3.2.3. Demand in Conservative Scenario 3.3. Opportunity Map Analysis 3.4. Product Life Cycle Analysis 3.5. Supply Chain Analysis 3.5.1. Supply Side Participants and their Roles 3.5.1.1. Producers 3.5.1.2. Mid-Level Participants (Traders/ Agents/ Brokers) 3.5.1.3. Wholesalers and Distributors 3.5.2. Value Added and Value Created at Node in the Supply Chain 3.5.3. List of Raw Material Suppliers 3.5.4. List of Existing and Potential Buyer’s 3.6. Investment Feasibility Matrix 3.7. Value Chain Analysis 3.7.1. Profit Margin Analysis 3.7.2. Wholesalers and Distributors 3.7.3. Retailers 3.8. PESTLE and Porter’s Analysis 3.9. Regulatory Landscape 3.9.1. By Key Regions 3.9.2. By Key Countries 3.10. Regional Parent Market Outlook 3.11. Production and Consumption Statistics 3.12. Import and Export Statistics 4. Global Market Analysis 2018 to 2022 and Forecast, 2023 to 2033 4.1. Historical Market Size Value (US$ Million) & Volume (Tons) Analysis, 2018 to 2022 4.2. Current and Future Market Size Value (US$ Million) & Volume (Tons) Projections, 2023 to 2033 4.2.1. Y-o-Y Growth Trend Analysis 4.2.2. Absolute $ Opportunity Analysis 5. Global Market Analysis 2018 to 2022 and Forecast 2023 to 2033, By Physical Form 5.1. Introduction / Key Findings 5.2. Historical Market Size Value (US$ Million) & Volume (Tons) Analysis By Physical Form, 2018 to 2022 5.3. Current and Future Market Size Value (US$ Million) & Volume (Tons) Analysis and Forecast By Physical Form, 2023 to 2033 5.3.1. Liquid 5.3.2. Dry 5.4. Y-o-Y Growth Trend Analysis By Physical Form, 2018 to 2022 5.5. Absolute $ Opportunity Analysis By Physical Form, 2023 to 2033 6. Global Market Analysis 2018 to 2022 and Forecast 2023 to 2033, By Time Application 6.1. Introduction / Key Findings 6.2. Historical Market Size Value (US$ Million) & Volume (Tons) Analysis By Time Application, 2018 to 2022 6.3. Current and Future Market Size Value (US$ Million) & Volume (Tons) Analysis and Forecast By Time Application, 2023 to 2033 6.3.1. Post-emergence 6.3.2. Pre-emergence 6.4. Y-o-Y Growth Trend Analysis By Time Application, 2018 to 2022 6.5. Absolute $ Opportunity Analysis By Time Application, 2023 to 2033 7. Global Market Analysis 2018 to 2022 and Forecast 2023 to 2033, By Crop Type 7.1. Introduction / Key Findings 7.2. Historical Market Size Value (US$ Million) & Volume (Tons) Analysis By Crop Type, 2018 to 2022 7.3. Current and Future Market Size Value (US$ Million) & Volume (Tons) Analysis and Forecast By Crop Type, 2023 to 2033 7.3.1. Cereal & grains 7.3.2. Oilseeds & pulses 7.3.3. Pastures & forage crops 7.4. Y-o-Y Growth Trend Analysis By Crop Type, 2018 to 2022 7.5. Absolute $ Opportunity Analysis By Crop Type, 2023 to 2033 8. Global Market Analysis 2018 to 2022 and Forecast 2023 to 2033, By Region 8.1. Introduction 8.2. Historical Market Size Value (US$ Million) & Volume (Tons) Analysis By Region, 2018 to 2022 8.3. Current Market Size Value (US$ Million) & Volume (Tons) Analysis and Forecast By Region, 2023 to 2033 8.3.1. North America 8.3.2. Latin America 8.3.3. Western Europe 8.3.4. Eastern Europe 8.3.5. South Asia and Pacific 8.3.6. East Asia 8.3.7. Middle East and Africa 8.4. Market Attractiveness Analysis By Region 9. North America Market Analysis 2018 to 2022 and Forecast 2023 to 2033, By Country 9.1. Historical Market Size Value (US$ Million) & Volume (Tons) Trend Analysis By Market Taxonomy, 2018 to 2022 9.2. Market Size Value (US$ Million) & Volume (Tons) Forecast By Market Taxonomy, 2023 to 2033 9.2.1. By Country 9.2.1.1. USA 9.2.1.2. Canada 9.2.2. By Physical Form 9.2.3. By Time Application 9.2.4. By Crop Type 9.3. Market Attractiveness Analysis 9.3.1. By Country 9.3.2. By Physical Form 9.3.3. By Time Application 9.3.4. By Crop Type 9.4. Key Takeaways 10. Latin America Market Analysis 2018 to 2022 and Forecast 2023 to 2033, By Country 10.1. Historical Market Size Value (US$ Million) & Volume (Tons) Trend Analysis By Market Taxonomy, 2018 to 2022 10.2. Market Size Value (US$ Million) & Volume (Tons) Forecast By Market Taxonomy, 2023 to 2033 10.2.1. By Country 10.2.1.1. Brazil 10.2.1.2. Mexico 10.2.1.3. Rest of Latin America 10.2.2. By Physical Form 10.2.3. By Time Application 10.2.4. By Crop Type 10.3. Market Attractiveness Analysis 10.3.1. By Country 10.3.2. By Physical Form 10.3.3. By Time Application 10.3.4. By Crop Type 10.4. Key Takeaways 11. Western Europe Market Analysis 2018 to 2022 and Forecast 2023 to 2033, By Country 11.1. Historical Market Size Value (US$ Million) & Volume (Tons) Trend Analysis By Market Taxonomy, 2018 to 2022 11.2. Market Size Value (US$ Million) & Volume (Tons) Forecast By Market Taxonomy, 2023 to 2033 11.2.1. By Country 11.2.1.1. Germany 11.2.1.2. UK 11.2.1.3. France 11.2.1.4. Spain 11.2.1.5. Italy 11.2.1.6. Rest of Western Europe 11.2.2. By Physical Form 11.2.3. By Time Application 11.2.4. By Crop Type 11.3. Market Attractiveness Analysis 11.3.1. By Country 11.3.2. By Physical Form 11.3.3. By Time Application 11.3.4. By Crop Type 11.4. Key Takeaways 12. Eastern Europe Market Analysis 2018 to 2022 and Forecast 2023 to 2033, By Country 12.1. Historical Market Size Value (US$ Million) & Volume (Tons) Trend Analysis By Market Taxonomy, 2018 to 2022 12.2. Market Size Value (US$ Million) & Volume (Tons) Forecast By Market Taxonomy, 2023 to 2033 12.2.1. By Country 12.2.1.1. Poland 12.2.1.2. Russia 12.2.1.3. Czech Republic 12.2.1.4. Romania 12.2.1.5. Rest of Eastern Europe 12.2.2. By Physical Form 12.2.3. By Time Application 12.2.4. By Crop Type 12.3. Market Attractiveness Analysis 12.3.1. By Country 12.3.2. By Physical Form 12.3.3. By Time Application 12.3.4. By Crop Type 12.4. Key Takeaways 13. South Asia and Pacific Market Analysis 2018 to 2022 and Forecast 2023 to 2033, By Country 13.1. Historical Market Size Value (US$ Million) & Volume (Tons) Trend Analysis By Market Taxonomy, 2018 to 2022 13.2. Market Size Value (US$ Million) & Volume (Tons) Forecast By Market Taxonomy, 2023 to 2033 13.2.1. By Country 13.2.1.1. India 13.2.1.2. Bangladesh 13.2.1.3. Australia 13.2.1.4. New Zealand 13.2.1.5. Rest of South Asia and Pacific 13.2.2. By Physical Form 13.2.3. By Time Application 13.2.4. By Crop Type 13.3. Market Attractiveness Analysis 13.3.1. By Country 13.3.2. By Physical Form 13.3.3. By Time Application 13.3.4. By Crop Type 13.4. Key Takeaways 14. East Asia Market Analysis 2018 to 2022 and Forecast 2023 to 2033, By Country 14.1. Historical Market Size Value (US$ Million) & Volume (Tons) Trend Analysis By Market Taxonomy, 2018 to 2022 14.2. Market Size Value (US$ Million) & Volume (Tons) Forecast By Market Taxonomy, 2023 to 2033 14.2.1. By Country 14.2.1.1. China 14.2.1.2. Japan 14.2.1.3. South Korea 14.2.2. By Physical Form 14.2.3. By Time Application 14.2.4. By Crop Type 14.3. Market Attractiveness Analysis 14.3.1. By Country 14.3.2. By Physical Form 14.3.3. By Time Application 14.3.4. By Crop Type 14.4. Key Takeaways 15. Middle East and Africa Market Analysis 2018 to 2022 and Forecast 2023 to 2033, By Country 15.1. Historical Market Size Value (US$ Million) & Volume (Tons) Trend Analysis By Market Taxonomy, 2018 to 2022 15.2. Market Size Value (US$ Million) & Volume (Tons) Forecast By Market Taxonomy, 2023 to 2033 15.2.1. By Country 15.2.1.1. GCC Countries 15.2.1.2. South Africa 15.2.1.3. Israel 15.2.1.4. Rest of MEA 15.2.2. By Physical Form 15.2.3. By Time Application 15.2.4. By Crop Type 15.3. Market Attractiveness Analysis 15.3.1. By Country 15.3.2. By Physical Form 15.3.3. By Time Application 15.3.4. By Crop Type 15.4. Key Takeaways 16. Key Countries Market Analysis 16.1. USA 16.1.1. Pricing Analysis 16.1.2. Market Share Analysis, 2022 16.1.2.1. By Physical Form 16.1.2.2. By Time Application 16.1.2.3. By Crop Type 16.2. Canada 16.2.1. Pricing Analysis 16.2.2. Market Share Analysis, 2022 16.2.2.1. By Physical Form 16.2.2.2. By Time Application 16.2.2.3. By Crop Type 16.3. Brazil 16.3.1. Pricing Analysis 16.3.2. Market Share Analysis, 2022 16.3.2.1. By Physical Form 16.3.2.2. By Time Application 16.3.2.3. By Crop Type 16.4. Mexico 16.4.1. Pricing Analysis 16.4.2. Market Share Analysis, 2022 16.4.2.1. By Physical Form 16.4.2.2. By Time Application 16.4.2.3. By Crop Type 16.5. Germany 16.5.1. Pricing Analysis 16.5.2. Market Share Analysis, 2022 16.5.2.1. By Physical Form 16.5.2.2. By Time Application 16.5.2.3. By Crop Type 16.6. UK 16.6.1. Pricing Analysis 16.6.2. Market Share Analysis, 2022 16.6.2.1. By Physical Form 16.6.2.2. By Time Application 16.6.2.3. By Crop Type 16.7. France 16.7.1. Pricing Analysis 16.7.2. Market Share Analysis, 2022 16.7.2.1. By Physical Form 16.7.2.2. By Time Application 16.7.2.3. By Crop Type 16.8. Spain 16.8.1. Pricing Analysis 16.8.2. Market Share Analysis, 2022 16.8.2.1. By Physical Form 16.8.2.2. By Time Application 16.8.2.3. By Crop Type 16.9. Italy 16.9.1. Pricing Analysis 16.9.2. Market Share Analysis, 2022 16.9.2.1. By Physical Form 16.9.2.2. By Time Application 16.9.2.3. By Crop Type 16.10. Poland 16.10.1. Pricing Analysis 16.10.2. Market Share Analysis, 2022 16.10.2.1. By Physical Form 16.10.2.2. By Time Application 16.10.2.3. By Crop Type 16.11. Russia 16.11.1. Pricing Analysis 16.11.2. Market Share Analysis, 2022 16.11.2.1. By Physical Form 16.11.2.2. By Time Application 16.11.2.3. By Crop Type 16.12. Czech Republic 16.12.1. Pricing Analysis 16.12.2. Market Share Analysis, 2022 16.12.2.1. By Physical Form 16.12.2.2. By Time Application 16.12.2.3. By Crop Type 16.13. Romania 16.13.1. Pricing Analysis 16.13.2. Market Share Analysis, 2022 16.13.2.1. By Physical Form 16.13.2.2. By Time Application 16.13.2.3. By Crop Type 16.14. India 16.14.1. Pricing Analysis 16.14.2. Market Share Analysis, 2022 16.14.2.1. By Physical Form 16.14.2.2. By Time Application 16.14.2.3. By Crop Type 16.15. Bangladesh 16.15.1. Pricing Analysis 16.15.2. Market Share Analysis, 2022 16.15.2.1. By Physical Form 16.15.2.2. By Time Application 16.15.2.3. By Crop Type 16.16. Australia 16.16.1. Pricing Analysis 16.16.2. Market Share Analysis, 2022 16.16.2.1. By Physical Form 16.16.2.2. By Time Application 16.16.2.3. By Crop Type 16.17. New Zealand 16.17.1. Pricing Analysis 16.17.2. Market Share Analysis, 2022 16.17.2.1. By Physical Form 16.17.2.2. By Time Application 16.17.2.3. By Crop Type 16.18. China 16.18.1. Pricing Analysis 16.18.2. Market Share Analysis, 2022 16.18.2.1. By Physical Form 16.18.2.2. By Time Application 16.18.2.3. By Crop Type 16.19. Japan 16.19.1. Pricing Analysis 16.19.2. Market Share Analysis, 2022 16.19.2.1. By Physical Form 16.19.2.2. By Time Application 16.19.2.3. By Crop Type 16.20. South Korea 16.20.1. Pricing Analysis 16.20.2. Market Share Analysis, 2022 16.20.2.1. By Physical Form 16.20.2.2. By Time Application 16.20.2.3. By Crop Type 16.21. GCC Countries 16.21.1. Pricing Analysis 16.21.2. Market Share Analysis, 2022 16.21.2.1. By Physical Form 16.21.2.2. By Time Application 16.21.2.3. By Crop Type 16.22. South Africa 16.22.1. Pricing Analysis 16.22.2. Market Share Analysis, 2022 16.22.2.1. By Physical Form 16.22.2.2. By Time Application 16.22.2.3. By Crop Type 16.23. Israel 16.23.1. Pricing Analysis 16.23.2. Market Share Analysis, 2022 16.23.2.1. By Physical Form 16.23.2.2. By Time Application 16.23.2.3. By Crop Type 17. Market Structure Analysis 17.1. Competition Dashboard 17.2. Competition Benchmarking 17.3. Market Share Analysis of Top Players 17.3.1. By Regional 17.3.2. By Physical Form 17.3.3. By Time Application 17.3.4. By Crop Type 18. Competition Analysis 18.1. Competition Deep Dive 18.1.1. BASF SE 18.1.1.1. Overview 18.1.1.2. Product Portfolio 18.1.1.3. Profitability by Market Segments 18.1.1.4. Sales Footprint 18.1.1.5. Strategy Overview 18.1.1.5.1. Marketing Strategy 18.1.1.5.2. Product Strategy 18.1.1.5.3. Channel Strategy 18.1.2. Monsanto Co 18.1.2.1. Overview 18.1.2.2. Product Portfolio 18.1.2.3. Profitability by Market Segments 18.1.2.4. Sales Footprint 18.1.2.5. Strategy Overview 18.1.2.5.1. Marketing Strategy 18.1.2.5.2. Product Strategy 18.1.2.5.3. Channel Strategy 18.1.3. E I du Pont de Nemours & Company 18.1.3.1. Overview 18.1.3.2. Product Portfolio 18.1.3.3. Profitability by Market Segments 18.1.3.4. Sales Footprint 18.1.3.5. Strategy Overview 18.1.3.5.1. Marketing Strategy 18.1.3.5.2. Product Strategy 18.1.3.5.3. Channel Strategy 18.1.4. Bayer AG 18.1.4.1. Overview 18.1.4.2. Product Portfolio 18.1.4.3. Profitability by Market Segments 18.1.4.4. Sales Footprint 18.1.4.5. Strategy Overview 18.1.4.5.1. Marketing Strategy 18.1.4.5.2. Product Strategy 18.1.4.5.3. Channel Strategy 18.1.5. The Dow Chemical Company 18.1.5.1. Overview 18.1.5.2. Product Portfolio 18.1.5.3. Profitability by Market Segments 18.1.5.4. Sales Footprint 18.1.5.5. Strategy Overview 18.1.5.5.1. Marketing Strategy 18.1.5.5.2. Product Strategy 18.1.5.5.3. Channel Strategy 18.1.6. Syngenta AG 18.1.6.1. Overview 18.1.6.2. Product Portfolio 18.1.6.3. Profitability by Market Segments 18.1.6.4. Sales Footprint 18.1.6.5. Strategy Overview 18.1.6.5.1. Marketing Strategy 18.1.6.5.2. Product Strategy 18.1.6.5.3. Channel Strategy 18.1.7. Nufarm Limited 18.1.7.1. Overview 18.1.7.2. Product Portfolio 18.1.7.3. Profitability by Market Segments 18.1.7.4. Sales Footprint 18.1.7.5. Strategy Overview 18.1.7.5.1. Marketing Strategy 18.1.7.5.2. Product Strategy 18.1.7.5.3. Channel Strategy 19. Assumptions & Acronyms Used 20. Research Methodology
Explore Chemicals & Materials Insights
View Reports