The global dolomite market is anticipated to grow from USD 4.1 billion in 2025 to USD 6.2 billion by 2035, advancing at a CAGR of 4.2%. Demonstrating the accelerating adoption of high-purity dolomite formulations and advanced processing technology across steelmaking, construction, glass manufacturing, and environmental treatment sectors.
The first half of the decade (2025-2030) will witness the market climbing from USD 4.1 billion to approximately USD 5.0 billion, adding USD 900 million in value, which constitutes 43% of the total forecast growth period. This phase will be characterized by the steady adoption of calcined and sintered dolomite systems, driven by increasing steel production volumes and the growing need for construction aggregates and flux materials worldwide. Advanced mineral processing capabilities and automated grinding systems will become standard expectations rather than premium options.
The latter half (2030-2035) will witness steady growth from USD 5.0 billion to USD 6.2 billion, representing an addition of USD 1.2 billion or 57% of the decade's expansion. This period will be defined by mass market penetration of specialized dolomite grades, integration with comprehensive metallurgical platforms, and seamless compatibility with existing steelmaking infrastructure. The market trajectory signals fundamental shifts in how steel producers and construction firms approach flux optimization and aggregate quality management, with participants positioned to benefit from steady demand across multiple material types and application segments.
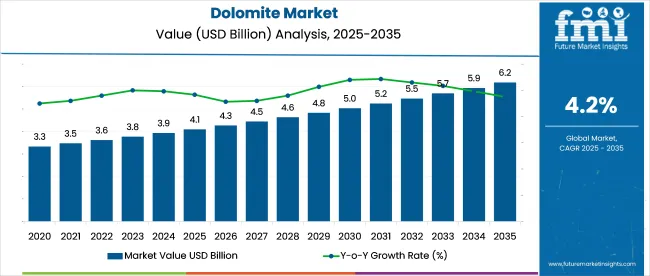
The Dolomite market demonstrates distinct growth phases with varying market characteristics and competitive dynamics. Between 2025 and 2030, the market progresses through its steady expansion phase, growing from USD 4.1 billion to USD 5.0 billion with consistent annual increments averaging 4.2% growth. This period showcases the transition from basic crushed dolomite to advanced calcined and sintered systems with enhanced flux properties and integrated quality control systems becoming mainstream features.
The 2025-2030 phase adds USD 900 million to market value, representing 43% of total decade expansion. Market maturation factors include standardization of steel production protocols, declining processing costs for specialized dolomite grades, and increasing industrial awareness of flux benefits reaching optimal metallurgical performance in steelmaking and refractory applications. Competitive landscape evolution during this period features established mineral companies like Lhoist and Imerys expanding their dolomite portfolios while specialty producers focus on high-purity formulation development and enhanced processing capabilities.
From 2030 to 2035, market dynamics shift toward advanced mineral processing and global infrastructure expansion, with growth continuing from USD 5.0 billion to USD 6.2 billion, adding USD 1.2 billion or 57% of total expansion. This phase transition centers on specialized dolomite grades, integration with automated steelmaking networks, and deployment across diverse industrial scenarios, becoming standard rather than specialized applications. The competitive environment matures with focus shifting from basic mineral capability to comprehensive metallurgical optimization systems and integration with production monitoring platforms.
| Metric | Value |
|---|---|
| Market Value (2025) | USD 4.1 billion |
| Market Forecast (2035) | USD 6.2 billion |
| Growth Rate | 4.2% CAGR |
| Leading Technology | Crushed & Ground Material Type |
| Primary Application | Mining & Metallurgy End Use Segment |
The market demonstrates strong fundamentals with crushed and ground dolomite systems capturing a dominant share through advanced mineral processing and industrial application optimization capabilities. Mining and metallurgy applications drive primary demand, supported by increasing steel production and construction infrastructure requirements. Geographic expansion remains concentrated in developed markets with established industrial infrastructure, while emerging economies show accelerating adoption rates driven by steelmaking expansion and rising construction standards.
Market expansion rests on three fundamental shifts driving adoption across the metallurgical and construction sectors. Steel production demand creates compelling operational advantages through dolomite flux materials that provide immediate slag conditioning efficiency without process delays, enabling steelmakers to meet quality standards while maintaining productivity and reducing operational costs. Construction infrastructure modernization accelerates as projects worldwide seek effective aggregate systems that complement traditional building materials, enabling precise filler applications and quality control that align with industry standards and structural requirements.
Environmental treatment enhancement drives adoption from water management facilities and industrial operators requiring effective pH adjustment solutions that minimize treatment costs while maintaining operational effectiveness during wastewater and flue gas processing operations. Growth faces headwinds from raw material availability challenges that vary across mining regions regarding the sourcing of high-purity dolomite deposits, which may limit adoption in quality-sensitive applications. Technical limitations also persist regarding impurity levels and calcination efficiency that may reduce effectiveness in specialized metallurgical environments, which affect flux performance and refractory consistency.
The dolomite market represents a foundational industrial mineral opportunity driven by expanding global steel production, infrastructure construction development, and the need for superior flux and aggregate performance in metallurgical and building applications. The market's growth trajectory from USD 4.1 billion in 2025 to USD 6.2 billion by 2035 at a 4.2% CAGR reflects fundamental shifts in steel manufacturing requirements and construction material optimization. Geographic expansion opportunities are particularly pronounced in Asia-Pacific markets, where the dominance of crushed and ground material types (55.0% market share) and mining and metallurgy applications (36.0% share) provides clear strategic focus areas.
Strengthening the dominant crushed and ground segment (55.0% market share) through enhanced mineral processing, superior particle size distribution, and seamless integration with industrial manufacturing infrastructure. This pathway focuses on optimizing grinding efficiency, improving product consistency, and developing specialized grades for diverse applications. Market leadership consolidation through advanced processing technology and comprehensive quality monitoring enables premium positioning while defending competitive advantages. Expected revenue pool: USD 350-550 million
Rapid industrial growth across India (5.3% CAGR) and China (4.6% CAGR) creates substantial expansion opportunities through local mining capabilities and technology partnerships. Growing steel production, infrastructure modernization, and government construction initiatives drive constant demand for dolomite systems. Localization strategies reduce transportation costs, enable faster supply, and position companies advantageously for industrial procurement programs. Expected revenue pool: USD 300-480 million
Expansion within the dominant mining and metallurgy segment (36.0% market share) through specialized formulations addressing steelmaking quality standards, high-volume production requirements, and comprehensive flux reliability for EAF and BOF applications. This pathway encompasses automated batching systems, quality control integration, and compatibility with diverse steel production processes, supporting modern metallurgical operations. Expected revenue pool: USD 280-440 million
Strategic expansion into construction applications (28.0% market share) requires enhanced durability, superior binding properties, and specialized grades addressing infrastructure operational requirements. This pathway addresses cement manufacturing, asphalt production, concrete fillers, and road base applications with advanced mineral processing for demanding construction conditions while creating opportunities for long-term supply agreements. Expected revenue pool: USD 240-380 million
Development of specialized processed dolomite forms, including calcined dolomite (18.0% share) and sintered dolomite (17.0% share), addressing specific refractory manufacturing requirements, metallurgical needs, and high-temperature demands. This pathway encompasses advanced thermal processing, environmentally optimized production, and specialized industrial applications. Technology differentiation through proprietary calcination methods enables diversified revenue streams. Expected revenue pool: USD 200-320 million
Expansion within the glass and ceramics segment (14.0% market share) through high-purity dolomite formulations, precision batching systems, and integration with flat glass and technical ceramics production platforms. This pathway encompasses automated dosing systems, quality monitoring integration, and extensive production optimization for specialty manufacturing enhancement. Expected revenue pool: USD 180-280 million
Development of environmentally superior dolomite grades addressing water treatment, flue gas desulfurization, and environmental compliance requirements across industrial applications. This pathway encompasses pH adjustment solutions, ecofriendly mining processes, regulatory compliance support, and comprehensive ecological documentation. Premium positioning reflects environmental leadership while enabling access to water treatment programs and sustainability-driven partnerships. Expected revenue pool: USD 150-240 million
Primary Classification: The market segments by end use into Mining & Metallurgy, Construction, Glass & Ceramics, Environmental & Water Treatment, Agrochemicals & Animal Feed, and Pharma & Healthcare categories, representing the evolution from basic industrial minerals to specialized applications for comprehensive manufacturing optimization.
Secondary Classification: Material type segmentation divides the market into Crushed & Ground, Calcined dolomite, Sintered dolomite, and Agglomerated categories, reflecting distinct requirements for mineral processing, thermal treatment, and industrial quality standards.
Tertiary Classification: Application segmentation covers Fluxing & Slag Conditioning, Construction Fillers & Aggregates, Refractories, Glass & Ceramics Batching, Environmental treatment, and Agriculture sectors, demonstrating varied adoption patterns across metallurgical, construction, and specialty manufacturing applications.
Regional Classification: Geographic distribution covers North America, Europe, Asia Pacific, Latin America, and the Middle East & Africa, with developed markets leading adoption while emerging economies show accelerating growth patterns driven by industrialization programs.
The segmentation structure reveals technology progression from standard crushed dolomite toward specialized calcined and sintered systems with enhanced thermal and chemical capabilities, while application diversity spans from steel production to environmental treatment requiring precise mineral solutions.
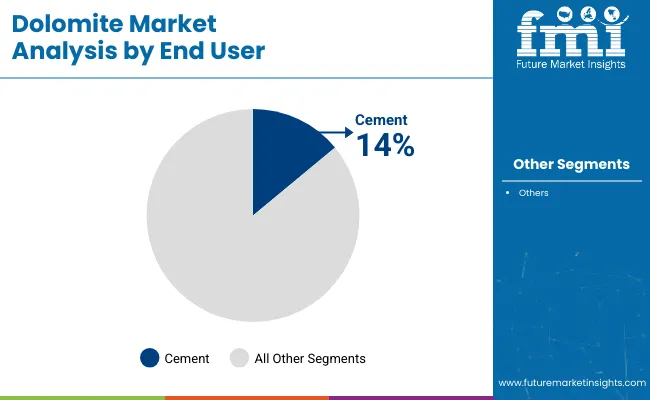
Market Position: Mining & Metallurgy applications command the leading position in the Dolomite market with approximately 36.0% market share through advanced flux properties, including superior slag conditioning, refractory performance capability, and metallurgical optimization that enable steel producers to achieve optimal process efficiency across diverse steelmaking and non-ferrous manufacturing environments.
Value Drivers: The segment benefits from steel manufacturer preference for reliable flux systems that provide consistent slag formation, reduced refractory wear, and production efficiency optimization without requiring significant process modifications. Advanced mineral features enable automated batching systems, chemistry consistency, and integration with existing steel production equipment, where flux performance and operational reliability represent critical requirements.
Competitive Advantages: Dolomite flux systems differentiate through proven metallurgical effectiveness, consistent mineral composition, and integration with automated steelmaking systems that enhance operational efficiency while maintaining optimal steel quality suitable for diverse automotive and construction applications.
Key market characteristics:
Market Context: Crushed & Ground dolomite forms dominate the Dolomite market with approximately 55.0% market share due to widespread adoption in industrial manufacturing and established compatibility with construction, metallurgical, and filler applications that enable efficient material processing across diverse end-use sectors.
Appeal Factors: Industrial manufacturers prioritize crushed and ground dolomite for cost-effectiveness, processing simplicity, and proven performance in commercial applications that enable coordinated supply across multiple production facilities. The segment benefits from substantial industrial investment and mature supply chains that prioritize crushed dolomite systems for high-volume production applications.
Growth Drivers: Steel production expansion incorporates crushed dolomite as standard flux material for metallurgical operations, while construction growth increases demand for reliable aggregate and filler solutions that comply with industry standards and minimize processing complexity.
Application dynamics include:
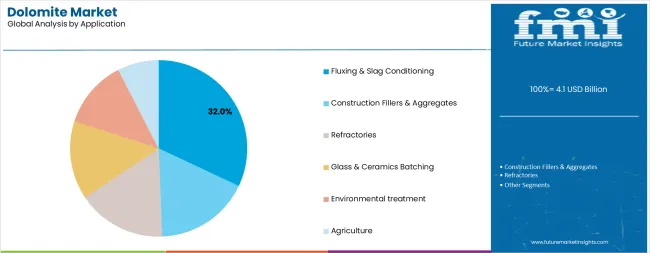
Market Context: Fluxing & Slag Conditioning applications dominate the Dolomite market with approximately 32.0% market share due to critical role in steelmaking processes and increasing focus on metallurgical efficiency optimization, slag quality management, and refractory protection applications that support modern steel production operations.
Appeal Factors: Steel manufacturers prioritize flux reliability, slag formation consistency, and integration with existing metallurgical infrastructure that enables coordinated material handling across multiple production lines. The segment benefits from substantial steel industry investment and modernization programs that prioritize flux systems for quality control and production efficiency applications.
Growth Drivers: Global steel capacity expansion programs incorporate dolomite flux as essential material for steelmaking operations, while metallurgical process optimization increases demand for proven flux solutions that comply with quality standards and minimize production defects.
Market Challenges: Varying steel production technologies and regional metallurgical practices may limit flux standardization across different facilities or operational scenarios.
Application dynamics include:
Construction Fillers & Aggregates applications capture approximately 24.0% market share through asphalt production, road base applications, and concrete filler requirements. These applications demand reliable mineral systems capable of operating in high-volume construction environments while providing effective binding and structural properties.
Refractories applications account for approximately 16.0% market share through basic brick manufacturing and furnace repair applications. Glass & Ceramics Batching represents 14.0% share, with Environmental treatment (8.0%) and Agriculture applications (6.0%) serving specialized industrial segments.
Growth Accelerators: Steel production expansion drives primary adoption as dolomite flux materials provide slag conditioning capabilities that enable steelmakers to meet metallurgical quality standards without excessive refractory consumption, supporting manufacturing operations and industrial missions that require precise flux applications. Construction infrastructure demand accelerates market expansion as building projects seek effective aggregate systems that minimize material costs while maintaining structural effectiveness during concrete production and road construction scenarios. Industrial mineral spending increases worldwide, creating steady demand for dolomite products that complement traditional manufacturing processes and provide operational flexibility in complex metallurgical environments.
Growth Inhibitors: Raw material quality challenges vary across mining operations regarding the availability of high-purity dolomite deposits and consistent mineral composition, which may limit operational flexibility and market penetration in regions with geological constraints or quality-sensitive industrial applications. Processing cost considerations persist regarding calcination energy requirements and grinding efficiency that may reduce competitiveness compared to alternative flux materials, affecting adoption in cost-sensitive steelmaking operations. Market fragmentation across multiple industrial specifications and regional standards creates compatibility concerns between different dolomite grades and existing manufacturing infrastructure.
Market Evolution Patterns: Adoption accelerates in steel production and construction sectors where performance requirements justify mineral costs, with geographic concentration in industrialized markets transitioning toward mainstream adoption in emerging economies driven by infrastructure development and steel capacity expansion. Technology development focuses on enhanced calcination processes, improved grinding efficiency, and integration with automated batching systems that optimize flux performance and operational effectiveness. The market could face disruption if alternative flux materials or synthetic substitutes significantly reduce reliance on natural dolomite in steelmaking or refractory applications. Environmental compliance enhancement enables emission reduction initiatives, green mining practices, and circular economy integration that optimize resource efficiency while supporting industrial operators' transition toward cleaner production and comprehensive environmental management platforms.
The market demonstrates varied regional dynamics with Growth Leaders including India (5.3% CAGR) driving expansion through infrastructure development and steel capacity expansion. High-Growth Markets encompass China (4.6% CAGR), the United States (4.5% CAGR), and Germany (4.4% CAGR), benefiting from established industrial bases and construction modernization. Steady Performers feature France (4.3% CAGR), Japan (4.3% CAGR), and the United Kingdom (4.2% CAGR), where specialized industrial applications and infrastructure maintenance support consistent growth patterns.
| Country | CAGR (2025-2035) |
|---|---|
| India | 5.3% |
| China | 4.6% |
| United States | 4.5% |
| Germany | 4.4% |
| France | 4.3% |
| Japan | 4.3% |
| United Kingdom | 4.2% |
Regional synthesis reveals Asia-Pacific markets leading adoption through infrastructure expansion and steel production growth, while European countries maintain steady expansion supported by industrial mineral quality standards and manufacturing optimization requirements. North American markets show moderate growth driven by construction applications and metallurgical technology integration trends.
India establishes the highest growth trajectory through aggressive infrastructure development programs and comprehensive steel production capacity expansion, integrating dolomite as essential material in metallurgical flux and construction aggregate installations. The country's 5.3% CAGR reflects government initiatives promoting domestic steel production and infrastructure development that mandate the use of quality mineral systems in steelmaking and construction projects. Growth concentrates in major industrial centers where steel manufacturing development showcases integrated dolomite supply chains that appeal to domestic producers seeking cost-effective flux and aggregate solutions.
Indian mineral producers are developing local mining capabilities that combine domestic resource advantages with growing industrial demand, including steel production expansion and construction material requirements. Distribution channels through steel industry suppliers and construction material distributors expand market access, while government support for infrastructure development supports adoption across diverse metallurgical and construction segments.
Strategic Market Indicators:
China's advanced steel manufacturing ecosystem demonstrates sophisticated dolomite deployment with documented operational effectiveness in flux applications and construction material production through integration with vertically integrated supply chains. The country leverages manufacturing scale to maintain a 4.6% CAGR. Industrial centers showcase extensive installations where dolomite systems integrate with comprehensive steel production platforms to optimize slag conditioning and metallurgical efficiency.
Chinese mineral producers prioritize production capacity and quality improvement in dolomite development, creating demand for low-impurity systems with proven flux characteristics. The market benefits from established steel manufacturing infrastructure and substantial investment in quality enhancement technologies that provide long-term operational benefits.
Market Intelligence Brief:
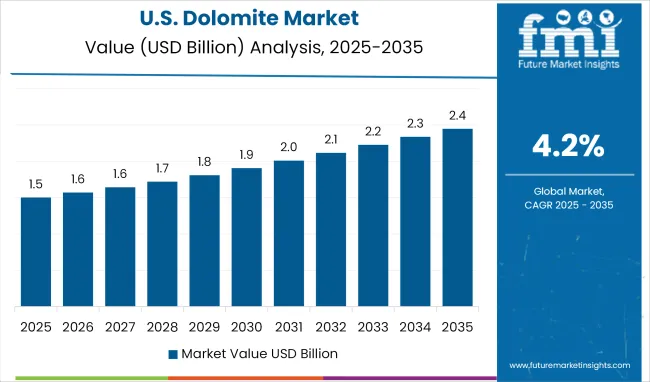
The USA market prioritizes construction applications and metallurgical quality, including dolomite flux systems and integration with comprehensive steel production platforms that manage slag conditioning, refractory maintenance, and cost optimization applications through unified material management. The country holds a 4.5% CAGR, driven by federal and state infrastructure investment and steel production modernization that support mineral system integration. American steel producers prioritize operational effectiveness with dolomite flux delivering consistent slag formation through proven mineral composition and quality standards.
Technology deployment channels include major steel contractors, construction material suppliers, and industrial procurement programs that support professional applications for complex metallurgical and infrastructure projects. Manufacturing quality standards focusing clean flux materials expand market appeal across diverse operational requirements seeking performance and reliability benefits.
Performance Metrics:
Germany's advanced industrial market demonstrates sophisticated dolomite deployment with documented operational effectiveness in steel production and glass manufacturing through integration with existing quality systems and production infrastructure. The country leverages engineering expertise in metallurgy and construction materials to maintain a 4.4% CAGR. Industrial centers showcase premium installations where dolomite systems integrate with comprehensive manufacturing platforms to optimize flux performance and product quality.
German mineral companies prioritize purity standards and EU compliance in dolomite development, creating demand for premium mineral systems with advanced features. The market benefits from established industrial infrastructure and a willingness to invest in high-quality materials that provide long-term operational benefits and compliance with international standards.
Market Intelligence Brief:
France's market expansion benefits from diverse industrial demand, including cement decarbonization initiatives and blended binder development, road maintenance programs, and government infrastructure projects that incorporate dolomite solutions for construction optimization applications. The country maintains a 4.3% CAGR, driven by rising construction activity and increasing awareness of mineral technology benefits for sustainable cement production.
Market dynamics focus on low-carbon cement solutions that balance construction performance with environmental considerations important to French infrastructure developers. Growing construction industrialization creates constant demand for quality mineral systems in new infrastructure projects.
Strategic Market Considerations:
Japan demonstrates steady market development with a 4.3% CAGR, distinguished by steel manufacturers' preference for high-specification dolomite systems that integrate seamlessly with existing metallurgical systems and provide reliable long-term performance in specialized steel and ceramics applications. The market prioritizes advanced features, including precision mineral composition, low impurity levels, and integration with comprehensive quality platforms that reflect Japanese industrial expectations for technological sophistication and operational excellence.
In Birmingham, Manchester, and other industrial centers, British construction firms and infrastructure operators are implementing dolomite systems to enhance building performance capabilities and support retrofit programs that align with UK environmental regulations and circular economy standards. The UK market holds a 4.2% CAGR, driven by infrastructure modernization programs and construction equipment upgrades that prioritize ecofriendly mineral systems for building and road applications. British construction operators are prioritizing dolomite products that provide consistent performance while maintaining compliance with environmental regulations and focusing recycled material integration, particularly important in urban renovation and infrastructure maintenance projects.
Market expansion benefits from government infrastructure investment and environmental compliance programs that support mineral adoption across the UK's construction and water treatment sectors, where operational flexibility and quality represent critical requirements.
Strategic Market Indicators:
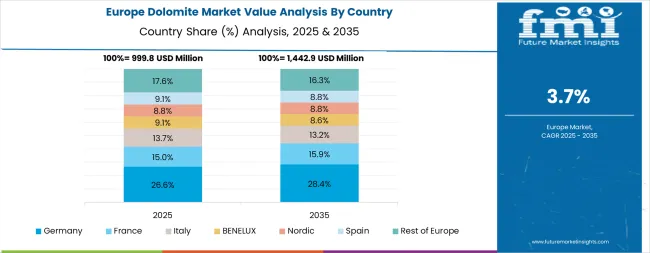
Europe accounts for an estimated 29.0% of global dolomite revenues in 2025, led by Germany, Italy, France, the United Kingdom, and Spain. Demand is anchored in steel and non-ferrous metallurgy through flux and refractory use across Germany and Italy, cement, asphalt, and engineered aggregates in France and Spain, and environmental water treatment and construction refurbishment in the UK. EU regulatory pressure on cleaner materials and traceable sourcing, including REACH compliance and circular economy targets, sustains a premium for high-purity, low-contaminant dolomite. Glass and ceramics clusters in Germany and Italy, plus coastal infrastructure and road base programs in Spain, round out the regional pull, while continuous kiln efficiency upgrades and lower-carbon dolime initiatives support steady capacity utilization.
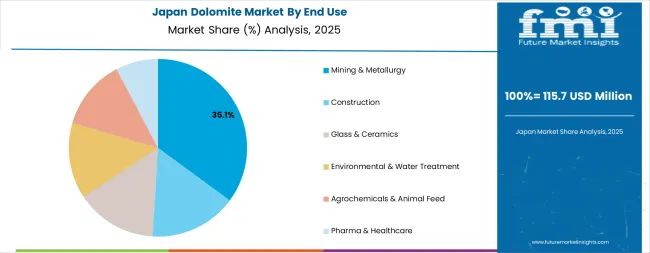
In Japan, the Dolomite market prioritizes crushed and ground material forms, which capture the dominant share of industrial installations due to their proven features, including cost-effective processing and seamless integration with existing steel manufacturing and construction infrastructure. Japanese industrial operators prioritize reliability, quality consistency, and long-term supply security, creating demand for crushed dolomite systems that provide stable mineral composition and adaptive application performance based on manufacturing requirements. Calcined and sintered dolomite types maintain secondary positions primarily in specialized refractory applications and high-temperature industrial processes where advanced thermal properties meet operational requirements without compromising production efficiency.
Market Characteristics:
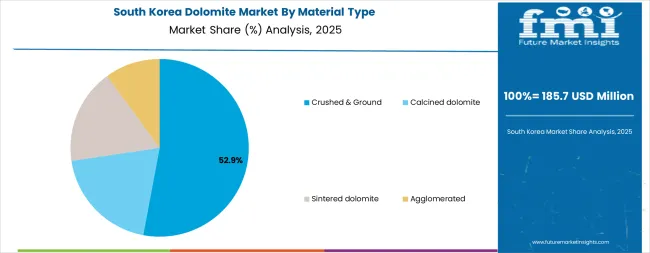
In South Korea, the market structure favors international mineral companies, including Lhoist, Imerys, and regional producers, which maintain positions through comprehensive product portfolios and established industrial networks supporting both steel manufacturing and construction installations. These providers offer integrated solutions combining quality dolomite grades with technical support services and ongoing supply reliability that appeal to Korean manufacturers seeking dependable mineral systems. Local mining operators capture market share by providing localized supply capabilities and competitive pricing for standard industrial applications, while domestic producers focus on specialized grades tailored to Korean steel industry characteristics.
Channel Insights:
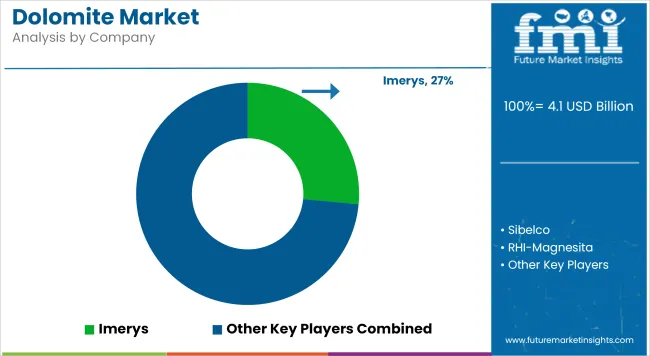
The market operates with moderate concentration, featuring approximately 15-20 meaningful participants, where leading companies control roughly 35-40% of the global market share through established industrial relationships and comprehensive mineral portfolios. Lhoist holds the leading position with approximately 9.0% market share through extensive mining operations, global industrial networks, and comprehensive quality management capabilities. Competition prioritizes product quality, supply reliability, and mineral consistency rather than price-based rivalry.
Market Leaders encompass Lhoist, Imerys, and Sibelco, which maintain competitive advantages through extensive mineral reserves, global steel industry partnerships, and comprehensive logistics capabilities that create customer relationships and support stable pricing. These companies leverage decades of mining experience and ongoing processing investments to develop consistent dolomite grades with reliable mineral composition and quality features.
Technology Innovators include RHI-Magnesita, Calcinor SA, and Carmeuse, which compete through specialized processing technology focus and innovative calcination development that appeal to steel manufacturers seeking advanced flux capabilities and refractory performance. These companies differentiate through thermal processing expertise and specialized metallurgical application focus.
Regional Specialists feature companies like Omya AG, JFE Minerals, Vardar Dolomite, and Essel Mining & Industries, which focus on specific geographic markets and specialized applications, including high-purity systems and environmental treatment programs. Market dynamics favor participants that combine reliable mineral quality with efficient logistics, including consistent supply and technical support capabilities. Competitive pressure intensifies as established mineral companies expand capacity while specialized producers challenge incumbents through processing innovation and cost-effective solutions targeting high-growth steel and construction segments.
| Item | Value |
|---|---|
| Quantitative Units | USD 4.1 billion |
| End Use | Mining & Metallurgy, Construction, Glass & Ceramics, Environmental & Water Treatment, Agrochemicals & Animal Feed, Pharma & Healthcare |
| Material Type | Crushed & Ground, Calcined dolomite, Sintered dolomite, Agglomerated |
| Application | Fluxing & Slag Conditioning, Construction Fillers & Aggregates, Refractories, Glass & Ceramics Batching, Environmental treatment, Agriculture |
| Regions Covered | North America, Europe, Asia Pacific, Latin America, Middle East & Africa |
| Countries Covered | China, India, the USA, Germany, France, Japan, the UK, and 25+ additional countries |
| Key Companies Profiled | Lhoist, Imerys, Sibelco, RHI-Magnesita, Calcinor SA, Carmeuse, Omya AG, JFE Minerals Co., Vardar Dolomite |
| Additional Attributes | Dollar sales by end use, material type, and application categories, regional adoption trends across North America, Europe, and Asia-Pacific, competitive landscape with mineral producers and industrial suppliers, steel manufacturer preferences for flux consistency and supply reliability, integration with metallurgical production platforms and quality monitoring systems, innovations in low-carbon calcination and environmental treatment applications, and development of automated processing solutions with enhanced mineral quality and industrial optimization capabilities. |
The global dolomite market is estimated to be valued at USD 4.1 billion in 2025.
The market size for the dolomite market is projected to reach USD 6.2 billion by 2035.
The dolomite market is expected to grow at a 4.2% CAGR between 2025 and 2035.
The key product types in dolomite market are mining & metallurgy, construction, glass & ceramics, environmental & water treatment, agrochemicals & animal feed and pharma & healthcare.
In terms of material type, crushed & ground segment to command 55.0% share in the dolomite market in 2025.


Full Research Suite comprises of:
Market outlook & trends analysis
Interviews & case studies
Strategic recommendations
Vendor profiles & capabilities analysis
5-year forecasts
8 regions and 60+ country-level data splits
Market segment data splits
12 months of continuous data updates
DELIVERED AS:
PDF EXCEL ONLINE
Demand for Dolomite in EU Size and Share Forecast Outlook 2025 to 2035

Thank you!
You will receive an email from our Business Development Manager. Please be sure to check your SPAM/JUNK folder too.
Chat With
MaRIA