Drawplate Market Size and Share Forecast Outlook 2025 to 2035

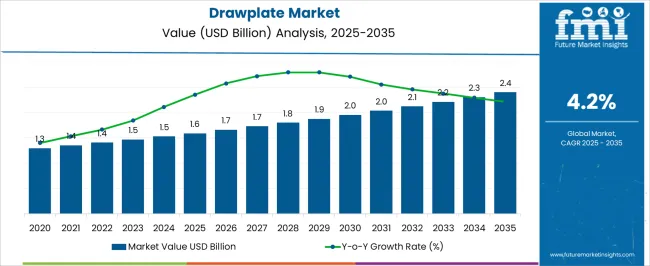
The Drawplate Market is estimated to be valued at USD 1.6 billion in 2025 and is projected to reach USD 2.4 billion by 2035, registering a compound annual growth rate (CAGR) of 4.2% over the forecast period.
Quick Stats for Drawplate Market

  • Drawplate Market Industry Value (2025): USD 1.6 billion
  • Drawplate Market Forecast Value (2035): USD 2.4 billion
  • Drawplate Market Forecast CAGR: 4.2%
  • Leading Segment in Drawplate Market in 2025: Steel Drawplates (63.5%)
  • Key Growth Region in Drawplate Market: North America, Asia-Pacific, Europe
  • Top Key Players in Drawplate Market: Hajet Industry Co Ltd, Ishor Internationals, Otto Frei, Green Stars SA Pvt Ltd, Pepetools, Hammerman, Sunrise Tools India, Rio Grande, Beadsmith, Contenti

Drawplate Market Market Value Analysis

Metric Value
Drawplate Market Estimated Value in (2025 E) USD 1.6 billion
Drawplate Market Forecast Value in (2035 F) USD 2.4 billion
Forecast CAGR (2025 to 2035) 4.2%

Rationale for Segmental Growth in the Drawplate Market

The drawplate market is expanding steadily, influenced by rising demand in precision metalworking and jewelry manufacturing industries. Industry publications and product updates have highlighted growing use of drawplates for wire shaping and material reduction in both artisanal and industrial applications.

Steel and tungsten-carbide variants have gained prominence for their durability and ability to withstand repeated use, aligning with industry needs for efficiency and longevity. Additionally, technological advancements in manufacturing have led to more precise hole sizing and smoother finishes, improving product quality and productivity.

The growth of the jewelry sector, particularly in emerging markets, has provided a strong demand base, while broader adoption in crafts, instrument making, and specialized industrial uses has diversified application areas. Looking ahead, increased investments in advanced tooling, rising global demand for handmade jewelry, and consumer interest in fine craftsmanship are expected to sustain growth. Segmental strength is projected to be led by Steel Drawplates, Medium Drawplates, and Jewelry Making due to their versatility, cost efficiency, and widespread adoption in skilled trades.
Segmental Analysis

Insights into the Material Type Segment: Steel Drawplates

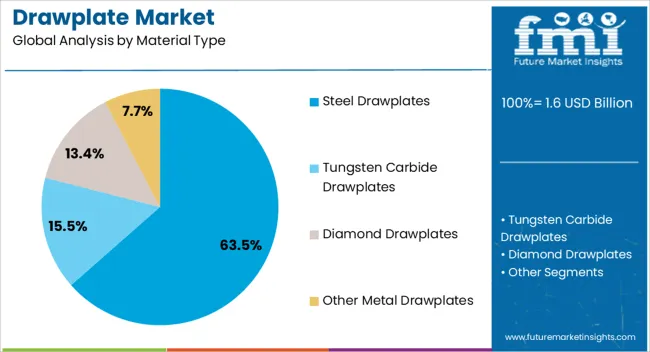
Drawplate Market Analysis By Material Type

The Steel Drawplates segment is projected to contribute 63.5% of the drawplate market revenue in 2025, maintaining its leading position due to its durability, cost-effectiveness, and broad usability. Steel drawplates have been favored for their ability to handle repeated wire drawing while maintaining structural integrity.

Manufacturers have emphasized their affordability compared to carbide alternatives, making them accessible for both professional jewelers and hobbyists. Their adaptability across various metals, including gold, silver, and copper, has strengthened their dominance in jewelry production.

Additionally, consistent performance and long service life have been reported as key factors supporting their widespread adoption. With rising demand for precision tools in jewelry and craft sectors, steel drawplates are expected to retain a significant share of the market, supported by manufacturing advancements and availability across global markets.
Insights into the Size Segment: Medium Drawplates

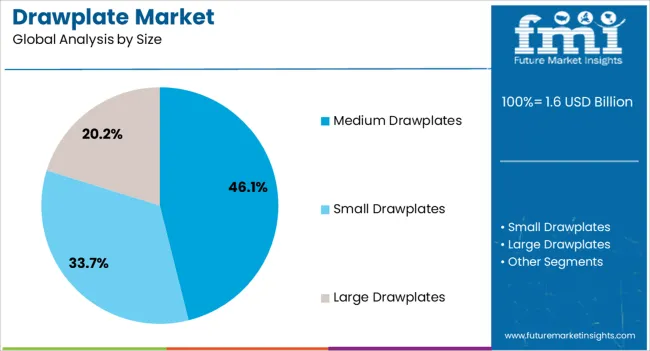
Drawplate Market Analysis By Size

The Medium Drawplates segment is anticipated to account for 46.1% of the drawplate market revenue in 2025, leading the size category. This preference has been shaped by the segment’s versatility in handling a wide range of wire diameters used in jewelry and craft applications.

Medium-sized drawplates offer a balance between fine detailing and efficient material reduction, making them suitable for both small-scale artisans and professional workshops. Reports from jewelry associations have highlighted medium drawplates as a staple tool for wire resizing, chain making, and bead crafting.

Their practicality and compatibility with multiple metals have enhanced their popularity across different user groups. As consumer demand for handcrafted jewelry continues to rise, the medium drawplates segment is expected to sustain its leadership by catering to both precision-focused and volume-driven production requirements.
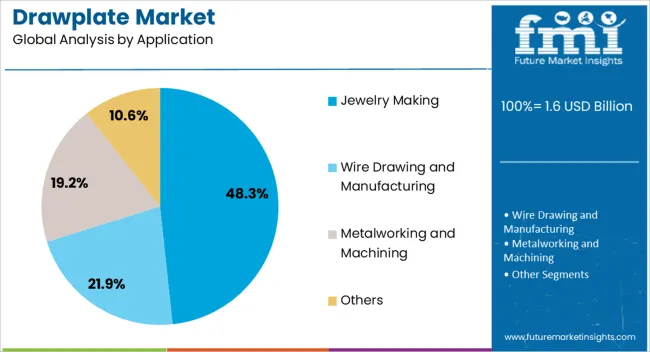
Insights into the Application Segment: Jewelry Making

Drawplate Market Analysis By Application

The Jewelry Making segment is projected to capture 48.3% of the drawplate market revenue in 2025, securing its role as the primary application. This dominance has been driven by the expanding global jewelry market, where drawplates are indispensable for creating uniform wires, chains, and intricate designs.

Artisan workshops and commercial jewelry manufacturers alike rely on drawplates for shaping precious metals with high accuracy. Industry publications have noted that growth in personalized and handcrafted jewelry trends has significantly increased the use of drawplates.

Moreover, the rising popularity of traditional metalworking techniques has reinforced their importance in modern jewelry production. With expanding consumer demand for high-quality, custom-designed pieces and increasing jewelry exports from emerging economies, the Jewelry Making segment is expected to maintain strong momentum, anchoring its leadership in the overall market.

Trends and Restraints Impacting the Drawplate Market

A popular use of drawplates is in the manufacture of jewelry. The jewelry sector continues to thrive as not only are they seen as significant ornaments but also as good investment opportunities. A notable trend in the jewelry industry is the popularity of novelty items.

The instrument is being used to mold the jewelry into these novel shapes as well as facilitate the reworking procedure. Manufacturers are also fine-tuning the instrument to ensure there is no loss of the precious items in working, thereby increasing the trust of the end users in the product.

While the instrument traditionally comes in metal form, wood is also being increasingly used as the base. Wood is more lightweight than metal, and thus, wood versions of the product are seeing greater demand among residential consumers. Rosewood is especially drawing greater attention as a base material for the product.

Drawplates are not the only way through which wire can be thinned. Traditional ways of manipulating wire and metals, such as hammers and tongs, serve to thin the growth potential of the instrument. In small industrial settings, these traditional methods are still used to manipulate wires and jewelry. The potential of the product to give subpar results if not properly maintained, such as producing burrs in wires, also makes end users wary about the product.

Category-wise Outlook in the Drawplate Industry

Steel drawplates take up the majority of the share in the material type segment. Jewelry making is the foremost purpose for the use of the instrument.

Effectiveness of Steel Drawplates Help Them Conquer the Material Type Segment

Steel versions of the product are predicted to take up 63.5% of the industry share in 2025.

Steel, including stainless steel, is renowned for its effectiveness. Steel versions of the product are preferred because they minimize or eliminate residue in wires and jewelry manipulation. The availability of these products in various shapes, such as round, oval, and square, also helps steel to conquer the material type segment.

Attributes Details
Top Material Type Steel
Industry Share (2025) 63.5%

Clamor for Designer Jewelry Makes Drawplates Necessary in Jewelry making

Drawplate’s use in jewelry making is anticipated to amount to 48.3% of the industry share in 2025.

Trends of novelty and designer jewelry make clear the use of the instrument in the jewelry sector. The product helps jewelers to fashion thinner pieces of jewelry to suit the needs of different-sized necks, ears, and other body parts. In addition, the instruments made specifically for jewelry contain aesthetic shapes like stars and crescent moons. Jewelry making is one of the bastions of the product, and its use in that sector continues to thrive.

Attributes Details
Top Application Jewelry Making
Industry Share (2025) 48.3%

Country-wise Analysis of Drawplate Market Adoption and Demand

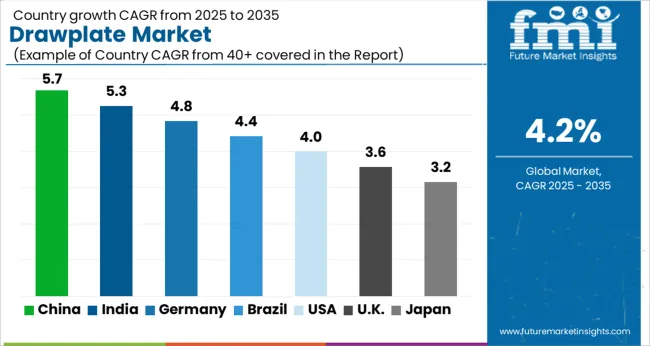
Drawplate Market Cagr Analysis By Country

The gigantic jewelry industries of Asia Pacific countries make sure of the market’s progress in the region. The pliable conditions for manufacturing make Europe a promising region for the industry. The easy availability of the product through online means makes North America a promising region.

India’s Flourishing Jewelry Sector Creates Conducive Environment for the Industry

The CAGR of the market for the forecast period in India is anticipated to be 4.5%.

In terms of jewelry revenue, India is said to be the second largest country in the world, hot on the trails of China. With both giants and small independent jewelers having scope to flourish in the country, the instrument is undergoing a period of solid growth in demand. With designer jewelry trends on the rise, especially in India’s vibrant wedding scene, the product is called upon more often by jewelers.

Presence of Significant Wiring Brands Helps the French Sector to Grow

In France, the industry is supposed to advance at a CAGR of 4.1%, making it one of the fastest countries in Europe for the product. The presence of several wire-working companies helps the demand for the instrument. Nexans is a prominent name among them. The company is said to be in the top five when it comes to wire-making countries globally. Thus, the conditions are right for the sector to grow in France.

The United States Wire Producing Capabilities Provide Pathway for Market Growth

The United States is set to see the sector expand at a consistent progression, with a CAGR of 3.1% over the projected period. The United States wiring industry is immense. The country is claimed to be the second biggest exporter of insulated wires worldwide. Thus, the enormity of the wiring sector in the country provides a stellar environment for the industry’s growth. The presence of prominent wiring companies like United States Southwire and General Cable also aids in growth.

Jewelry Manufacturers Focusing on Expansion Suits the Market in Spain

The Spanish industry is set to see expansion at a CAGR of 3.9%. Considering the clamor for jewelry among the Spanish population, manufacturers in the nation are focused on expansion on all fronts. Thus, they are focused both on geographical expansion as well as coming up with innovative jewelry.

The focus on innovative jewelry helps the product to proliferate further into the Spanish space. Meanwhile, the opening up of new facilities of manufacture helps the product’s demand to keep on moving.

For example, in 2025, prominent Spanish jewelry manufacturers Facet Barcelona opened a new production facility in Cordoba. Housing gemologists, polishers, and other industry experts, these facilities facilitate the increased adoption of the instrument.

The United Kingdom’s Emphasis on Plastic Production Helps Drawplate Market Prospects

The United Kingdom is set to see market growth happen at a CAGR of 3.5% over the coming decade.

The significant influence of celebrity culture and social media on the people of the country is seeing jewelry become an even more attractive proposition. With the millennial population increasingly fascinated by the fashion choices of celebrities as well as the royal family, the jewelry sector is growing in the country. This is acting as a boon for the United States drawplate market.
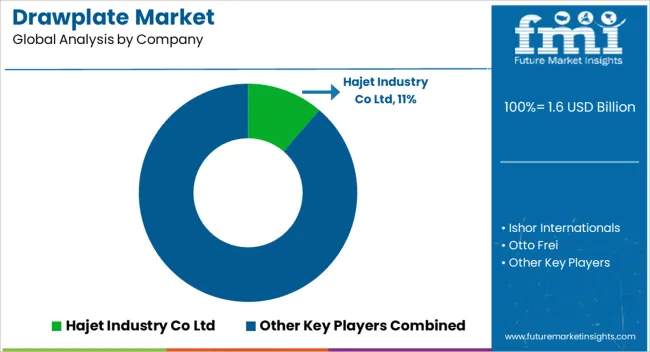
Competitive Landscape in the Global Drawplate Market

Drawplate Market Analysis By Company

The manufacture of the product is widespread, with no big companies having the upper hand. Consumers often seek trusted local brands in their search for the product.

One of the prominent players in the sector, Hajet Industry Co Ltd., is renowned for its tungsten carbide versions of the product. Another prominent player, Otto Frie, concentrates on providing traditional versions of the product with high quality but has also diversified into providing rosewood-made products. Another player, Green Stars SA Pvt. Ltd., is an Indian company, one of the notable ones in the country. The company prides itself on both its manufacturing and exporting business related to jewelry tools.

Recent Developments

In August 2025, it was announced that United States-based Pepetools had entered into a partnership with United Kingdom-based Armitage Tools. Through the collaboration, the jewelry equipment material of the American brand, including drawplates, would be distributed by the latter in the United Kingdom and the European Union.

Key Companies Leading the Drawplate Industry

  • Hajet Industry Co Ltd.
  • Ishor Internationals
  • Otto Frei, Green Stars SA Pvt. Ltd.
  • Pepetools, Hammerman
  • Sunrise Tools India
  • Rio Grande
  • Beadsmith
  • Contenti

Segmentation of the Drawplate Market by Product Type, Application, and Region

By Application:

Based on application, the drawplate market can be segmented into the following segments: jewelry making, wire drawing and manufacturing, metalworking and machining, and others.

By Size:

Based on size, the drawplate market can be segmented into the following segments: small drawplates, large drawplates, and medium drawplates.

By Material Type:

Based on material type, the drawplate market can be segmented into the following segments: steel drawplates, tungsten carbide drawplates, diamond drawplates, and other metal drawplates.

By Region:

The sector has been analyzed with the following regions covered: North America, Latin America, Europe, South Asia, East Asia, Oceania, and the Middle East and Africa.

Frequently Asked Questions

How big is the drawplate market in 2025?

The global drawplate market is estimated to be valued at USD 1.6 billion in 2025.

What will be the size of drawplate market in 2035?

The market size for the drawplate market is projected to reach USD 2.4 billion by 2035.

How much will be the drawplate market growth between 2025 and 2035?

The drawplate market is expected to grow at a 4.2% CAGR between 2025 and 2035.

What are the key product types in the drawplate market?

The key product types in drawplate market are steel drawplates, tungsten carbide drawplates, diamond drawplates and other metal drawplates.

Which size segment to contribute significant share in the drawplate market in 2025?

In terms of size, medium drawplates segment to command 46.1% share in the drawplate market in 2025.

Table of Content

  • Figure 1: Global Market Pricing Analysis
  • Figure 2: Global Market Value (USD Million) Forecast 2020 to 2035
  • Figure 3: Global Market Value Share and BPS Analysis by Application , 2025 and 2035
  • Figure 4: Global Market Y-o-Y Growth Comparison by Application , 2025 to 2035
  • Figure 5: Global Market Attractiveness Analysis by Application
  • Figure 6: Global Market Value Share and BPS Analysis by Energy Source, 2025 and 2035
  • Figure 7: Global Market Y-o-Y Growth Comparison by Energy Source, 2025 to 2035
  • Figure 8: Global Market Attractiveness Analysis by Energy Source
  • Figure 9: Global Market Value (USD Million) Share and BPS Analysis by Region, 2025 and 2035
  • Figure 10: Global Market Y-o-Y Growth Comparison by Region, 2025 to 2035
  • Figure 11: Global Market Attractiveness Analysis by Region
  • Figure 12: North America Market Incremental Dollar Opportunity, 2025 to 2035
  • Figure 13: Latin America Market Incremental Dollar Opportunity, 2025 to 2035
  • Figure 14: Western Europe Market Incremental Dollar Opportunity, 2025 to 2035
  • Figure 15: Eastern Europe Market Incremental Dollar Opportunity, 2025 to 2035
  • Figure 16: East Asia Market Incremental Dollar Opportunity, 2025 to 2035
  • Figure 17: South Asia and Pacific Market Incremental Dollar Opportunity, 2025 to 2035
  • Figure 18: Middle East & Africa Market Incremental Dollar Opportunity, 2025 to 2035
  • Figure 19: North America Market Value Share and BPS Analysis by Country, 2025 and 2035
  • Figure 20: North America Market Value Share and BPS Analysis by Application , 2025 and 2035
  • Figure 21: North America Market Y-o-Y Growth Comparison by Application , 2025 to 2035
  • Figure 22: North America Market Attractiveness Analysis by Application
  • Figure 23: North America Market Value Share and BPS Analysis by Energy Source, 2025 and 2035
  • Figure 24: North America Market Y-o-Y Growth Comparison by Energy Source, 2025 to 2035
  • Figure 25: North America Market Attractiveness Analysis by Energy Source
  • Figure 26: Latin America Market Value Share and BPS Analysis by Country, 2025 and 2035
  • Figure 27: Latin America Market Value Share and BPS Analysis by Application , 2025 and 2035
  • Figure 28: Latin America Market Y-o-Y Growth Comparison by Application , 2025 to 2035
  • Figure 29: Latin America Market Attractiveness Analysis by Application
  • Figure 30: Latin America Market Value Share and BPS Analysis by Energy Source, 2025 and 2035
  • Figure 31: Latin America Market Y-o-Y Growth Comparison by Energy Source, 2025 to 2035
  • Figure 32: Latin America Market Attractiveness Analysis by Energy Source
  • Figure 33: Western Europe Market Value Share and BPS Analysis by Country, 2025 and 2035
  • Figure 34: Western Europe Market Value Share and BPS Analysis by Application , 2025 and 2035
  • Figure 35: Western Europe Market Y-o-Y Growth Comparison by Application , 2025 to 2035
  • Figure 36: Western Europe Market Attractiveness Analysis by Application
  • Figure 37: Western Europe Market Value Share and BPS Analysis by Energy Source, 2025 and 2035
  • Figure 38: Western Europe Market Y-o-Y Growth Comparison by Energy Source, 2025 to 2035
  • Figure 39: Western Europe Market Attractiveness Analysis by Energy Source
  • Figure 40: Eastern Europe Market Value Share and BPS Analysis by Country, 2025 and 2035
  • Figure 41: Eastern Europe Market Value Share and BPS Analysis by Application , 2025 and 2035
  • Figure 42: Eastern Europe Market Y-o-Y Growth Comparison by Application , 2025 to 2035
  • Figure 43: Eastern Europe Market Attractiveness Analysis by Application
  • Figure 44: Eastern Europe Market Value Share and BPS Analysis by Energy Source, 2025 and 2035
  • Figure 45: Eastern Europe Market Y-o-Y Growth Comparison by Energy Source, 2025 to 2035
  • Figure 46: Eastern Europe Market Attractiveness Analysis by Energy Source
  • Figure 47: East Asia Market Value Share and BPS Analysis by Country, 2025 and 2035
  • Figure 48: East Asia Market Value Share and BPS Analysis by Application , 2025 and 2035
  • Figure 49: East Asia Market Y-o-Y Growth Comparison by Application , 2025 to 2035
  • Figure 50: East Asia Market Attractiveness Analysis by Application
  • Figure 51: East Asia Market Value Share and BPS Analysis by Energy Source, 2025 and 2035
  • Figure 52: East Asia Market Y-o-Y Growth Comparison by Energy Source, 2025 to 2035
  • Figure 53: East Asia Market Attractiveness Analysis by Energy Source
  • Figure 54: South Asia and Pacific Market Value Share and BPS Analysis by Country, 2025 and 2035
  • Figure 55: South Asia and Pacific Market Value Share and BPS Analysis by Application , 2025 and 2035
  • Figure 56: South Asia and Pacific Market Y-o-Y Growth Comparison by Application , 2025 to 2035
  • Figure 57: South Asia and Pacific Market Attractiveness Analysis by Application
  • Figure 58: South Asia and Pacific Market Value Share and BPS Analysis by Energy Source, 2025 and 2035
  • Figure 59: South Asia and Pacific Market Y-o-Y Growth Comparison by Energy Source, 2025 to 2035
  • Figure 60: South Asia and Pacific Market Attractiveness Analysis by Energy Source
  • Figure 61: Middle East & Africa Market Value Share and BPS Analysis by Country, 2025 and 2035
  • Figure 62: Middle East & Africa Market Value Share and BPS Analysis by Application , 2025 and 2035
  • Figure 63: Middle East & Africa Market Y-o-Y Growth Comparison by Application , 2025 to 2035
  • Figure 64: Middle East & Africa Market Attractiveness Analysis by Application
  • Figure 65: Middle East & Africa Market Value Share and BPS Analysis by Energy Source, 2025 and 2035
  • Figure 66: Middle East & Africa Market Y-o-Y Growth Comparison by Energy Source, 2025 to 2035
  • Figure 67: Middle East & Africa Market Attractiveness Analysis by Energy Source
  • Figure 68: Global Market – Tier Structure Analysis
  • Figure 69: Global Market – Company Share Analysis
  1. Executive Summary
    • Global Market Outlook
    • Demand-side Trends
    • Supply-side Trends
    • Technology Roadmap Analysis
    • Analysis and Recommendations
  2. Market Overview
    • Market Coverage / Taxonomy
    • Market Definition / Scope / Limitations
  3. Market Background
    • Market Dynamics
      • Drivers
      • Restraints
      • Opportunity
      • Trends
    • Scenario Forecast
      • Demand in Optimistic Scenario
      • Demand in Likely Scenario
      • Demand in Conservative Scenario
    • Opportunity Map Analysis
    • Product Life Cycle Analysis
    • Supply Chain Analysis
    • Investment Feasibility Matrix
    • Value Chain Analysis
    • PESTLE and Porter’s Analysis
    • Regulatory Landscape
    • Regional Parent Market Outlook
    • Production and Consumption Statistics
    • Import and Export Statistics
  4. Global Market Analysis 2020 to 2024 and Forecast, 2025 to 2035
    • Historical Market Size Value (USD Million) Analysis, 2020 to 2024
    • Current and Future Market Size Value (USD Million) Projections, 2025 to 2035
      • Y-o-Y Growth Trend Analysis
      • Absolute $ Opportunity Analysis
  5. Global Market Pricing Analysis 2020 to 2024 and Forecast 2025 to 2035
  6. Global Market Analysis 2020 to 2024 and Forecast 2025 to 2035, By Material Type
    • Introduction / Key Findings
    • Historical Market Size Value (USD Million) Analysis By Material Type , 2020 to 2024
    • Current and Future Market Size Value (USD Million) Analysis and Forecast By Material Type , 2025 to 2035
      • Steel Drawplates
      • Tungsten Carbide Drawplates
      • Diamond Drawplates
      • Other Metal Drawplates
    • Y-o-Y Growth Trend Analysis By Material Type , 2020 to 2024
    • Absolute $ Opportunity Analysis By Material Type , 2025 to 2035
  7. Global Market Analysis 2020 to 2024 and Forecast 2025 to 2035, By Size
    • Introduction / Key Findings
    • Historical Market Size Value (USD Million) Analysis By Size, 2020 to 2024
    • Current and Future Market Size Value (USD Million) Analysis and Forecast By Size, 2025 to 2035
      • Medium Drawplates
      • Small Drawplates
      • Large Drawplates
    • Y-o-Y Growth Trend Analysis By Size, 2020 to 2024
    • Absolute $ Opportunity Analysis By Size, 2025 to 2035
  8. Global Market Analysis 2020 to 2024 and Forecast 2025 to 2035, By Application
    • Introduction / Key Findings
    • Historical Market Size Value (USD Million) Analysis By Application, 2020 to 2024
    • Current and Future Market Size Value (USD Million) Analysis and Forecast By Application, 2025 to 2035
      • Jewelry Making
      • Wire Drawing and Manufacturing
      • Metalworking and Machining
      • Others
    • Y-o-Y Growth Trend Analysis By Application, 2020 to 2024
    • Absolute $ Opportunity Analysis By Application, 2025 to 2035
  9. Global Market Analysis 2020 to 2024 and Forecast 2025 to 2035, By Region
    • Introduction
    • Historical Market Size Value (USD Million) Analysis By Region, 2020 to 2024
    • Current Market Size Value (USD Million) Analysis and Forecast By Region, 2025 to 2035
      • North America
      • Latin America
      • Western Europe
      • Eastern Europe
      • East Asia
      • South Asia and Pacific
      • Middle East & Africa
    • Market Attractiveness Analysis By Region
  10. North America Market Analysis 2020 to 2024 and Forecast 2025 to 2035, By Country
    • Historical Market Size Value (USD Million) Trend Analysis By Market Taxonomy, 2020 to 2024
    • Market Size Value (USD Million) Forecast By Market Taxonomy, 2025 to 2035
      • By Country
        • USA
        • Canada
        • Mexico
      • By Material Type
      • By Size
      • By Application
    • Market Attractiveness Analysis
      • By Country
      • By Material Type
      • By Size
      • By Application
    • Key Takeaways
  11. Latin America Market Analysis 2020 to 2024 and Forecast 2025 to 2035, By Country
    • Historical Market Size Value (USD Million) Trend Analysis By Market Taxonomy, 2020 to 2024
    • Market Size Value (USD Million) Forecast By Market Taxonomy, 2025 to 2035
      • By Country
        • Brazil
        • Chile
        • Rest of Latin America
      • By Material Type
      • By Size
      • By Application
    • Market Attractiveness Analysis
      • By Country
      • By Material Type
      • By Size
      • By Application
    • Key Takeaways
  12. Western Europe Market Analysis 2020 to 2024 and Forecast 2025 to 2035, By Country
    • Historical Market Size Value (USD Million) Trend Analysis By Market Taxonomy, 2020 to 2024
    • Market Size Value (USD Million) Forecast By Market Taxonomy, 2025 to 2035
      • By Country
        • Germany
        • UK
        • Italy
        • Spain
        • France
        • Nordic
        • BENELUX
        • Rest of Western Europe
      • By Material Type
      • By Size
      • By Application
    • Market Attractiveness Analysis
      • By Country
      • By Material Type
      • By Size
      • By Application
    • Key Takeaways
  13. Eastern Europe Market Analysis 2020 to 2024 and Forecast 2025 to 2035, By Country
    • Historical Market Size Value (USD Million) Trend Analysis By Market Taxonomy, 2020 to 2024
    • Market Size Value (USD Million) Forecast By Market Taxonomy, 2025 to 2035
      • By Country
        • Russia
        • Poland
        • Hungary
        • Balkan & Baltic
        • Rest of Eastern Europe
      • By Material Type
      • By Size
      • By Application
    • Market Attractiveness Analysis
      • By Country
      • By Material Type
      • By Size
      • By Application
    • Key Takeaways
  14. East Asia Market Analysis 2020 to 2024 and Forecast 2025 to 2035, By Country
    • Historical Market Size Value (USD Million) Trend Analysis By Market Taxonomy, 2020 to 2024
    • Market Size Value (USD Million) Forecast By Market Taxonomy, 2025 to 2035
      • By Country
        • China
        • Japan
        • South Korea
      • By Material Type
      • By Size
      • By Application
    • Market Attractiveness Analysis
      • By Country
      • By Material Type
      • By Size
      • By Application
    • Key Takeaways
  15. South Asia and Pacific Market Analysis 2020 to 2024 and Forecast 2025 to 2035, By Country
    • Historical Market Size Value (USD Million) Trend Analysis By Market Taxonomy, 2020 to 2024
    • Market Size Value (USD Million) Forecast By Market Taxonomy, 2025 to 2035
      • By Country
        • India
        • ASEAN
        • Australia & New Zealand
        • Rest of South Asia and Pacific
      • By Material Type
      • By Size
      • By Application
    • Market Attractiveness Analysis
      • By Country
      • By Material Type
      • By Size
      • By Application
    • Key Takeaways
  16. Middle East & Africa Market Analysis 2020 to 2024 and Forecast 2025 to 2035, By Country
    • Historical Market Size Value (USD Million) Trend Analysis By Market Taxonomy, 2020 to 2024
    • Market Size Value (USD Million) Forecast By Market Taxonomy, 2025 to 2035
      • By Country
        • Kingdom of Saudi Arabia
        • Other GCC Countries
        • Turkiye
        • South Africa
        • Other African Union
        • Rest of Middle East & Africa
      • By Material Type
      • By Size
      • By Application
    • Market Attractiveness Analysis
      • By Country
      • By Material Type
      • By Size
      • By Application
    • Key Takeaways
  17. Key Countries Market Analysis
    • USA
      • Pricing Analysis
      • Market Share Analysis, 2024
        • By Material Type
        • By Size
        • By Application
    • Canada
      • Pricing Analysis
      • Market Share Analysis, 2024
        • By Material Type
        • By Size
        • By Application
    • Mexico
      • Pricing Analysis
      • Market Share Analysis, 2024
        • By Material Type
        • By Size
        • By Application
    • Brazil
      • Pricing Analysis
      • Market Share Analysis, 2024
        • By Material Type
        • By Size
        • By Application
    • Chile
      • Pricing Analysis
      • Market Share Analysis, 2024
        • By Material Type
        • By Size
        • By Application
    • Germany
      • Pricing Analysis
      • Market Share Analysis, 2024
        • By Material Type
        • By Size
        • By Application
    • UK
      • Pricing Analysis
      • Market Share Analysis, 2024
        • By Material Type
        • By Size
        • By Application
    • Italy
      • Pricing Analysis
      • Market Share Analysis, 2024
        • By Material Type
        • By Size
        • By Application
    • Spain
      • Pricing Analysis
      • Market Share Analysis, 2024
        • By Material Type
        • By Size
        • By Application
    • France
      • Pricing Analysis
      • Market Share Analysis, 2024
        • By Material Type
        • By Size
        • By Application
    • India
      • Pricing Analysis
      • Market Share Analysis, 2024
        • By Material Type
        • By Size
        • By Application
    • ASEAN
      • Pricing Analysis
      • Market Share Analysis, 2024
        • By Material Type
        • By Size
        • By Application
    • Australia & New Zealand
      • Pricing Analysis
      • Market Share Analysis, 2024
        • By Material Type
        • By Size
        • By Application
    • China
      • Pricing Analysis
      • Market Share Analysis, 2024
        • By Material Type
        • By Size
        • By Application
    • Japan
      • Pricing Analysis
      • Market Share Analysis, 2024
        • By Material Type
        • By Size
        • By Application
    • South Korea
      • Pricing Analysis
      • Market Share Analysis, 2024
        • By Material Type
        • By Size
        • By Application
    • Russia
      • Pricing Analysis
      • Market Share Analysis, 2024
        • By Material Type
        • By Size
        • By Application
    • Poland
      • Pricing Analysis
      • Market Share Analysis, 2024
        • By Material Type
        • By Size
        • By Application
    • Hungary
      • Pricing Analysis
      • Market Share Analysis, 2024
        • By Material Type
        • By Size
        • By Application
    • Kingdom of Saudi Arabia
      • Pricing Analysis
      • Market Share Analysis, 2024
        • By Material Type
        • By Size
        • By Application
    • Turkiye
      • Pricing Analysis
      • Market Share Analysis, 2024
        • By Material Type
        • By Size
        • By Application
    • South Africa
      • Pricing Analysis
      • Market Share Analysis, 2024
        • By Material Type
        • By Size
        • By Application
  18. Market Structure Analysis
    • Competition Dashboard
    • Competition Benchmarking
    • Market Share Analysis of Top Players
      • By Regional
      • By Material Type
      • By Size
      • By Application
  19. Competition Analysis
    • Competition Deep Dive
      • Hajet Industry Co Ltd
        • Overview
        • Product Portfolio
        • Profitability by Market Segments (Product/Age /Sales Channel/Region)
        • Sales Footprint
        • Strategy Overview
          • Marketing Strategy
          • Product Strategy
          • Channel Strategy
      • Ishor Internationals
      • Otto Frei
      • Green Stars SA Pvt Ltd
      • Pepetools
      • Hammerman
      • Sunrise Tools India
      • Rio Grande
      • Beadsmith
      • Contenti
  20. Assumptions & Acronyms Used
  21. Research Methodology

List of Tables

  • Table 1: Global Market Value (USD Million) Forecast by Region, 2020 to 2035
  • Table 2: Global Market Value (USD Million) Forecast by Material Type , 2020 to 2035
  • Table 3: Global Market Value (USD Million) Forecast by Size, 2020 to 2035
  • Table 4: Global Market Value (USD Million) Forecast by Application, 2020 to 2035
  • Table 5: North America Market Value (USD Million) Forecast by Country, 2020 to 2035
  • Table 6: North America Market Value (USD Million) Forecast by Material Type , 2020 to 2035
  • Table 7: North America Market Value (USD Million) Forecast by Size, 2020 to 2035
  • Table 8: North America Market Value (USD Million) Forecast by Application, 2020 to 2035
  • Table 9: Latin America Market Value (USD Million) Forecast by Country, 2020 to 2035
  • Table 10: Latin America Market Value (USD Million) Forecast by Material Type , 2020 to 2035
  • Table 11: Latin America Market Value (USD Million) Forecast by Size, 2020 to 2035
  • Table 12: Latin America Market Value (USD Million) Forecast by Application, 2020 to 2035
  • Table 13: Western Europe Market Value (USD Million) Forecast by Country, 2020 to 2035
  • Table 14: Western Europe Market Value (USD Million) Forecast by Material Type , 2020 to 2035
  • Table 15: Western Europe Market Value (USD Million) Forecast by Size, 2020 to 2035
  • Table 16: Western Europe Market Value (USD Million) Forecast by Application, 2020 to 2035
  • Table 17: Eastern Europe Market Value (USD Million) Forecast by Country, 2020 to 2035
  • Table 18: Eastern Europe Market Value (USD Million) Forecast by Material Type , 2020 to 2035
  • Table 19: Eastern Europe Market Value (USD Million) Forecast by Size, 2020 to 2035
  • Table 20: Eastern Europe Market Value (USD Million) Forecast by Application, 2020 to 2035
  • Table 21: East Asia Market Value (USD Million) Forecast by Country, 2020 to 2035
  • Table 22: East Asia Market Value (USD Million) Forecast by Material Type , 2020 to 2035
  • Table 23: East Asia Market Value (USD Million) Forecast by Size, 2020 to 2035
  • Table 24: East Asia Market Value (USD Million) Forecast by Application, 2020 to 2035
  • Table 25: South Asia and Pacific Market Value (USD Million) Forecast by Country, 2020 to 2035
  • Table 26: South Asia and Pacific Market Value (USD Million) Forecast by Material Type , 2020 to 2035
  • Table 27: South Asia and Pacific Market Value (USD Million) Forecast by Size, 2020 to 2035
  • Table 28: South Asia and Pacific Market Value (USD Million) Forecast by Application, 2020 to 2035
  • Table 29: Middle East & Africa Market Value (USD Million) Forecast by Country, 2020 to 2035
  • Table 30: Middle East & Africa Market Value (USD Million) Forecast by Material Type , 2020 to 2035
  • Table 31: Middle East & Africa Market Value (USD Million) Forecast by Size, 2020 to 2035
  • Table 32: Middle East & Africa Market Value (USD Million) Forecast by Application, 2020 to 2035

List of Figures

  • Figure 1: Global Market Pricing Analysis
  • Figure 2: Global Market Value (USD Million) Forecast 2020 to 2035
  • Figure 3: Global Market Value Share and BPS Analysis by Material Type , 2025 and 2035
  • Figure 4: Global Market Y-o-Y Growth Comparison by Material Type , 2025 to 2035
  • Figure 5: Global Market Attractiveness Analysis by Material Type
  • Figure 6: Global Market Value Share and BPS Analysis by Size, 2025 and 2035
  • Figure 7: Global Market Y-o-Y Growth Comparison by Size, 2025 to 2035
  • Figure 8: Global Market Attractiveness Analysis by Size
  • Figure 9: Global Market Value Share and BPS Analysis by Application, 2025 and 2035
  • Figure 10: Global Market Y-o-Y Growth Comparison by Application, 2025 to 2035
  • Figure 11: Global Market Attractiveness Analysis by Application
  • Figure 12: Global Market Value (USD Million) Share and BPS Analysis by Region, 2025 and 2035
  • Figure 13: Global Market Y-o-Y Growth Comparison by Region, 2025 to 2035
  • Figure 14: Global Market Attractiveness Analysis by Region
  • Figure 15: North America Market Incremental Dollar Opportunity, 2025 to 2035
  • Figure 16: Latin America Market Incremental Dollar Opportunity, 2025 to 2035
  • Figure 17: Western Europe Market Incremental Dollar Opportunity, 2025 to 2035
  • Figure 18: Eastern Europe Market Incremental Dollar Opportunity, 2025 to 2035
  • Figure 19: East Asia Market Incremental Dollar Opportunity, 2025 to 2035
  • Figure 20: South Asia and Pacific Market Incremental Dollar Opportunity, 2025 to 2035
  • Figure 21: Middle East & Africa Market Incremental Dollar Opportunity, 2025 to 2035
  • Figure 22: North America Market Value Share and BPS Analysis by Country, 2025 and 2035
  • Figure 23: North America Market Value Share and BPS Analysis by Material Type , 2025 and 2035
  • Figure 24: North America Market Y-o-Y Growth Comparison by Material Type , 2025 to 2035
  • Figure 25: North America Market Attractiveness Analysis by Material Type
  • Figure 26: North America Market Value Share and BPS Analysis by Size, 2025 and 2035
  • Figure 27: North America Market Y-o-Y Growth Comparison by Size, 2025 to 2035
  • Figure 28: North America Market Attractiveness Analysis by Size
  • Figure 29: North America Market Value Share and BPS Analysis by Application, 2025 and 2035
  • Figure 30: North America Market Y-o-Y Growth Comparison by Application, 2025 to 2035
  • Figure 31: North America Market Attractiveness Analysis by Application
  • Figure 32: Latin America Market Value Share and BPS Analysis by Country, 2025 and 2035
  • Figure 33: Latin America Market Value Share and BPS Analysis by Material Type , 2025 and 2035
  • Figure 34: Latin America Market Y-o-Y Growth Comparison by Material Type , 2025 to 2035
  • Figure 35: Latin America Market Attractiveness Analysis by Material Type
  • Figure 36: Latin America Market Value Share and BPS Analysis by Size, 2025 and 2035
  • Figure 37: Latin America Market Y-o-Y Growth Comparison by Size, 2025 to 2035
  • Figure 38: Latin America Market Attractiveness Analysis by Size
  • Figure 39: Latin America Market Value Share and BPS Analysis by Application, 2025 and 2035
  • Figure 40: Latin America Market Y-o-Y Growth Comparison by Application, 2025 to 2035
  • Figure 41: Latin America Market Attractiveness Analysis by Application
  • Figure 42: Western Europe Market Value Share and BPS Analysis by Country, 2025 and 2035
  • Figure 43: Western Europe Market Value Share and BPS Analysis by Material Type , 2025 and 2035
  • Figure 44: Western Europe Market Y-o-Y Growth Comparison by Material Type , 2025 to 2035
  • Figure 45: Western Europe Market Attractiveness Analysis by Material Type
  • Figure 46: Western Europe Market Value Share and BPS Analysis by Size, 2025 and 2035
  • Figure 47: Western Europe Market Y-o-Y Growth Comparison by Size, 2025 to 2035
  • Figure 48: Western Europe Market Attractiveness Analysis by Size
  • Figure 49: Western Europe Market Value Share and BPS Analysis by Application, 2025 and 2035
  • Figure 50: Western Europe Market Y-o-Y Growth Comparison by Application, 2025 to 2035
  • Figure 51: Western Europe Market Attractiveness Analysis by Application
  • Figure 52: Eastern Europe Market Value Share and BPS Analysis by Country, 2025 and 2035
  • Figure 53: Eastern Europe Market Value Share and BPS Analysis by Material Type , 2025 and 2035
  • Figure 54: Eastern Europe Market Y-o-Y Growth Comparison by Material Type , 2025 to 2035
  • Figure 55: Eastern Europe Market Attractiveness Analysis by Material Type
  • Figure 56: Eastern Europe Market Value Share and BPS Analysis by Size, 2025 and 2035
  • Figure 57: Eastern Europe Market Y-o-Y Growth Comparison by Size, 2025 to 2035
  • Figure 58: Eastern Europe Market Attractiveness Analysis by Size
  • Figure 59: Eastern Europe Market Value Share and BPS Analysis by Application, 2025 and 2035
  • Figure 60: Eastern Europe Market Y-o-Y Growth Comparison by Application, 2025 to 2035
  • Figure 61: Eastern Europe Market Attractiveness Analysis by Application
  • Figure 62: East Asia Market Value Share and BPS Analysis by Country, 2025 and 2035
  • Figure 63: East Asia Market Value Share and BPS Analysis by Material Type , 2025 and 2035
  • Figure 64: East Asia Market Y-o-Y Growth Comparison by Material Type , 2025 to 2035
  • Figure 65: East Asia Market Attractiveness Analysis by Material Type
  • Figure 66: East Asia Market Value Share and BPS Analysis by Size, 2025 and 2035
  • Figure 67: East Asia Market Y-o-Y Growth Comparison by Size, 2025 to 2035
  • Figure 68: East Asia Market Attractiveness Analysis by Size
  • Figure 69: East Asia Market Value Share and BPS Analysis by Application, 2025 and 2035
  • Figure 70: East Asia Market Y-o-Y Growth Comparison by Application, 2025 to 2035
  • Figure 71: East Asia Market Attractiveness Analysis by Application
  • Figure 72: South Asia and Pacific Market Value Share and BPS Analysis by Country, 2025 and 2035
  • Figure 73: South Asia and Pacific Market Value Share and BPS Analysis by Material Type , 2025 and 2035
  • Figure 74: South Asia and Pacific Market Y-o-Y Growth Comparison by Material Type , 2025 to 2035
  • Figure 75: South Asia and Pacific Market Attractiveness Analysis by Material Type
  • Figure 76: South Asia and Pacific Market Value Share and BPS Analysis by Size, 2025 and 2035
  • Figure 77: South Asia and Pacific Market Y-o-Y Growth Comparison by Size, 2025 to 2035
  • Figure 78: South Asia and Pacific Market Attractiveness Analysis by Size
  • Figure 79: South Asia and Pacific Market Value Share and BPS Analysis by Application, 2025 and 2035
  • Figure 80: South Asia and Pacific Market Y-o-Y Growth Comparison by Application, 2025 to 2035
  • Figure 81: South Asia and Pacific Market Attractiveness Analysis by Application
  • Figure 82: Middle East & Africa Market Value Share and BPS Analysis by Country, 2025 and 2035
  • Figure 83: Middle East & Africa Market Value Share and BPS Analysis by Material Type , 2025 and 2035
  • Figure 84: Middle East & Africa Market Y-o-Y Growth Comparison by Material Type , 2025 to 2035
  • Figure 85: Middle East & Africa Market Attractiveness Analysis by Material Type
  • Figure 86: Middle East & Africa Market Value Share and BPS Analysis by Size, 2025 and 2035
  • Figure 87: Middle East & Africa Market Y-o-Y Growth Comparison by Size, 2025 to 2035
  • Figure 88: Middle East & Africa Market Attractiveness Analysis by Size
  • Figure 89: Middle East & Africa Market Value Share and BPS Analysis by Application, 2025 and 2035
  • Figure 90: Middle East & Africa Market Y-o-Y Growth Comparison by Application, 2025 to 2035
  • Figure 91: Middle East & Africa Market Attractiveness Analysis by Application
  • Figure 92: Global Market – Tier Structure Analysis
  • Figure 93: Global Market – Company Share Analysis
Dashboard
Dashboard
Dashboard
Dashboard
Dashboard
Dashboard

Full Research Suite comprises of:

Market outlook & trends analysis

Market outlook & trends analysis

Interviews & case studies

Interviews & case studies

Strategic recommendations

Strategic recommendations

Vendor profiles & capabilities analysis

Vendor profiles & capabilities analysis

5-year forecasts

5-year forecasts

8 regions and 60+ country-level data splits

8 regions and 60+ country-level data splits

Market segment data splits

Market segment data splits

12 months of continuous data updates

12 months of continuous data updates

DELIVERED AS:

PDF EXCEL ONLINE

Full Research Suite


$5000

$7500

$10000

Buy Report Now
Future Market Insights

Drawplate Market

Chat With MaRIA

Chat With

MaRIA

Hi There, I am MaRIA, Your Market Research Intelligence Assistant. How may I help you?