The global dredging market is valued at USD 16.9 billion in 2025 and is slated to reach USD 20.8 billion by 2035, recording an absolute increase of USD 3.9 billion over the forecast period. This translates into a total growth of 23.1%, with the market forecast to expand at a compound annual growth rate (CAGR) of 2.1% between 2025 and 2035. The overall market size is expected to grow by nearly 1.2X during the same period, supported by increasing global maritime trade activities, growing coastal protection requirements, and rising adoption of port modernization projects across diverse marine infrastructure applications.
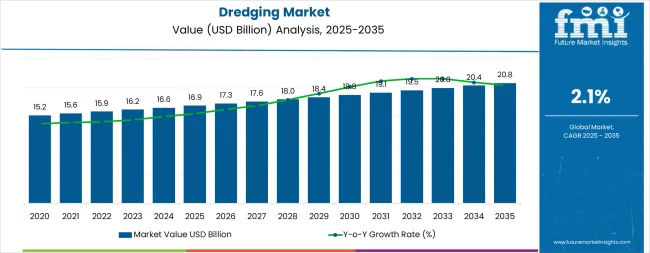
Between 2025 and 2030, the dredging market is projected to expand from USD 16.9 billion to USD 18.8 billion, resulting in a value increase of USD 1.9 billion, which represents 48.7% of the total forecast growth for the decade. This phase of development will be shaped by increasing port expansion projects, rising coastal protection initiatives, and growing adoption of offshore energy infrastructure development in maritime applications. Service providers are expanding their fleet capabilities to address the growing demand for efficient dredging solutions and enhanced operational reliability.
| Metric | Value |
|---|---|
| Estimated Value in (2025E) | USD 16.9 billion |
| Forecast Value in (2035F) | USD 20.8 billion |
| Forecast CAGR (2025 to 2035) | 2.1% |
From 2030 to 2035, the market is forecast to grow from USD 18.8 billion to USD 20.8 billion, adding another USD 2 billion, which constitutes 51.3% of the overall ten-year expansion. This period is expected to be characterized by the expansion of offshore renewable energy projects, the integration of advanced automation technologies, and the development of specialized environmental dredging solutions for major coastal and marine infrastructure projects. The growing adoption of climate adaptation programs and smart port initiatives will drive demand for dredging services with enhanced operational capabilities and reduced environmental impact.
Between 2020 and 2025, the dredging market experienced steady growth, driven by increasing maritime infrastructure development and growing recognition of dredging services as essential equipment for port operations and coastal protection. The market developed as port authorities and government agencies recognized the potential for advanced dredging technologies to enhance operational efficiency while reducing maintenance costs and improving navigational safety. Technological advancement in automated dredging systems and environmental monitoring began emphasizing the critical importance of maintaining operational precision and environmental compliance in marine infrastructure applications.
Market expansion is being supported by the increasing global maritime trade activities and the corresponding need for efficient port infrastructure that can maintain navigational reliability and operational capacity while supporting diverse shipping applications across various marine environments. Modern port operators and government agencies are increasingly focused on implementing dredging solutions that can reduce operational delays, minimize maintenance costs, and provide consistent performance in channel maintenance operations. Dredging services' proven ability to deliver enhanced navigational safety, reliable port operations, and versatile marine infrastructure applications make them essential services for contemporary maritime operations and coastal management solutions.
The growing emphasis on coastal protection and infrastructure modernization is driving demand for dredging services that can support large-scale land reclamation, reduce coastal erosion risks, and enable efficient maritime transport operations across varying port configurations. Port operators' preference for services that combine reliability with operational efficiency and environmental compliance is creating opportunities for innovative dredging implementations. The rising influence of climate change adaptation and offshore energy development is also contributing to increased adoption of dredging services that can provide advanced operational control without compromising performance or environmental standards.
The dredging market is poised for steady growth and transformation. As maritime operators across both developed and emerging markets seek infrastructure services that are reliable, environmentally compliant, efficient, and operationally effective, dredging systems are gaining prominence not just as maintenance services but as strategic infrastructure for port efficiency, coastal protection, maritime safety enhancement, and environmental compliance.
Rising maritime trade and infrastructure investment in East Asia, South Asia Pacific, and Europe amplify demand, while service providers are picking up on innovations in automation technologies and environmental monitoring systems.
Pathways like offshore energy support, automation integration, and environmental compliance promise strong margin uplift, especially in developed markets. Geographic expansion and service diversification will capture volume, particularly where maritime activities are growing or coastal infrastructure requires modernization. Environmental pressures around coastal protection, sediment management, operational efficiency, and regulatory compliance give structural support.
The market is segmented by customer type, application, and region. By customer type, the market is divided into government, O&G companies, mining companies, renewable companies, and others (construction companies, port authorities, private developers, engineering consultancies, environmental agencies, real estate developers, and tourism companies). By application, it covers trade activity, trade maintenance, energy infrastructure, urban development, coastal protection, leisure, and other applications. Regionally, the market is divided into North America, Latin America, Western Europe, Eastern Europe, East Asia, South Asia & Pacific, and Middle East & Africa.
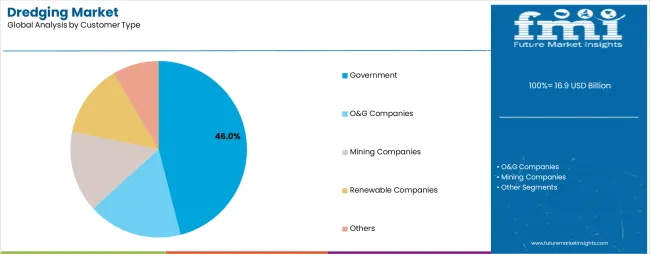
The government segment is projected to account for 46% of the dredging market in 2025, reaffirming its position as the leading customer category. Government agencies and public authorities increasingly utilize dredging services for their strategic importance, large-scale project capabilities, and reliable funding mechanisms across port development, coastal protection, and infrastructure maintenance applications. Government sector's established procurement procedures and consistent project requirements directly address the maritime infrastructure needs for reliable dredging services and operational efficiency in diverse marine environments.
This customer segment forms the foundation of current dredging operations, as it represents the sector with the greatest project scale and proven contract stability across multiple applications and infrastructure scenarios. Government investments in enhanced port infrastructure and coastal protection continue to strengthen adoption among maritime authorities and development agencies. With governments prioritizing infrastructure resilience and maritime competitiveness, government projects align with both operational efficiency objectives and strategic development requirements, making them the central component of comprehensive dredging market strategies.
Trade maintenance is projected to represent 31% of dredging demand in 2025, underscoring its critical role as the primary application for maintaining navigational channels and port operational efficiency. Port operators prefer trade maintenance dredging for its recurring nature, operational necessity, and ability to support continuous maritime commerce while ensuring channel depth and berth accessibility requirements. Positioned as essential services for modern port operations, trade maintenance offers both operational advantages and business continuity benefits.
The segment is supported by continuous innovation in maintenance scheduling and the growing availability of specialized dredging configurations that enable efficient sediment removal with enhanced operational capabilities. Port operators are investing in regular maintenance programs to support large-scale operations and maritime commerce delivery. As global trade becomes more prevalent and vessel size requirements increase, trade maintenance will continue to dominate the application market while supporting advanced dredging utilization and port operational strategies.
The dredging market is advancing steadily due to increasing global maritime trade and growing adoption of port infrastructure modernization that provides enhanced navigational safety and operational efficiency across diverse marine applications. The market faces challenges, including high operational costs, environmental regulatory constraints, and varying project requirements across different marine environments. Innovation in automation technologies and environmental monitoring systems continues to influence service development and market expansion patterns.
The growing expansion of global shipping and port infrastructure development is enabling service providers to develop dredging capabilities that provide superior navigational support, enhanced operational efficiency, and reliable performance in high-volume maritime environments. Advanced dredging services provide improved port capacity while allowing more effective channel maintenance and consistent operational delivery across various applications and port requirements. Service providers are increasingly recognizing the competitive advantages of modern dredging capabilities for operational efficiency and infrastructure development positioning.
Modern dredging service providers are incorporating automation systems and environmental monitoring technologies to enhance operational precision, reduce environmental impact, and ensure consistent performance delivery to port operators and government agencies. These technologies improve operational reliability while enabling new applications, including environmental remediation and offshore energy support solutions. Advanced technology integration also allows service providers to support premium positioning and operational optimization beyond traditional dredging service supply.
| Country | CAGR (2025-2035) |
|---|---|
| Japan | 5.7% |
| China | 5.1% |
| India | 4.4% |
| Germany | 3.8% |
| France | 2.1% |
| United States | 2% |
| United Kingdom | 1.4% |
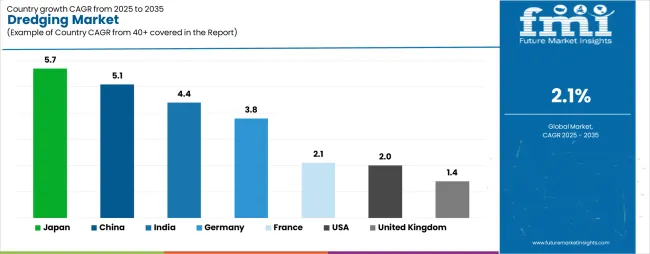
The dredging market is experiencing varied growth globally, with Japan leading at a 5.7% CAGR through 2035, driven by extensive port modernization programs, coastal protection initiatives, and significant adoption of LNG terminal expansion projects. China follows at 5.1%, supported by massive Belt & Road Initiative developments, port infrastructure expansion, and growing adoption of coastal reclamation technologies. India shows growth at 4.4%, emphasizing Sagarmala program implementation and port development initiatives. Germany records 3.8%, focusing on offshore wind energy projects and river navigation maintenance. France demonstrates 2.1% growth, supported by seaport modernization and coastal protection programs. USA and UK show more modest growth at 2% and 1.4% respectively.
The report covers an in-depth analysis of 40+ countries, the top-performing countries are highlighted below.
Revenue from dredging services in Japan is projected to exhibit exceptional growth with a CAGR of 5.7% through 2035, driven by extensive port modernization programs and rapidly growing adoption of coastal protection solutions supported by infrastructure resilience initiatives and LNG terminal expansion requirements. The country's comprehensive maritime development strategy and increasing investment in disaster preparedness technologies are creating substantial demand for advanced dredging services. Major port authorities and government agencies are establishing comprehensive dredging programs to serve both domestic infrastructure needs and maritime trade requirements.
Revenue from dredging services in China is expanding at a CAGR of 5.1%, supported by the country's massive Belt & Road Initiative projects, comprehensive port infrastructure expansion, and increasing adoption of coastal reclamation systems. The country's established maritime infrastructure and growing emphasis on international connectivity are driving sophisticated dredging capabilities. Government agencies and port operators are establishing extensive dredging operations to address the growing demand for channel deepening and land reclamation.
Revenue from dredging services in India is growing at a CAGR of 4.4%, driven by expanding Sagarmala program initiatives, increasing port modernization activities, and growing investment in maritime infrastructure enhancement. The country's established port development strategy and emphasis on coastal connectivity are supporting demand for advanced dredging technologies across major maritime markets. Port authorities and government agencies are establishing comprehensive dredging programs to serve both domestic development needs and international trade requirements.
Revenue from dredging services in Germany is expanding at a CAGR of 3.8%, supported by the country's focus on offshore wind energy projects, comprehensive river navigation maintenance, and strategic investment in maritime infrastructure improvement. Germany's established maritime infrastructure and emphasis on environmental compliance are driving demand for specialized dredging technologies focusing on operational precision and environmental protection. Port operators are investing in comprehensive dredging enhancement to serve both domestic maritime requirements and renewable energy development operations.
Revenue from dredging services in France is expanding at a CAGR of 2.1%, supported by the country's focus on seaport modernization, comprehensive coastal protection programs, and strategic investment in maritime infrastructure improvement. France's established port infrastructure and emphasis on operational efficiency are driving demand for specialized dredging technologies focusing on operational reliability and coastal resilience. Port operators are investing in comprehensive dredging modernization to serve both domestic maritime requirements and international trade operations.
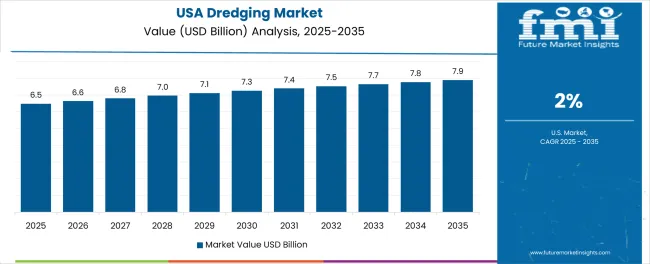
Revenue from dredging services in USA is growing at a CAGR of 2%, driven by expanding harbor maintenance operations, increasing coastal resilience projects, and growing investment in maritime infrastructure enhancement. The country's established port infrastructure and emphasis on operational reliability are supporting demand for dredging technologies across major maritime markets. Port authorities and government agencies are establishing maintenance programs to serve both domestic commerce needs and operational efficiency requirements.
Revenue from dredging services in UK is expanding at a CAGR of 1.4%, supported by the country's focus on port efficiency enhancement, post-Brexit trade adaptation requirements, and strategic investment in maritime infrastructure optimization. UK's established maritime sector and emphasis on trade continuity are driving demand for specialized dredging technologies focusing on operational efficiency and trade facilitation. Port operators are investing in infrastructure enhancement to serve both domestic trade requirements and international connectivity operations.
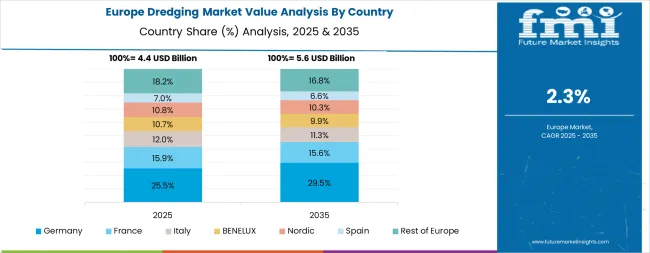
The dredging market in Europe is projected to grow from USD 4.2 billion in 2025 to USD 5.1 billion by 2035, registering a CAGR of 2% over the forecast period. Germany is expected to maintain its leadership position with a 28.6% market share in 2025, increasing to 29.3% by 2035, supported by its advanced maritime infrastructure, comprehensive offshore wind development, and major port facilities serving European and international markets.
France follows with a 22.4% share in 2025, projected to reach 22.1% by 2035, driven by seaport modernization programs, coastal protection initiatives, and established maritime capabilities, but facing challenges from competitive pressures and infrastructure investment constraints. UK holds a 18.7% share in 2025, expected to decline to 18.2% by 2035, supported by port efficiency requirements and post-Brexit adaptation but facing challenges from economic uncertainties and reduced EU integration. Netherlands commands a 15.3% share in 2025, projected to reach 15.8% by 2035, while Italy accounts for 10.9% in 2025, expected to reach 11.1% by 2035. The Rest of Europe region, including Nordic countries, Eastern European markets, Spain, and other European countries, is anticipated to gain momentum, expanding its collective share from 4.1% to 4.5% by 2035, attributed to increasing maritime development across Nordic countries and growing port modernization across various European markets implementing advanced infrastructure upgrade programs.
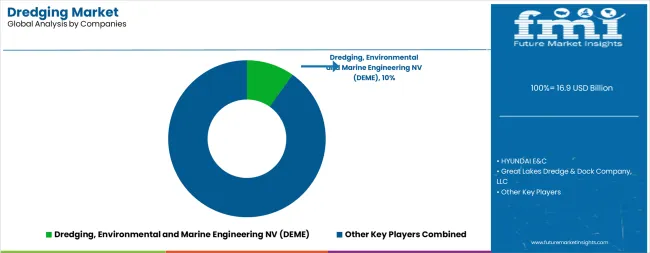
The dredging market is characterized by competition among established marine construction companies, specialized dredging service providers, and integrated maritime infrastructure service companies. Companies are investing in advanced automation technology research, environmental monitoring development, fleet modernization optimization, and comprehensive service portfolios to deliver reliable, efficient, and environmentally-compliant dredging solutions. Innovation in automation systems, environmental compliance technologies, and specialized equipment capabilities is central to strengthening market position and competitive advantage.
HYUNDAI E&C leads the market with a strong presence, offering comprehensive marine construction and dredging solutions with a focus on large-scale projects and advanced engineering capabilities for government and infrastructure operations. DEME Group provides specialized environmental and marine engineering portfolios with an emphasis on technological innovation, environmental compliance, and comprehensive project management. Great Lakes Dredge & Dock Company delivers integrated dredging and marine construction solutions with focus on North American markets and operational expertise. TOA Corporation specializes in marine construction with emphasis on Japanese market leadership and technical excellence. Penta-Ocean Construction focuses on comprehensive marine infrastructure solutions with advanced construction capabilities and project expertise.
| Items | Values |
|---|---|
| Quantitative Units (2025) | USD 16.9 billion |
| Customer Type | Government, O&G Companies, Mining Companies, Renewable Companies, Others (Construction Companies, Port Authorities, Private Developers, Engineering Consultancies, Environmental Agencies, Real Estate Developers, Tourism Companies) |
| Application | Trade Activity, Trade Maintenance, Energy Infrastructure, Urban Development, Coastal Protection, Leisure, Other Applications |
| Regions Covered | North America, Latin America, Western Europe, Eastern Europe, East Asia, South Asia & Pacific, Middle East & Africa |
| Countries Covered | United States, Canada, United Kingdom, Germany, France, China, Japan, South Korea, Brazil, Australia, and 40+ countries |
| Key Companies Profiled | HYUNDAI E&C, DEME Group, Great Lakes Dredge & Dock Company, TOA Corporation, Penta-Ocean Construction, National Marine Company, and others |
| Additional Attributes | Service sales by customer and application category, regional demand trends, competitive landscape, technological advancements in automation systems, environmental monitoring development, fleet modernization innovation, and operational efficiency optimization |
The global dredging market is estimated to be valued at USD 16.9 billion in 2025.
The market size for the dredging market is projected to reach USD 20.8 billion by 2035.
The dredging market is expected to grow at a 2.1% CAGR between 2025 and 2035.
The key product types in dredging market are government, o&g companies, mining companies, renewable companies and others.
In terms of application, trade activity segment to command 0.0% share in the dredging market in 2025.


Our Research Products

The "Full Research Suite" delivers actionable market intel, deep dives on markets or technologies, so clients act faster, cut risk, and unlock growth.

The Leaderboard benchmarks and ranks top vendors, classifying them as Established Leaders, Leading Challengers, or Disruptors & Challengers.

Locates where complements amplify value and substitutes erode it, forecasting net impact by horizon

We deliver granular, decision-grade intel: market sizing, 5-year forecasts, pricing, adoption, usage, revenue, and operational KPIs—plus competitor tracking, regulation, and value chains—across 60 countries broadly.

Spot the shifts before they hit your P&L. We track inflection points, adoption curves, pricing moves, and ecosystem plays to show where demand is heading, why it is changing, and what to do next across high-growth markets and disruptive tech

Real-time reads of user behavior. We track shifting priorities, perceptions of today’s and next-gen services, and provider experience, then pace how fast tech moves from trial to adoption, blending buyer, consumer, and channel inputs with social signals (#WhySwitch, #UX).

Partner with our analyst team to build a custom report designed around your business priorities. From analysing market trends to assessing competitors or crafting bespoke datasets, we tailor insights to your needs.
Supplier Intelligence
Discovery & Profiling
Capacity & Footprint
Performance & Risk
Compliance & Governance
Commercial Readiness
Who Supplies Whom
Scorecards & Shortlists
Playbooks & Docs
Category Intelligence
Definition & Scope
Demand & Use Cases
Cost Drivers
Market Structure
Supply Chain Map
Trade & Policy
Operating Norms
Deliverables
Buyer Intelligence
Account Basics
Spend & Scope
Procurement Model
Vendor Requirements
Terms & Policies
Entry Strategy
Pain Points & Triggers
Outputs
Pricing Analysis
Benchmarks
Trends
Should-Cost
Indexation
Landed Cost
Commercial Terms
Deliverables
Brand Analysis
Positioning & Value Prop
Share & Presence
Customer Evidence
Go-to-Market
Digital & Reputation
Compliance & Trust
KPIs & Gaps
Outputs
Full Research Suite comprises of:
Market outlook & trends analysis
Interviews & case studies
Strategic recommendations
Vendor profiles & capabilities analysis
5-year forecasts
8 regions and 60+ country-level data splits
Market segment data splits
12 months of continuous data updates
DELIVERED AS:
PDF EXCEL ONLINE
Dredging Equipment Market Size and Share Forecast Outlook 2025 to 2035

Thank you!
You will receive an email from our Business Development Manager. Please be sure to check your SPAM/JUNK folder too.
Chat With
MaRIA