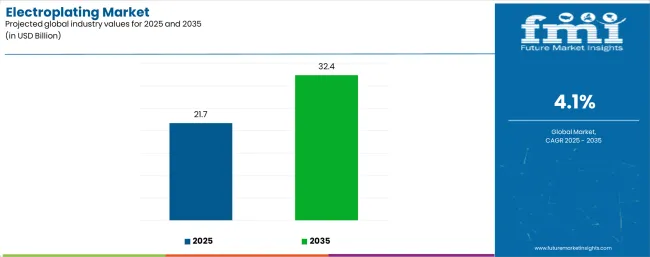
The global electroplating market is valued at USD 21.7 billion in 2025 and is forecasted to reach USD 32.4 billion by 2035, recording an absolute increase of USD 10.7 billion over the forecast period. This translates into a total growth of 49.2%, with the market forecast to expand at a CAGR of 4.1% between 2025 and 2035. The market size is expected to grow by nearly 1.49X during the same period, supported by increasing demand from automotive and electronics industries, growing adoption of electric vehicles requiring advanced plating solutions, and rising focus on corrosion-resistant components across diverse industrial applications.
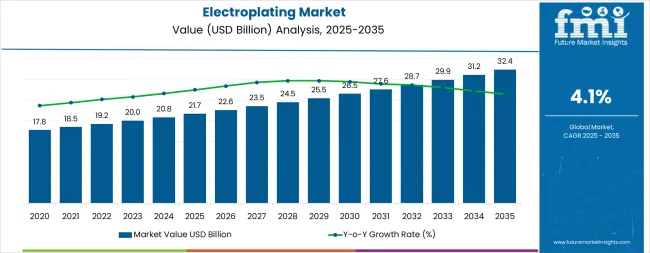
Between 2025 and 2030, the market is projected to expand from USD 21.7 billion to USD 26.8 billion, resulting in a value increase of USD 5.2 billion, which represents 48.5% of the total forecast growth for the decade. This phase of development will be shaped by increasing automotive and electronics industry expansion, rising adoption of automation and AI-driven plating technologies, and growing demand for environmentally compliant plating processes in response to stringent regulatory requirements. Manufacturers are expanding their electroplating service capabilities to address the growing demand for high-performance surface treatment solutions and advanced coating applications.
| Metric | Value |
|---|---|
| Estimated Value (2025E) | USD 21.7 billion |
| Forecast Value (2035F) | USD 32.4 billion |
| Forecast CAGR (2025 to 2035) | 4.1% |
From 2030 to 2035, the market is forecast to grow from USD 26.8 billion to USD 32.4 billion, adding another USD 5.5 billion, which constitutes 51.5% of the overall ten-year expansion. This period is expected to be characterized by the expansion of trivalent chromium and cyanide-free plating technologies, the integration of IoT-enabled monitoring systems for quality control, and the development of nanostructured and composite coatings for advanced applications. The growing adoption of electric vehicles and clean manufacturing practices will drive demand for electroplating solutions with enhanced environmental compliance and minimal waste generation.
Between 2020 and 2025, the market experienced steady growth, driven by increasing demand from automotive and electronics sectors and growing recognition of electroplating as essential for corrosion protection and aesthetic enhancement. The market developed as manufacturers recognized the potential for electroplated components to enhance product durability while providing decorative finishes. Technological advancement in plating processes and environmental compliance methods began focusing the critical importance of reducing hazardous chemical usage and implementing green manufacturing practices.
Market expansion is being supported by the increasing global demand from automotive, electronics, aerospace, and consumer goods industries requiring high-performance, corrosion-resistant components that can enhance product durability and aesthetic appeal across various industrial applications. Modern manufacturers are increasingly focused on implementing surface treatment solutions that can improve component performance, extend product lifespan, and provide consistent quality in manufactured products. Electroplating's proven ability to deliver corrosion protection, enhanced electrical conductivity, and decorative finishes make it essential for contemporary manufacturing and product development solutions.
The growing focus on electric vehicle production and electronics miniaturization is driving demand for electroplating solutions that can support advanced battery components, reduce weight through precision coating, and enable high-conductivity applications for semiconductor packaging. Manufacturers' preference for surface treatments that combine performance enhancement with operational efficiency and cost-effectiveness is creating opportunities for innovative electroplating implementations. The rising influence of environmental regulations and clean manufacturing demands is also contributing to increased adoption of trivalent chromium, cyanide-free processes, and water-based electrolyte systems that can provide effective coating solutions without hazardous chemical dependencies.
The electroplating market is poised for significant growth and transformation. As manufacturers across both developed and emerging markets seek surface treatment solutions that are high-performance, environmentally compliant, cost-effective, and technologically advanced, electroplating is gaining prominence not just for traditional applications but as strategic enabler in electric vehicles, semiconductors, aerospace components, and more.
Rising industrialization in Asia Pacific, technology advancement in electronics, and automotive electrification amplify demand, while manufacturers are adopting innovations in plating chemistries, automation technologies, and environmental compliance systems.
Pathways like environmental compliance, EV-specific applications, and automation-led efficiency promise strong margin uplift, especially in mature markets. Geographic expansion and localization will capture volume, particularly where manufacturing is expanding rapidly. Regulatory pressures around environmental safety, waste reduction, and worker protection give structural support.
The market is segmented by plating metal, substrate type, function, end-use, and region. By plating metal, the market is divided into gold, silver, copper, nickel, chromium, zinc, and others. By substrate type, it covers base metal plating (copper, nickel, aluminum, zinc, lead) and plastic plating (ABS, PPA, PC, PP, polysulfone). By function, it is segmented into decorative and functional. Based on end-use, the market is categorized into automotive, electrical & electronics, aerospace & defense, jewelry, machinery parts & components, and others. Regionally, the market is divided into North America, Latin America, Europe, Asia Pacific, and Middle East & Africa.

The nickel segment is projected to account for 20% of the electroplating market in 2025, reaffirming its position as the leading plating metal category. Manufacturers increasingly utilize nickel electroplating for its superior corrosion resistance, hardness enhancement, and decorative effect in applications across automotive components, electronics, aerospace parts, and household appliances. Nickel plating technology's advanced performance capabilities and consistent quality output directly address the industrial requirements for reliable corrosion protection and operational longevity in large-scale manufacturing.
This plating metal segment forms the foundation of modern surface treatment operations, as it represents the material with the greatest versatility and established market demand across multiple industrial categories and functional applications. Manufacturer investments in enhanced electroplating technologies and quality control systems continue to strengthen adoption among industrial processors. With companies prioritizing corrosion resistance, wear resistance, and aesthetic finish, nickel electroplating aligns with both operational efficiency objectives and product performance requirements, making it the central component of comprehensive surface treatment strategies.

Base metal plating is projected to represent 60% of electroplating demand in 2025, underscoring its critical role as the primary substrate category for industrial surface treatment and functional coating applications. Manufacturing companies prefer base metal plating for its cost-effectiveness, durability enhancement, and ability to improve component performance while providing corrosion protection and wear resistance. Positioned as essential substrates for modern industrial manufacturing, base metals offer both operational advantages and performance benefits.
The segment is supported by continuous innovation in plating chemistry development and the growing availability of specialized coating technologies that enable premium surface finishing with enhanced functional properties. The manufacturers are investing in process automation to support high-volume production and quality assurance. As industrial demand becomes more prevalent and performance requirements increase, base metal plating will continue to dominate the substrate market while supporting advanced coating utilization and product innovation strategies.
The market is advancing rapidly due to increasing demand from automotive, electronics, aerospace, and jewelry industries requiring high-performance, corrosion-resistant components with enhanced durability and aesthetic appeal. However, the market faces challenges, including environmental and regulatory compliance requirements, fluctuation of raw material prices, and the need for advanced waste treatment system investments. Innovation in trivalent chromium technologies, automation systems, and nanostructured coatings continues to influence product development and market expansion patterns.
The growing adoption of trivalent chromium, cyanide-free silver, and water-based electrolyte systems is enabling manufacturers to produce compliant electroplated components with reduced environmental impact, enhanced worker safety, and regulatory adherence. Environmental compliance technologies provide improved eco-friendly credentials while allowing more efficient processing and consistent output across various plating applications. Manufacturers are increasingly recognizing the competitive advantages of environmental compliance capabilities for market access and premium positioning.
Modern electroplating facilities are incorporating high-throughput automation, AI-driven bath monitoring, and IoT-enabled production lines to enhance coating uniformity, reduce reject rates, and ensure consistent quality delivery to end users. These technologies improve operational efficiency while enabling new applications, including precision coating for miniaturized components and real-time quality control. Advanced automation integration also allows processors to support high-volume production and labor cost reduction beyond traditional manual plating operations.
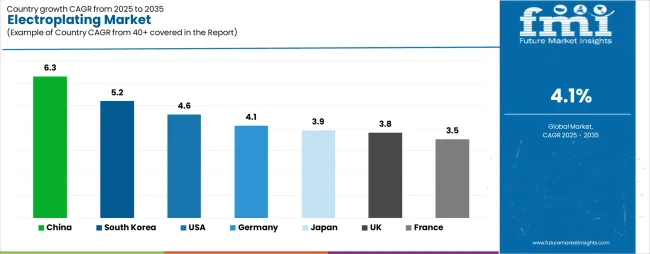
| Country | CAGR (2025-2035) |
|---|---|
| China | 6.3% |
| South Korea | 5.2% |
| USA | 4.6% |
| Germany | 4.1% |
| Japan | 3.9% |
| UK | 3.8% |
| France | 3.5% |
The market is experiencing strong growth globally, with China leading at a 6.3% CAGR through 2035, driven by huge industrialization, rising automobile manufacturing, and rapidly expanding electronics industry. South Korea follows at 5.2%, supported by advanced electronics and semiconductor production base. The USA shows growth at 4.6%, focusing technological innovation and precision manufacturing. Germany records 4.1%, focusing on automotive excellence and mechanical engineering. Japan demonstrates 3.9% growth, prioritizing miniaturization and precision components. The UK exhibits 3.8% growth, prioritizing environmental responsibility. France shows 3.5% growth, supported by electric vehicle development.
The report covers an in-depth analysis of 40+ countries, top-performing countries are highlighted below.
China is projected to exhibit exceptional growth with a CAGR of 6.3% through 2035, driven by huge industrialization, rising automobile manufacturing, and rapidly expanding electronics industry supported by government industrial modernization initiatives. The country's comprehensive manufacturing infrastructure and large-scale production capabilities are creating substantial demand for advanced electroplating services. Major industry players and manufacturing enterprises are establishing extensive electroplating capabilities to serve both domestic and international markets.
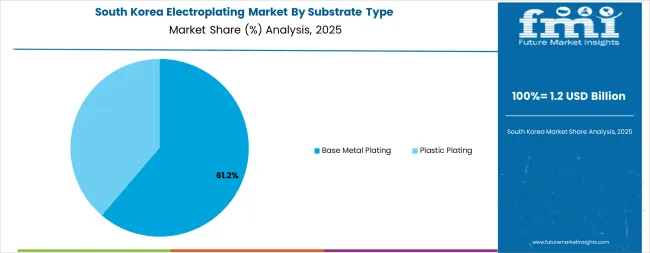
South Korea is expanding at a CAGR of 5.2%, supported by the country's advanced electronics and semiconductor production base, extensive use in printed circuit boards, connectors, and high-precision components. The country's technological expertise and innovation-driven manufacturing are driving demand for sophisticated electroplating capabilities. Industry leaders and technology providers are establishing comprehensive production and service capabilities to address growing demand for high-performance electroplated products.

The USA is expanding at a CAGR of 4.6%, supported by the country's advanced manufacturing industry, strong focus on technological innovation, and robust demand from automotive, aerospace, and electronics sectors. The nation's mature industrial base and high standards for product quality are driving sophisticated electroplating capabilities throughout the supply chain. Leading manufacturers and technology providers are investing extensively in advanced surface treatment methods to serve both domestic and export markets.
Germany is growing at a CAGR of 4.1%, driven by well-established automotive production infrastructure, strong mechanical engineering base, and growing investment in smart production technologies. The country's reputation for quality manufacturing and technological expertise are supporting demand for advanced electroplating technologies across major industrial regions. Manufacturers and technology providers are establishing comprehensive capabilities to serve both domestic automotive centers and international markets.
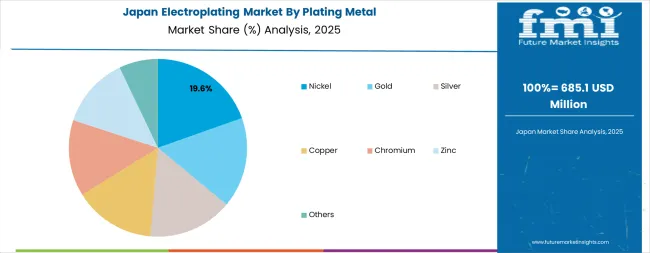
Japan is expanding at a CAGR of 3.9%, supported by the country's focus on precision manufacturing, advanced technological capabilities, and strong demand from automotive, robotics, and consumer electronics industries. Japan's sophisticated manufacturing industry and focus on quality are driving demand for advanced electroplating technologies including high-precision and environmentally friendly processes. Leading manufacturers are investing in specialized capabilities to serve commercial production, technology applications, and export segments with premium electroplated offerings.
The UK is growing at a CAGR of 3.8%, driven by the automotive and electronics industries as key drivers, increasing demand for eco-friendly plating processes, and transition toward lightweight and durable components in aerospace and defense sectors. The country's focus on sustainability and manufacturing efficiency are driving demand for advanced electroplating capabilities. Industry operators are establishing comprehensive automation and digital control systems to serve both domestic and European markets.
France is expanding at a CAGR of 3.5%, supported by increased investment in electric vehicles and industrial machinery, generating higher demand for surface treatment applications. The country's automotive transformation and industrial development are driving demand for specialized electroplating technologies focusing on wear-resistant coatings and decorative plating. Manufacturers are investing in comprehensive R&D facilities to serve both domestic and international markets with advanced surface treatment products.
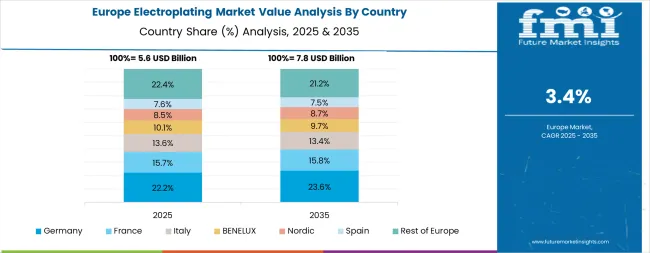
The electroplating market in Europe is projected to grow from USD 6.4 billion in 2025 to USD 9.3 billion by 2035, registering a CAGR of 3.8% over the forecast period. Germany is expected to maintain its leadership position with a 31.2% market share in 2025, declining slightly to 30.8% by 2035, supported by its dominant automotive production hubs in Bavaria and Baden-Württemberg, advanced robotics integration in surface finishing, and comprehensive electroplating service network serving major European markets.
France follows with a 22.5% share in 2025, projected to reach 22.9% by 2035, driven by growing EV component production, robust demand for electroplating in industrial machinery and electronics sectors, combined with compliance with EU-wide environmental mandates favoring trivalent chromium and cyanide-free systems. The United Kingdom holds a 19.4% share in 2025, expected to decrease to 19.0% by 2035, supported by aerospace and defense surface finishing demand but facing challenges from post-Brexit supply chain adjustments and stringent decarbonization policies influencing plating line automation. Italy commands a 14.1% share in 2025, projected to reach 14.0% by 2035, while Spain accounts for 7.6% in 2025, expected to reach 8.0% by 2035. The Rest of Europe region, including Nordic countries, Eastern Europe, BENELUX, Portugal, and Austria, is anticipated to expand its collective share from 5.2% to 5.3% by 2035, attributed to modernization programs in Eastern European industrial bases and growing investment in greener plating technologies across Scandinavian markets implementing advanced surface treatment solutions.
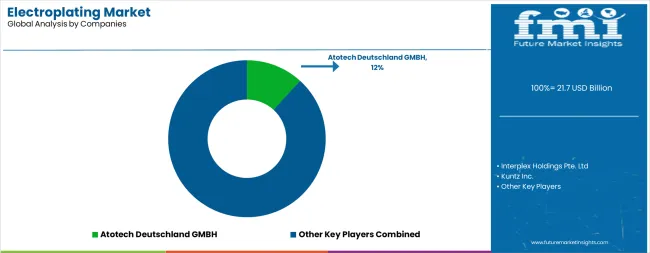
The market is characterized by competition among established surface treatment companies, specialized plating technology providers, and integrated manufacturing service providers. Companies are investing in advanced plating technology research, process automation, quality control systems, and comprehensive service portfolios to deliver consistent, high-quality, and cost-effective electroplating solutions. Innovation in automated processes, environmental compliance systems, and advanced coating development is central to strengthening market position and competitive advantage.
Atotech Deutschland GMBH leads the market with strong technological capabilities, offering comprehensive electroplating solutions with focus on automotive, electronics, and industrial applications. Interplex Holdings Pte. Ltd provides specialized plating services with focus on precision components and high-volume production. Kuntz Inc. delivers innovative surface finishing solutions with focus on quality manufacturing and customer service. Pioneer Metal Finishing Inc. specializes in advanced surface treatment for aerospace and defense sectors. Roy Metal Finishing Inc. focuses on decorative and functional plating applications for diverse industries. Bajaj Electroplaters offers specialized solutions for automotive and industrial markets with focus on quality and reliability.
| Items | Values |
|---|---|
| Quantitative Units (2025) | USD 21.7 billion |
| Plating Metal | Gold, Silver, Copper, Nickel, Chromium, Zinc, Others |
| Substrate Type | Base Metal Plating (Copper, Nickel, Aluminum, Zinc, Lead), Plastic Plating (ABS, PPA, PC, PP, Polysulfone) |
| Function | Decorative, Functional |
| End-Use | Automotive, Electrical & Electronics, Aerospace & Defense, Jewelry, Machinery Parts & Components, Others |
| Regions Covered | North America, Latin America, Europe, Asia Pacific, Middle East & Africa |
| Countries Covered | United States, Canada, United Kingdom, Germany, France, Italy, China, Japan, South Korea, Australia, New Zealand and 40+ countries |
| Key Companies Profiled | Atotech Deutschland GMBH, Interplex Holdings Pte. Ltd, Kuntz Inc., Pioneer Metal Finishing Inc., Roy Metal Finishing Inc., and Bajaj Electroplaters |
| Additional Attributes | Dollar sales by plating metal and substrate type, regional demand trends, competitive landscape, technological advancements in plating processes, automation integration, environmental compliance, and quality assurance systems |
The global electroplating market is estimated to be valued at USD 21.7 billion in 2025.
The market size for the electroplating market is projected to reach USD 32.4 billion by 2035.
The electroplating market is expected to grow at a 4.1% CAGR between 2025 and 2035.
The key product types in electroplating market are nickel, gold, silver, copper, chromium, zinc and others.
In terms of substrate type, base metal plating segment to command 60.0% share in the electroplating market in 2025.


Full Research Suite comprises of:
Market outlook & trends analysis
Interviews & case studies
Strategic recommendations
Vendor profiles & capabilities analysis
5-year forecasts
8 regions and 60+ country-level data splits
Market segment data splits
12 months of continuous data updates
DELIVERED AS:
PDF EXCEL ONLINE
Automotive Electroplating Service Market Size and Share Forecast Outlook 2025 to 2035
Demand for Electroplating Chemicals in EU Size and Share Forecast Outlook 2025 to 2035

Thank you!
You will receive an email from our Business Development Manager. Please be sure to check your SPAM/JUNK folder too.
Chat With
MaRIA