Emulsifiable Concentrates Market Size and Share Forecast Outlook 2025 to 2035

The emulsifiable concentrates market is expected grow from USD 1.2 billion in 2025 and reach approximately USD 1.7 billion by 2035, expanding at a CAGR of around 3.3%.
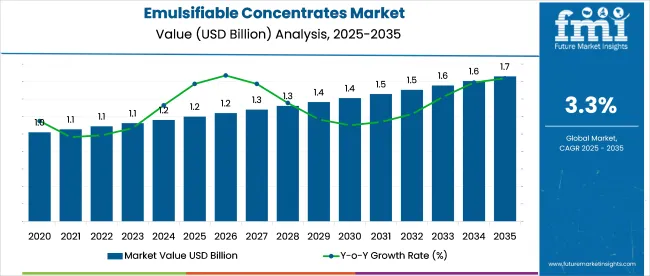
Quick Stats of the Emulsifiable Concentrates Market

  • Industry Size (2025): USD 1.2 billion
  • Industry Value (2035): USD 1.7 billion
  • Forecast CAGR (2025 to 2035): 3.3%
  • Leading Segment: Synthetic Actives (55%)
  • Key Growth Region: Asia Pacific (India)
  • Key Players: Bayer AG, BASF SE, Corteva Agriscience, UPL Limited, Syngenta AG

Emulsifiable Concentrates Market

Attribute Detail
Market Size (2025) USD 1.2 billion
Market Size (2035) USD 1.7 billion
CAGR (2025 to 2035) 3.3%

Growth is being propelled by the versatility of oil-soluble active ingredients and emulsifiers in agricultural and nonagricultural applications, such as foliar sprays and seed treatments.

It is argued that advanced surfactant chemistries and compliance with evolving environmental regulations will distinguish premium formulations. However, it is suggested that formulation complexity and solvent risk may hinder adoption unless solvent free formulations or green emulsifiers are prioritized. Industry consolidation is expected, as leading agrochemical firms integrate EC expertise to streamline their crop-protection portfolios.

In July 2024, Sipcam Agro announced a major expansion of its manufacturing plant in Waynesboro, Mississippi, focused on producing fungicide and insecticide formulations, including emulsifiable concentrates (ECs) and suspension concentrates (SCs). The investment aims to boost production integration, enhance toll manufacturing capabilities, and meet growing demand for high-quality agrochemical formulations in the USA industry.

The facility will feature high-capacity milling systems to support advanced crop protection products. Commenting on the expansion, Brent Marek, CEO & COO of Sipcam Agro USA, stated, “I am very excited about this project, which will increase Sipcam’s production integration in fungicides and insecticides and offer customers additional tolling capabilities. The new plant will have high-capacity mills capable of making the highest quality SCs needed by the market.”

The industry holds a specialized share within its parent markets. In the pesticides and agrochemicals market, it accounts for approximately 15-18%, as emulsifiable concentrates are commonly used for pesticide formulations. Within the chemical market, the share is around 2-3%, as emulsifiable concentrates represent a niche segment of chemical products.

In the agricultural equipment market, the share is approximately 5-7%, driven by their use in combination with spraying equipment. In the fertilizers and plant nutrition market, emulsifiable concentrates contribute about 2-4%, used to enhance nutrient delivery. In the industrial chemicals market, their share is around 1-2%, used in various industrial applications.

Analyzing Emulsifiable Concentrates Market by Top Investment Segments

The industry in 2025 is expected to see synthetic actives leading the active ingredient type segment with 55%, cereals & grains dominating the crop type segment with 35%, insecticides holding the largest application share at 42%, and agriculture representing 67% of the end-user industry.

Agrochemical distributors will lead distribution channels with 52%, while aromatic hydrocarbons will dominate the solvent type segment with 38%. Bottles in various sizes will account for 48% of the packaging format.
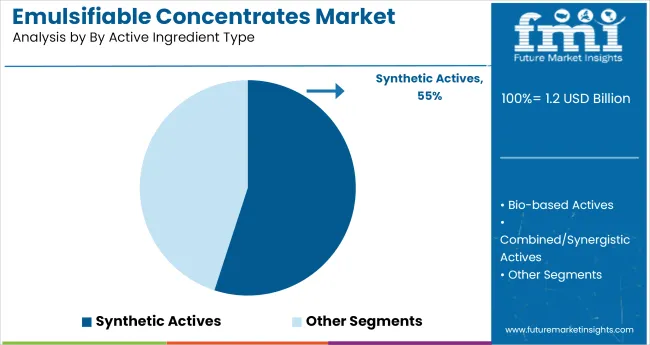
Synthetic actives lead active ingredient type segment with 55% industry share

Emulsifiable Concentrates Market Analysis By Active Ingredient Type

Synthetic actives are expected to account for 55% of the industry share in 2025. These actives are widely used in various emulsifiable concentrates due to their efficacy and cost-effectiveness in controlling pests, diseases, and weeds in agricultural settings.

Synthetic active ingredients, such as organophosphates and pyrethroids, offer high potency, long-lasting effects, and broad-spectrum activity. The strong demand for effective and reliable crop protection products in both commercial farming and home gardening applications is driving the continued dominance of synthetic actives in the industry.
  • Highly effective and cost-efficient for pest control in agriculture
  • Provide long-lasting effects and broad-spectrum activity in emulsifiable concentrates
  • Increasing demand for reliable crop protection products drives industry dominance

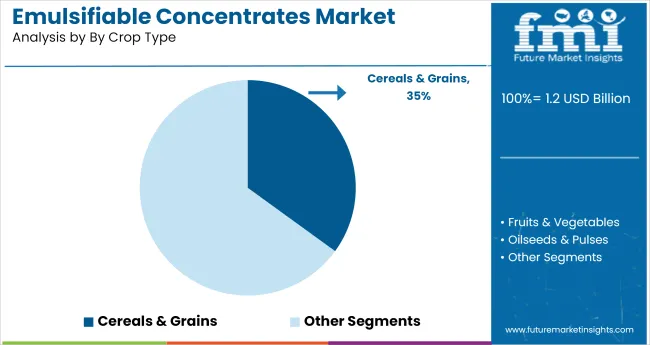
Cereals & grains dominate crop type segment with 35% industry share

Emulsifiable Concentrates Market Analysis By Crop Type

Cereals & grains are expected to capture 35% of the crop type segment in 2025, making it the dominant crop category for emulsifiable concentrate applications. The high demand for cereals and grains like wheat, rice, and corn globally, along with the need for effective crop protection against pests and diseases, contributes to the dominance of this segment.

Emulsifiable concentrates, particularly insecticides and herbicides, are widely used to maintain crop yields and ensure the health of cereal and grain crops. As global food demand rises, the need for these products in cereals and grains continues to grow.
  • High demand for cereals and grains drives the adoption of emulsifiable concentrates
  • Used to protect crops from pests and diseases, ensuring stable yields
  • Essential for maintaining crop health and increasing food production efficiency

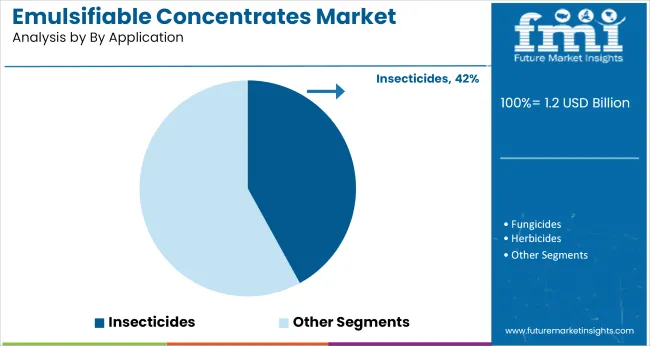
Insecticides lead application segment with 42% industry share

Emulsifiable Concentrates Market Analysis By Application

Insecticides are projected to hold 42% of the industry share in 2025, driven by the growing need to control insect pests that damage crops and reduce yields. Insecticides, such as pyrethroids and neonicotinoids, are widely used to protect various crops from insect infestation.

The increasing prevalence of pests, coupled with the rise in organic farming and the need for sustainable pest control, further reinforces insecticides’ dominant position in the industry. The growing agricultural focus on integrated pest management (IPM) strategies continues to drive the demand for effective insecticides.
  • Used extensively in pest control to maintain crop yields and prevent damage
  • Growing demand for sustainable and organic farming techniques increases insecticide use
  • Essential in integrated pest management (IPM) strategies for modern agriculture

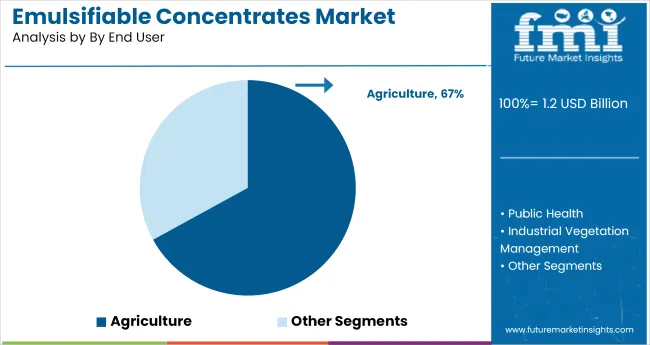
Agriculture leads end-user segment with 67% industry share

Emulsifiable Concentrates Market Analysis By End User

Agriculture is expected to capture 67% of the industry share in 2025. Agriculture remains the primary end-user for emulsifiable concentrates, driven by the need for high-performance crop protection solutions. The increasing focus on enhancing crop yields, managing pest resistance, and improving food security is pushing the demand for emulsifiable concentrates in agricultural settings.

As farmers continue to prioritize efficient pest management and crop protection, the agriculture sector will remain the largest consumer of emulsifiable concentrates in the industry.
  • Agriculture remains the key end-user for crop protection solutions
  • Increasing demand for high-performance, effective pest control solutions in farming
  • Focus on enhancing crop yields and food security boosts emulsifiable concentrate use

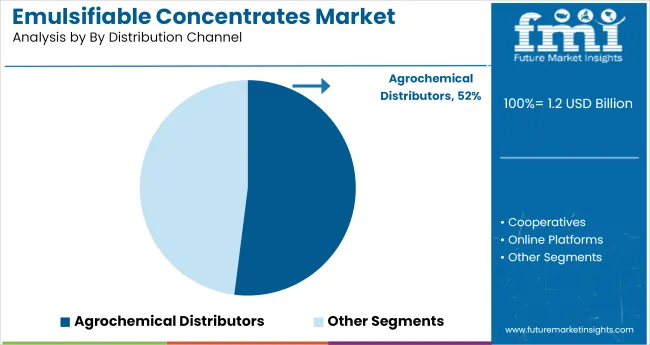
Agrochemical distributors lead distribution channel with 52% industry share

Emulsifiable Concentrates Market Analysis By Distribution Channel

Agrochemical distributors are projected to hold 52% of the industry share in 2025, becoming the dominant distribution channel for emulsifiable concentrates. These distributors play a crucial role in ensuring the availability of emulsifiable concentrates to farmers and agricultural enterprises.

They supply a range of crop protection products through various retail outlets, including farm supply stores and online platforms. As demand for crop protection solutions increases, agrochemical distributors continue to strengthen their industry position by providing a wide variety of products and ensuring timely delivery to agricultural end-users.
  • Vital in ensuring the availability of emulsifiable concentrates to farmers
  • Offer a wide range of products, including pesticides and herbicides, to agricultural users
  • Ensure timely delivery and access to products, boosting industry demand and growth

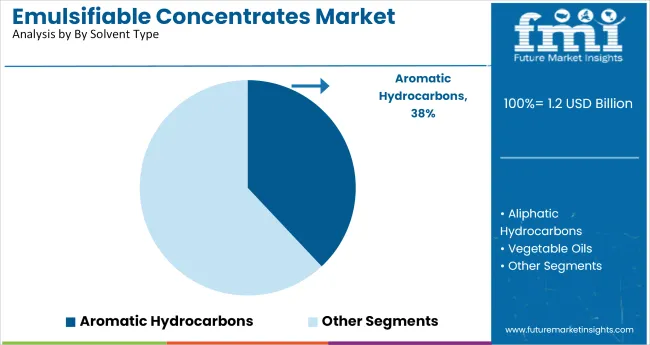
Aromatic hydrocarbons dominate solvent type segment with 38% industry share

Emulsifiable Concentrates Market Analysis By Solvent Type

Aromatic hydrocarbons are expected to capture 38% of the solvent type segment in 2025. These solvents are essential in the formulation of emulsifiable concentrates due to their ability to dissolve both water and oil-based components, ensuring proper dispersion and effectiveness in agricultural applications.

Aromatic hydrocarbons offer superior solubility and stability, making them the solvent of choice for many agricultural chemical products. Their widespread use in the formulation of herbicides, insecticides, and fungicides continues to drive their dominance in the industry.
  • Essential for ensuring proper dispersion and solubility in emulsifiable concentrates
  • Widely used in the formulation of herbicides, insecticides, and fungicides
  • Offers superior solubility, stability, and effectiveness in agricultural applications

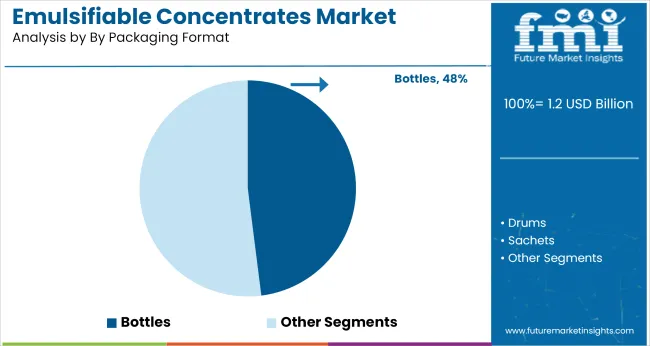
Bottles (<1L, 1-5L, >5L) lead packaging format segment with 48% industry share

Emulsifiable Concentrates Market Analysis By Packaging Format

Bottles in various sizes are expected to account for 48% of the packaging format industry share in 2025. Bottles are widely used for emulsifiable concentrates due to their convenience, ease of handling, and ability to preserve product stability.

Packaging in bottles allows for precise dosing, ensuring the efficient use of the product, whether for commercial or home use. The growing demand for small-scale and large-scale agricultural applications drives the adoption of different bottle sizes, from less than 1 liter to more than 5 liters.

  • Convenient packaging for both small and large-scale agricultural applications
  • Bottles allow for precise dosing, ensuring efficient use of emulsifiable concentrates
  • Widely preferred for their ability to preserve product stability and ease of use

Top Emulsifiable Concentrates Market Dynamics

The emulsifiable concentrates (EC) industry is experiencing growth due to their effectiveness and ease of application in pest control. However, challenges such as environmental concerns, regulatory restrictions, and the development of pest resistance are limiting broader adoption.

High Efficacy and Cost-Effectiveness Drive Adoption

Emulsifiable concentrates are gaining popularity in pest control applications due to their high efficacy and cost-effectiveness. These formulations allow for the active ingredient to be easily mixed with water, ensuring uniform distribution and effective pest management. Their versatility in various applications, including agriculture, public health, and residential pest control, contributes to their widespread use. Additionally, EC formulations often require less agitation during application, making them convenient for users.

  • High efficacy ensures effective pest control.
  • Cost-effectiveness appeals to budget-conscious consumers.
  • Versatility across multiple applications enhances industry reach.

Environmental and Regulatory Challenges Impact Growth

Despite their advantages, emulsifiable concentrates face challenges related to environmental concerns and regulatory restrictions. The use of certain solvents in EC formulations can lead to environmental pollution if not managed properly. Additionally, stringent regulations regarding pesticide residues and environmental impact assessments can delay product approvals and limit industry access. These factors necessitate ongoing research and development to create safer and more environmentally friendly EC formulations.
  • Environmental concerns necessitate safer formulations.
  • Stringent regulations can delay product approvals.
  • Pest resistance development challenges long-term effectiveness.

Top Countries Developing, Applying, and Regulating Emulsifiable Concentrates

Country Wise Analysis Of Emulsifiable Concentrates Market

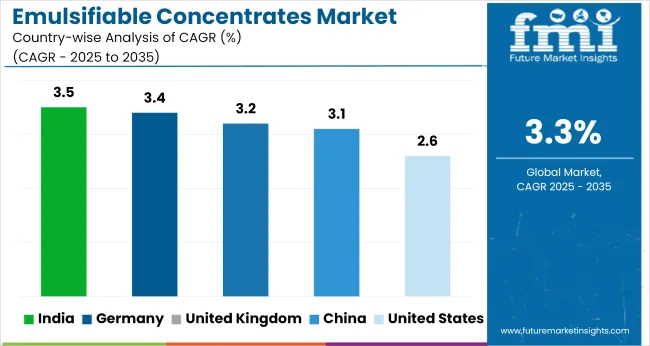
Countries CAGR (2025 to 2035)
United States 2.6%
United Kingdom 3.2%
China 3.1%
India 3.5%
Germany 3.4%

Global industry demand is projected to rise at a 3.3% CAGR from 2025 to 2035. Of the five profiled countries out of 40 covered, India leads at 3.5%, followed by Germany at 3.4%, and the United Kingdom at 3.2%, while China posts 3.1% and the United States records 2.6%.

These rates translate to a growth premium of +6% for India, -3% for China, and -7% for the United States versus the baseline, while Germany and the United Kingdom show moderate growth. Divergence reflects local catalysts: increasing demand for agricultural chemicals in India, strong industry stability in Germany and the United Kingdom, and slower growth in more mature industries like the United States and China.

Growth Outlook of Emulsifiable Concentrates Market in the United States

The industry in the United States is expected to grow at a CAGR of 2.6% from 2025 to 2035. Growth remains dependent on large-scale crop protection programs, primarily in corn, cotton, and soybean cultivation. Emulsifiable formulations are being integrated into integrated pest management systems where low-volume, high-efficiency delivery is prioritized.

Domestic agrochemical manufacturers continue to reformulate legacy active ingredients into ECs with improved solvency and field stability. Regulatory mandates on surfactant types and VOC content have influenced R&D in adjuvant chemistry. Distribution across cooperatives and agro-dealer networks supports national coverage for seasonal demand spikes.

  • Chlorpyrifos alternatives in EC form are now deployed for regional soybean pest control.
  • Low-foam emulsifiable blends are promoted for aerial application in midwestern states.
  • Ag-retailers have expanded private-label EC portfolios focused on glyphosate compatibility.

United Kingdom Emulsifiable Concentrates Market Analysis

The industry in the United Kingdom is forecast to grow at a CAGR of 3.2% between 2025 and 2035. This is shaped by restrictions on synthetic pesticide formulations and rising demand for bio-based ECs. Adoption is highest in fruit and vegetable sectors, particularly in Scotland and southern England, where protected cultivation requires precise crop protection delivery.

Brexit-related changes in agrochemical import protocols have led to regional blending and repackaging operations. Demand for tank-mix compatible ECs is increasing among agronomists working in fragmented, small-scale farms across the UK

  • Copper and sulfur emulsions are favored in horticulture for organic pest resistance strategies.
  • Crop advisors are shifting to EC formulations with minimized phytotoxicity risk in root vegetables.
  • Local blending partners are contracted for UK-compliant EC repackaging to address post-Brexit bottlenecks.

The Emulsifiable Concentrates Market Forecast in China

The industry in China is projected to expand at a CAGR of 3.1% from 2025 to 2035. Demand is concentrated in rice, citrus, and cotton production zones. Regulatory enforcement on formulation toxicity and residual content has intensified reformulation activities. Domestic companies are deploying solvent-free or modified solvent ECs, especially in provinces with stricter environmental policies.

Imports of active ingredients for ECs are channeled into licensed contract formulation facilities. Agrochemical e-commerce channels are boosting EC sales in secondary cities.

  • Province-led regulations have capped xylene and toluene levels in emulsifiable pesticides.
  • Emulsifiable neem and matrine-based products are replacing banned insecticides in trial programs
  • Government-backed cooperatives are bulk-ordering ECs for communal spraying programs.

Emulsifiable Concentrates Market Growth Trajectory in India

The industry in India is forecast to grow at a CAGR of 3.5% between 2025 and 2035, the fastest among the countries analyzed. ECs are preferred in pulses, cotton, and oilseed crops due to their ease of mixing and rapid pest knockdown. Manufacturers are increasingly replacing solvent carriers with bio-derived hydrocarbons to meet safety compliance.

Sales through krishikendras and rural input shops remain dominant, with private firms supporting training initiatives to increase correct EC usage. Blended EC packs with multiple actives are favored by smallholder farmers seeking broader pest coverage.

  • State-level farm mechanization subsidies include training on emulsifiable insecticide use.
  • Manufacturers are phasing out diesel-based solvents in favor of low-toxicity hydrocarbons.
  • Retail bundling of sprayers and EC packs has improved adoption in eastern India.

Germany Emulsifiable Concentrates Market Insights

The industry in Germany is expected to grow at a CAGR of 3.4% from 2025 to 2035. Use is concentrated in vineyards, horticulture, and oilseed farms. Reformulated ECs with biodegradable solvents are being tested under EU Green Deal compliance standards.

German cooperatives and ag-retail chains prefer ECs that offer tank-mix flexibility with micronutrient foliar sprays. Technical service providers offer on-field compatibility testing to reduce formulation errors. Consumer awareness and regulatory strictness have made synthetic solvent-based ECs less acceptable in retail agriculture.
  • Vineyard growers in Baden-Württemberg are piloting natural ECs to comply with residue-free export protocols.
  • Multi-functional ECs with dual herbicide and fungicide activity are used in large-scale rapeseed farms.
  • Blended solvent ECs are phased out in German agro-retail as per harmonized EU labeling mandates.

Leading Emulsifiable Concentrates Market

Emulsifiable Concentrates Market Analysis By Company

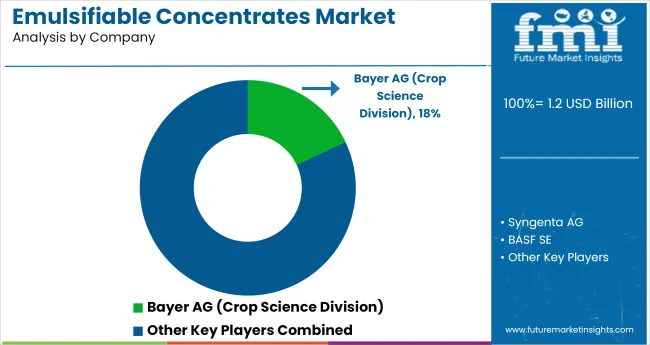
Leading Company - Bayer AG

Industry Share - 18%

In the industry, leading firms like BASF, Syngenta, Bayer, Corteva, and UPL have focused on expanding formulation compatibility, crop-specific efficacy, and regulatory compliance to gain distributor loyalty. Concentrates tailored for cereals, fruits, and pulses are being scaled through backward-integrated sourcing of actives such as organophosphates and pyrethroids.

India-based UPL has deepened its ASEAN footprint by offering localized emulsions through cooperatives and private-label tie-ups. In Europe, Corteva and Bayer emphasize traceability and residue control, aligning products with farm-input standards. Online procurement remains limited, but direct-to-farm pilots have emerged in the USA and Vietnam. Product innovation is being constrained by label restrictions, pushing suppliers to emphasize formulation agility over novel molecule development.

Recent Industry Developments

  • In February 2025, Sipcam Agro USA opened a 12,000 sq ft formulation and packaging plant in Waynesboro, Mississippi. The facility manufactures both emulsifiable concentrates (EC) and soluble concentrates (SC), enhancing production efficiency, cost control, and distribution via nearby Gulf ports.
  • In June 2025, Albaugh introduced Ammari®, a next-generation pyraclostrobin-based fungicide now registered in the Czech Republic. Available as an EC formulation at 20% concentration, Ammari® offers preventive and curative protection for wheat, barley, rye, and triticale

Leading Players

  • BASF SE
  • Syngenta AG (a subsidiary of ChemChina) - still operational
  • Bayer AG (Crop Science Division)
  • Corteva Agriscience
  • UPL Ltd.

Report Scope

Report Attributes Details
Industry Size (2025) USD 1.2 billion
Industry Value (2035) USD 1.7 billion
Forecast CAGR (2025 to 2035) 3.3%
Base Year for Estimation 2024
Historical Period 2020 to 2024
Projections Period 2025 to 2035
Quantitative Units USD billion for value and kilotons for volume
Active Ingredient Type Segmentation Synthetic Actives (Organophosphates, Pyrethroids, Neonicotinoids, Carbamates), Bio-based Actives (Neem Oil, Pyrethrins, Essential Oils, Fatty Acids), Combined/Synergistic Actives
Crop Type Segmentation Cereals & Grains, Fruits & Vegetables, Oilseeds & Pulses, Turf & Ornamentals, Plantation Crops
Application Segmentation Insecticides, Fungicides, Herbicides, Acaricides, Nematicides
End-User Segmentation Agriculture, Public Health, Industrial Vegetation Management, Animal Health
Distribution Channel Segmentation Agrochemical Distributors, Cooperatives, Online Platforms, Direct-to-Farm
Solvent Type Segmentation Aromatic Hydrocarbons, Aliphatic Hydrocarbons, Vegetable Oils, Alcohols, Others (Esters, Glycols)
Packaging Format Segmentation Bottles (less than 1L, 1-5L, and above 5L), Drums, Sachets
Regions Covered North America, Latin America, Europe, South Asia & Pacific, East Asia, Middle East & Africa
Countries Covered United States, Canada, Mexico, Brazil, Argentina, Germany, France, United Kingdom, Italy, Spain, Netherlands, China, India, Japan, South Korea, Australia, New Zealand, GCC Countries, South Africa
Leading Players BASF SE, Syngenta AG (a subsidiary of ChemChina), Bayer AG (Crop Science Division), Corteva Agriscience, UPL Ltd.
Additional Attributes Dollar sales by active ingredient type, crop type, application, and packaging format, increasing demand for eco-friendly and bio-based formulations, expanding distribution channels, and regional variations in agrochemical adoption.

Key Segments

By Active Ingredient Type:

Segmentation includes synthetic actives such as organophosphates, pyrethroids, neonicotinoids, and carbamates; bio-based actives such as neem oil, pyrethrins, essential oils, and fatty acids; and combined/synergistic actives.

By Crop Type:

Crop-based categories comprise cereals & grains, fruits & vegetables, oilseeds & pulses, turf & ornamentals, and plantation crops.

By Application:

Applications include insecticides, fungicides, herbicides, acaricides, and nematicides.

By End User:

End-user segmentation includes agriculture, public health, industrial vegetation management, and animal health.

By Distribution Channel:

Distribution channels include agrochemical distributors, cooperatives, online platforms, and direct-to-farm.

By Solvent Type:

Solvent types covered are aromatic hydrocarbons, aliphatic hydrocarbons, vegetable oils, alcohols, and others such as esters and glycols.

By Packaging Format:

Packaging options include Bottles (less than 1L, 1-5L, and above 5L), Drums, and Sachets.

By Region:

Regional segmentation includes North America, Latin America, Europe, South Asia & Pacific, East Asia, and Middle East & Africa.

Table of Content

  1. Executive Summary
    • Global Market Outlook
    • Demand-side Trends
    • Supply-side Trends
    • Technology Roadmap Analysis
    • Analysis and Recommendations
  2. Market Overview
    • Market Coverage/Taxonomy
    • Market Definition/Scope/Limitations
  3. Market Background
    • Market Dynamics
      • Drivers
      • Restraints
      • Opportunity
      • Trends
    • Scenario Forecast
      • Demand in Optimistic Scenario
      • Demand in Likely Scenario
      • Demand in Conservative Scenario
    • Opportunity Map Analysis
    • Product Life Cycle Analysis
    • Supply Chain Analysis
      • Supply Side Participants and their Roles
        • Producers
        • Mid-Level Participants (Traders/ Agents/ Brokers)
        • Wholesalers and Distributors
      • Value Added and Value Created at Node in the Supply Chain
      • List of Raw Material Suppliers
      • List of Existing and Potential Buyer’s
    • Investment Feasibility Matrix
    • Value Chain Analysis
      • Profit Margin Analysis
      • Wholesalers and Distributors
      • Retailers
    • PESTLE and Porter’s Analysis
    • Regulatory Landscape
      • By Key Regions
      • By Key Countries
    • Regional Parent Market Outlook
    • Production and Consumption Statistics
    • Import and Export Statistics
  4. Global Market Analysis 2020 to 2024 and Forecast, 2025 to 2035
    • Historical Market Size Value (USD Billion) & Volume (Kilotons) Analysis, 2020 to 2024
    • Current and Future Market Size Value (USD Billion) & Volume (Kilotons) Projections, 2025 to 2035
      • Y-o-Y Growth Trend Analysis
      • Absolute $ Opportunity Analysis
  5. Global Market Pricing Analysis 2020 to 2024 and Forecast 2025 to 2035
  6. Global Market Analysis 2020 to 2024 and Forecast 2025 to 2035, By Active Ingredient Type
    • Introduction/Key Findings
    • Historical Market Size Value (USD Billion) & Volume (Kilotons) Analysis By Active Ingredient Type, 2020 to 2024
    • Current and Future Market Size Value (USD Billion) & Volume (Kilotons) Analysis and Forecast By Active Ingredient Type, 2025 to 2035
      • Synthetic Actives
        • Organophosphates
        • Pyrethroids
        • Neonicotinoids
        • Carbamates
      • Bio-based Actives
        • Neem Oil
        • Pyrethrins
        • Essential Oils
        • Fatty Acids
      • Combined/Synergistic Actives
    • Y-o-Y Growth Trend Analysis By Active Ingredient Type, 2020 to 2024
    • Absolute $ Opportunity Analysis By Active Ingredient Type, 2025 to 2035
  7. Global Market Analysis 2020 to 2024 and Forecast 2025 to 2035, By Crop Type
    • Introduction/Key Findings
    • Historical Market Size Value (USD Billion) & Volume (Kilotons) Analysis By Crop Type, 2020 to 2024
    • Current and Future Market Size Value (USD Billion) & Volume (Kilotons) Analysis and Forecast By Crop Type, 2025 to 2035
      • Cereals & Grains
      • Fruits & Vegetables
      • Oilseeds & Pulses
      • Turf & Ornamentals
      • Plantation Crops
    • Y-o-Y Growth Trend Analysis By Crop Type, 2020 to 2024
    • Absolute $ Opportunity Analysis By Crop Type, 2025 to 2035
  8. Global Market Analysis 2020 to 2024 and Forecast 2025 to 2035, By Application
    • Introduction/Key Findings
    • Historical Market Size Value (USD Billion) & Volume (Kilotons) Analysis By Application, 2020 to 2024
    • Current and Future Market Size Value (USD Billion) & Volume (Kilotons) Analysis and Forecast By Application, 2025 to 2035
      • Insecticides
      • Fungicides
      • Herbicides
      • Acaricides
      • Nematicides
    • Y-o-Y Growth Trend Analysis By Application, 2020 to 2024
    • Absolute $ Opportunity Analysis By Application, 2025 to 2035
  9. Global Market Analysis 2020 to 2024 and Forecast 2025 to 2035, By End User
    • Introduction/Key Findings
    • Historical Market Size Value (USD Billion) & Volume (Kilotons) Analysis By End User, 2020 to 2024
    • Current and Future Market Size Value (USD Billion) & Volume (Kilotons) Analysis and Forecast By End User, 2025 to 2035
      • Agriculture
      • Public Health
      • Industrial Vegetation Management
      • Animal Health
    • Y-o-Y Growth Trend Analysis By End User, 2020 to 2024
    • Absolute $ Opportunity Analysis By End User, 2025 to 2035
  10. Global Market Analysis 2020 to 2024 and Forecast 2025 to 2035, By Distribution Channel
    • Introduction/Key Findings
    • Historical Market Size Value (USD Billion) & Volume (Kilotons) Analysis By Distribution Channel, 2020 to 2024
    • Current and Future Market Size Value (USD Billion) & Volume (Kilotons) Analysis and Forecast By Distribution Channel, 2025 to 2035
      • Agrochemical Distributors
      • Cooperatives
      • Online Platforms
      • Direct-to-Farm
    • Y-o-Y Growth Trend Analysis By Distribution Channel, 2020 to 2024
    • Absolute $ Opportunity Analysis By Distribution Channel, 2025 to 2035
  11. Global Market Analysis 2020 to 2024 and Forecast 2025 to 2035, By Solvent Type
    • Introduction/Key Findings
    • Historical Market Size Value (USD Billion) & Volume (Kilotons) Analysis By Solvent Type, 2020 to 2024
    • Current and Future Market Size Value (USD Billion) & Volume (Kilotons) Analysis and Forecast By Solvent Type, 2025 to 2035
      • Aromatic Hydrocarbons
      • Aliphatic Hydrocarbons
      • Vegetable Oils
      • Alcohols
      • Others
        • Esters
        • Glycols
    • Y-o-Y Growth Trend Analysis By Solvent Type, 2020 to 2024
    • Absolute $ Opportunity Analysis By Solvent Type, 2025 to 2035
  12. Global Market Analysis 2020 to 2024 and Forecast 2025 to 2035, By Packaging Format
    • Introduction/Key Findings
    • Historical Market Size Value (USD Billion) & Volume (Kilotons) Analysis By Packaging Format, 2020 to 2024
    • Current and Future Market Size Value (USD Billion) & Volume (Kilotons) Analysis and Forecast By Packaging Format, 2025 to 2035
      • Bottles
        • Less Than 1L
        • 1-5L
        • Above 5L
      • Drums
      • Sachets
    • Y-o-Y Growth Trend Analysis By Packaging Format, 2020 to 2024
    • Absolute $ Opportunity Analysis By Packaging Format, 2025 to 2035
  13. Global Market Analysis 2020 to 2024 and Forecast 2025 to 2035, By Region
    • Introduction
    • Historical Market Size Value (USD Billion) & Volume (Kilotons) Analysis By Region, 2020 to 2024
    • Current Market Size Value (USD Billion) & Volume (Kilotons) Analysis and Forecast By Region, 2025 to 2035
      • North America
      • Latin America
      • Western Europe
      • Eastern Europe
      • East Asia
      • South Asia & Pacific
      • Middle East and Africa
    • Market Attractiveness Analysis By Region
  14. North America Market Analysis 2020 to 2024 and Forecast 2025 to 2035, By Country
    • Historical Market Size Value (USD Billion) & Volume (Kilotons) Trend Analysis By Market Taxonomy, 2020 to 2024
    • Market Size Value (USD Billion) & Volume (Kilotons) Forecast By Market Taxonomy, 2025 to 2035
      • By Country
        • USA
        • Canada
        • Mexico
      • By Active Ingredient Type
      • By Crop Type
      • By Application
      • By End User
      • By Distribution Channel
      • By Solvent Type
      • By Packaging Format
    • Market Attractiveness Analysis
      • By Country
      • By Active Ingredient Type
      • By Crop Type
      • By Application
      • By End User
      • By Distribution Channel
      • By Solvent Type
      • By Packaging Format
    • Key Takeaways
  15. Latin America Market Analysis 2020 to 2024 and Forecast 2025 to 2035, By Country
    • Historical Market Size Value (USD Billion) & Volume (Kilotons) Trend Analysis By Market Taxonomy, 2020 to 2024
    • Market Size Value (USD Billion) & Volume (Kilotons) Forecast By Market Taxonomy, 2025 to 2035
      • By Country
        • Brazil
        • Argentina
        • Rest of LATAM
      • By Active Ingredient Type
      • By Crop Type
      • By Application
      • By End User
      • By Distribution Channel
      • By Solvent Type
      • By Packaging Format
    • Market Attractiveness Analysis
      • By Country
      • By Active Ingredient Type
      • By Crop Type
      • By Application
      • By End User
      • By Distribution Channel
      • By Solvent Type
      • By Packaging Format
    • Key Takeaways
  16. Western Europe Market Analysis 2020 to 2024 and Forecast 2025 to 2035, By Country
    • Historical Market Size Value (USD Billion) & Volume (Kilotons) Trend Analysis By Market Taxonomy, 2020 to 2024
    • Market Size Value (USD Billion) & Volume (Kilotons) Forecast By Market Taxonomy, 2025 to 2035
      • By Country
        • Germany
        • Italy
        • France
        • UK
        • Spain
        • BENELUX
        • Nordic
        • Rest of W.Europe
      • By Active Ingredient Type
      • By Crop Type
      • By Application
      • By End User
      • By Distribution Channel
      • By Solvent Type
      • By Packaging Format
    • Market Attractiveness Analysis
      • By Country
      • By Active Ingredient Type
      • By Crop Type
      • By Application
      • By End User
      • By Distribution Channel
      • By Solvent Type
      • By Packaging Format
    • Key Takeaways
  17. Eastern Europe Market Analysis 2020 to 2024 and Forecast 2025 to 2035, By Country
    • Historical Market Size Value (USD Billion) & Volume (Kilotons) Trend Analysis By Market Taxonomy, 2020 to 2024
    • Market Size Value (USD Billion) & Volume (Kilotons) Forecast By Market Taxonomy, 2025 to 2035
      • By Country
        • Russia
        • Hungary
        • Poland
        • Balkan & Baltics
        • Rest of E. Europe
      • By Active Ingredient Type
      • By Crop Type
      • By Application
      • By End User
      • By Distribution Channel
      • By Solvent Type
      • By Packaging Format
    • Market Attractiveness Analysis
      • By Country
      • By Active Ingredient Type
      • By Crop Type
      • By Application
      • By End User
      • By Distribution Channel
      • By Solvent Type
      • By Packaging Format
    • Key Takeaways
  18. East Asia Market Analysis 2020 to 2024 and Forecast 2025 to 2035, By Country
    • Historical Market Size Value (USD Billion) & Volume (Kilotons) Trend Analysis By Market Taxonomy, 2020 to 2024
    • Market Size Value (USD Billion) & Volume (Kilotons) Forecast By Market Taxonomy, 2025 to 2035
      • By Country
        • China
        • Japan
        • South Korea
      • By Active Ingredient Type
      • By Crop Type
      • By Application
      • By End User
      • By Distribution Channel
      • By Solvent Type
      • By Packaging Format
    • Market Attractiveness Analysis
      • By Country
      • By Active Ingredient Type
      • By Crop Type
      • By Application
      • By End User
      • By Distribution Channel
      • By Solvent Type
      • By Packaging Format
    • Key Takeaways
  19. South Asia & Pacific Market Analysis 2020 to 2024 and Forecast 2025 to 2035, By Country
    • Historical Market Size Value (USD Billion) & Volume (Kilotons) Trend Analysis By Market Taxonomy, 2020 to 2024
    • Market Size Value (USD Billion) & Volume (Kilotons) Forecast By Market Taxonomy, 2025 to 2035
      • By Country
        • India
        • Australia & New Zealand
        • ASEAN
        • Rest of SAP
      • By Active Ingredient Type
      • By Crop Type
      • By Application
      • By End User
      • By Distribution Channel
      • By Solvent Type
      • By Packaging Format
    • Market Attractiveness Analysis
      • By Country
      • By Active Ingredient Type
      • By Crop Type
      • By Application
      • By End User
      • By Distribution Channel
      • By Solvent Type
      • By Packaging Format
    • Key Takeaways
  20. Middle East and Africa Market Analysis 2020 to 2024 and Forecast 2025 to 2035, By Country
    • Historical Market Size Value (USD Billion) & Volume (Kilotons) Trend Analysis By Market Taxonomy, 2020 to 2024
    • Market Size Value (USD Billion) & Volume (Kilotons) Forecast By Market Taxonomy, 2025 to 2035
      • By Country
        • GCC Countries
        • Northern Africa
        • South Africa
        • Turkiye
        • Rest of MEA
      • By Active Ingredient Type
      • By Crop Type
      • By Application
      • By End User
      • By Distribution Channel
      • By Solvent Type
      • By Packaging Format
    • Market Attractiveness Analysis
      • By Country
      • By Active Ingredient Type
      • By Crop Type
      • By Application
      • By End User
      • By Distribution Channel
      • By Solvent Type
      • By Packaging Format
    • Key Takeaways
  21. Key Countries Market Analysis
    • USA
      • Pricing Analysis
      • Market Share Analysis, 2024
        • By Active Ingredient Type
        • By Crop Type
        • By Application
        • By End User
        • By Distribution Channel
        • By Solvent Type
        • By Packaging Format
    • Canada
      • Pricing Analysis
      • Market Share Analysis, 2024
        • By Active Ingredient Type
        • By Crop Type
        • By Application
        • By End User
        • By Distribution Channel
        • By Solvent Type
        • By Packaging Format
    • Brazil
      • Pricing Analysis
      • Market Share Analysis, 2024
        • By Active Ingredient Type
        • By Crop Type
        • By Application
        • By End User
        • By Distribution Channel
        • By Solvent Type
        • By Packaging Format
    • Mexico
      • Pricing Analysis
      • Market Share Analysis, 2024
        • By Active Ingredient Type
        • By Crop Type
        • By Application
        • By End User
        • By Distribution Channel
        • By Solvent Type
        • By Packaging Format
    • Argentina
      • Pricing Analysis
      • Market Share Analysis, 2024
        • By Active Ingredient Type
        • By Crop Type
        • By Application
        • By End User
        • By Distribution Channel
        • By Solvent Type
        • By Packaging Format
  22. Market Structure Analysis
    • Competition Dashboard
    • Competition Benchmarking
    • Market Share Analysis of Top Players
      • By Regional
      • By Active Ingredient Type
      • By Crop Type
      • By Application
      • By End User
      • By Distribution Channel
      • By Solvent Type
      • By Packaging Format
  23. Competition Analysis
    • Competition Deep Dive
      • BASF SE
        • Overview
        • Product Portfolio
        • Profitability by Market Segments (Product/Age /Sales Channel/Region)
        • Sales Footprint
        • Strategy Overview
          • Marketing Strategy
          • Product Strategy
          • Channel Strategy
      • Syngenta AG (a subsidiary of ChemChina) - still operational
        • Overview
        • Product Portfolio
        • Profitability by Market Segments (Product/Age /Sales Channel/Region)
        • Sales Footprint
        • Strategy Overview
          • Marketing Strategy
          • Product Strategy
          • Channel Strategy
      • Bayer AG (Crop Science Division)
        • Overview
        • Product Portfolio
        • Profitability by Market Segments (Product/Age /Sales Channel/Region)
        • Sales Footprint
        • Strategy Overview
          • Marketing Strategy
          • Product Strategy
          • Channel Strategy
      • Corteva Agriscience
        • Overview
        • Product Portfolio
        • Profitability by Market Segments (Product/Age /Sales Channel/Region)
        • Sales Footprint
        • Strategy Overview
          • Marketing Strategy
          • Product Strategy
          • Channel Strategy
      • UPL Ltd.
        • Overview
        • Product Portfolio
        • Profitability by Market Segments (Product/Age /Sales Channel/Region)
        • Sales Footprint
        • Strategy Overview
          • Marketing Strategy
          • Product Strategy
          • Channel Strategy
  24. Assumptions & Acronyms Used
  25. Research Methodology

List of Tables

  • Table 1: Global Market Value (USD Billion) Forecast by Region, 2020-2035
  • Table 2: Global Market Volume (Kilotons) Forecast by Region, 2020-2035
  • Table 3: Global Market Value (USD Billion) Forecast by Active Ingredient Type, 2020-2035
  • Table 4: Global Market Volume (Kilotons) Forecast by Active Ingredient Type, 2020-2035
  • Table 5: Global Market Value (USD Billion) Forecast by Crop Type, 2020-2035
  • Table 6: Global Market Volume (Kilotons) Forecast by Crop Type, 2020-2035
  • Table 7: Global Market Value (USD Billion) Forecast by Application, 2020-2035
  • Table 8: Global Market Volume (Kilotons) Forecast by Application, 2020-2035
  • Table 9: Global Market Value (USD Billion) Forecast by End User, 2020-2035
  • Table 10: Global Market Volume (Kilotons) Forecast by End User, 2020-2035
  • Table 11: Global Market Value (USD Billion) Forecast by Distribution Channel, 2020-2035
  • Table 12: Global Market Volume (Kilotons) Forecast by Distribution Channel, 2020-2035
  • Table 13: Global Market Value (USD Billion) Forecast by Solvent Type, 2020-2035
  • Table 14: Global Market Volume (Kilotons) Forecast by Solvent Type, 2020-2035
  • Table 15: Global Market Value (USD Billion) Forecast by Packaging Format, 2020-2035
  • Table 16: Global Market Volume (Kilotons) Forecast by Packaging Format, 2020-2035
  • Table 17: North America Market Value (USD Billion) Forecast by Country, 2020-2035
  • Table 18: North America Market Volume (Kilotons) Forecast by Country, 2020-2035
  • Table 19: North America Market Value (USD Billion) Forecast by Active Ingredient Type, 2020-2035
  • Table 20: North America Market Volume (Kilotons) Forecast by Active Ingredient Type, 2020-2035
  • Table 21: North America Market Value (USD Billion) Forecast by Crop Type, 2020-2035
  • Table 22: North America Market Volume (Kilotons) Forecast by Crop Type, 2020-2035
  • Table 23: North America Market Value (USD Billion) Forecast by Application, 2020-2035
  • Table 24: North America Market Volume (Kilotons) Forecast by Application, 2020-2035
  • Table 25: North America Market Value (USD Billion) Forecast by End User, 2020-2035
  • Table 26: North America Market Volume (Kilotons) Forecast by End User, 2020-2035
  • Table 27: North America Market Value (USD Billion) Forecast by Distribution Channel, 2020-2035
  • Table 28: North America Market Volume (Kilotons) Forecast by Distribution Channel, 2020-2035
  • Table 29: North America Market Value (USD Billion) Forecast by Solvent Type, 2020-2035
  • Table 30: North America Market Volume (Kilotons) Forecast by Solvent Type, 2020-2035
  • Table 31: North America Market Value (USD Billion) Forecast by Packaging Format, 2020-2035
  • Table 32: North America Market Volume (Kilotons) Forecast by Packaging Format, 2020-2035
  • Table 33: Latin America Market Value (USD Billion) Forecast by Country, 2020-2035
  • Table 34: Latin America Market Volume (Kilotons) Forecast by Country, 2020-2035
  • Table 35: Latin America Market Value (USD Billion) Forecast by Active Ingredient Type, 2020-2035
  • Table 36: Latin America Market Volume (Kilotons) Forecast by Active Ingredient Type, 2020-2035
  • Table 37: Latin America Market Value (USD Billion) Forecast by Crop Type, 2020-2035
  • Table 38: Latin America Market Volume (Kilotons) Forecast by Crop Type, 2020-2035
  • Table 39: Latin America Market Value (USD Billion) Forecast by Application, 2020-2035
  • Table 40: Latin America Market Volume (Kilotons) Forecast by Application, 2020-2035
  • Table 41: Latin America Market Value (USD Billion) Forecast by End User, 2020-2035
  • Table 42: Latin America Market Volume (Kilotons) Forecast by End User, 2020-2035
  • Table 43: Latin America Market Value (USD Billion) Forecast by Distribution Channel, 2020-2035
  • Table 44: Latin America Market Volume (Kilotons) Forecast by Distribution Channel, 2020-2035
  • Table 45: Latin America Market Value (USD Billion) Forecast by Solvent Type, 2020-2035
  • Table 46: Latin America Market Volume (Kilotons) Forecast by Solvent Type, 2020-2035
  • Table 47: Latin America Market Value (USD Billion) Forecast by Packaging Format, 2020-2035
  • Table 48: Latin America Market Volume (Kilotons) Forecast by Packaging Format, 2020-2035
  • Table 49: Western Europe Market Value (USD Billion) Forecast by Country, 2020-2035
  • Table 50: Western Europe Market Volume (Kilotons) Forecast by Country, 2020-2035
  • Table 51: Western Europe Market Value (USD Billion) Forecast by Active Ingredient Type, 2020-2035
  • Table 52: Western Europe Market Volume (Kilotons) Forecast by Active Ingredient Type, 2020-2035
  • Table 53: Western Europe Market Value (USD Billion) Forecast by Crop Type, 2020-2035
  • Table 54: Western Europe Market Volume (Kilotons) Forecast by Crop Type, 2020-2035
  • Table 55: Western Europe Market Value (USD Billion) Forecast by Application, 2020-2035
  • Table 56: Western Europe Market Volume (Kilotons) Forecast by Application, 2020-2035
  • Table 57: Western Europe Market Value (USD Billion) Forecast by End User, 2020-2035
  • Table 58: Western Europe Market Volume (Kilotons) Forecast by End User, 2020-2035
  • Table 59: Western Europe Market Value (USD Billion) Forecast by Distribution Channel, 2020-2035
  • Table 60: Western Europe Market Volume (Kilotons) Forecast by Distribution Channel, 2020-2035
  • Table 61: Western Europe Market Value (USD Billion) Forecast by Solvent Type, 2020-2035
  • Table 62: Western Europe Market Volume (Kilotons) Forecast by Solvent Type, 2020-2035
  • Table 63: Western Europe Market Value (USD Billion) Forecast by Packaging Format, 2020-2035
  • Table 64: Western Europe Market Volume (Kilotons) Forecast by Packaging Format, 2020-2035
  • Table 65: Eastern Europe Market Value (USD Billion) Forecast by Country, 2020-2035
  • Table 66: Eastern Europe Market Volume (Kilotons) Forecast by Country, 2020-2035
  • Table 67: Eastern Europe Market Value (USD Billion) Forecast by Active Ingredient Type, 2020-2035
  • Table 68: Eastern Europe Market Volume (Kilotons) Forecast by Active Ingredient Type, 2020-2035
  • Table 69: Eastern Europe Market Value (USD Billion) Forecast by Crop Type, 2020-2035
  • Table 70: Eastern Europe Market Volume (Kilotons) Forecast by Crop Type, 2020-2035
  • Table 71: Eastern Europe Market Value (USD Billion) Forecast by Application, 2020-2035
  • Table 72: Eastern Europe Market Volume (Kilotons) Forecast by Application, 2020-2035
  • Table 73: Eastern Europe Market Value (USD Billion) Forecast by End User, 2020-2035
  • Table 74: Eastern Europe Market Volume (Kilotons) Forecast by End User, 2020-2035
  • Table 75: Eastern Europe Market Value (USD Billion) Forecast by Distribution Channel, 2020-2035
  • Table 76: Eastern Europe Market Volume (Kilotons) Forecast by Distribution Channel, 2020-2035
  • Table 77: Eastern Europe Market Value (USD Billion) Forecast by Solvent Type, 2020-2035
  • Table 78: Eastern Europe Market Volume (Kilotons) Forecast by Solvent Type, 2020-2035
  • Table 79: Eastern Europe Market Value (USD Billion) Forecast by Packaging Format, 2020-2035
  • Table 80: Eastern Europe Market Volume (Kilotons) Forecast by Packaging Format, 2020-2035
  • Table 81: East Asia Market Value (USD Billion) Forecast by Country, 2020-2035
  • Table 82: East Asia Market Volume (Kilotons) Forecast by Country, 2020-2035
  • Table 83: East Asia Market Value (USD Billion) Forecast by Active Ingredient Type, 2020-2035
  • Table 84: East Asia Market Volume (Kilotons) Forecast by Active Ingredient Type, 2020-2035
  • Table 85: East Asia Market Value (USD Billion) Forecast by Crop Type, 2020-2035
  • Table 86: East Asia Market Volume (Kilotons) Forecast by Crop Type, 2020-2035
  • Table 87: East Asia Market Value (USD Billion) Forecast by Application, 2020-2035
  • Table 88: East Asia Market Volume (Kilotons) Forecast by Application, 2020-2035
  • Table 89: East Asia Market Value (USD Billion) Forecast by End User, 2020-2035
  • Table 90: East Asia Market Volume (Kilotons) Forecast by End User, 2020-2035
  • Table 91: East Asia Market Value (USD Billion) Forecast by Distribution Channel, 2020-2035
  • Table 92: East Asia Market Volume (Kilotons) Forecast by Distribution Channel, 2020-2035
  • Table 93: East Asia Market Value (USD Billion) Forecast by Solvent Type, 2020-2035
  • Table 94: East Asia Market Volume (Kilotons) Forecast by Solvent Type, 2020-2035
  • Table 95: East Asia Market Value (USD Billion) Forecast by Packaging Format, 2020-2035
  • Table 96: East Asia Market Volume (Kilotons) Forecast by Packaging Format, 2020-2035
  • Table 97: South Asia & Pacific Market Value (USD Billion) Forecast by Country, 2020-2035
  • Table 98: South Asia & Pacific Market Volume (Kilotons) Forecast by Country, 2020-2035
  • Table 99: South Asia & Pacific Market Value (USD Billion) Forecast by Active Ingredient Type, 2020-2035
  • Table 100: South Asia & Pacific Market Volume (Kilotons) Forecast by Active Ingredient Type, 2020-2035
  • Table 101: South Asia & Pacific Market Value (USD Billion) Forecast by Crop Type, 2020-2035
  • Table 102: South Asia & Pacific Market Volume (Kilotons) Forecast by Crop Type, 2020-2035
  • Table 103: South Asia & Pacific Market Value (USD Billion) Forecast by Application, 2020-2035
  • Table 104: South Asia & Pacific Market Volume (Kilotons) Forecast by Application, 2020-2035
  • Table 105: South Asia & Pacific Market Value (USD Billion) Forecast by End User, 2020-2035
  • Table 106: South Asia & Pacific Market Volume (Kilotons) Forecast by End User, 2020-2035
  • Table 107: South Asia & Pacific Market Value (USD Billion) Forecast by Distribution Channel, 2020-2035
  • Table 108: South Asia & Pacific Market Volume (Kilotons) Forecast by Distribution Channel, 2020-2035
  • Table 109: South Asia & Pacific Market Value (USD Billion) Forecast by Solvent Type, 2020-2035
  • Table 110: South Asia & Pacific Market Volume (Kilotons) Forecast by Solvent Type, 2020-2035
  • Table 111: South Asia & Pacific Market Value (USD Billion) Forecast by Packaging Format, 2020-2035
  • Table 112: South Asia & Pacific Market Volume (Kilotons) Forecast by Packaging Format, 2020-2035
  • Table 113: Middle East and Africa Market Value (USD Billion) Forecast by Country, 2020-2035
  • Table 114: Middle East and Africa Market Volume (Kilotons) Forecast by Country, 2020-2035
  • Table 115: Middle East and Africa Market Value (USD Billion) Forecast by Active Ingredient Type, 2020-2035
  • Table 116: Middle East and Africa Market Volume (Kilotons) Forecast by Active Ingredient Type, 2020-2035
  • Table 117: Middle East and Africa Market Value (USD Billion) Forecast by Crop Type, 2020-2035
  • Table 118: Middle East and Africa Market Volume (Kilotons) Forecast by Crop Type, 2020-2035
  • Table 119: Middle East and Africa Market Value (USD Billion) Forecast by Application, 2020-2035
  • Table 120: Middle East and Africa Market Volume (Kilotons) Forecast by Application, 2020-2035
  • Table 121: Middle East and Africa Market Value (USD Billion) Forecast by End User, 2020-2035
  • Table 122: Middle East and Africa Market Volume (Kilotons) Forecast by End User, 2020-2035
  • Table 123: Middle East and Africa Market Value (USD Billion) Forecast by Distribution Channel, 2020-2035
  • Table 124: Middle East and Africa Market Volume (Kilotons) Forecast by Distribution Channel, 2020-2035
  • Table 125: Middle East and Africa Market Value (USD Billion) Forecast by Solvent Type, 2020-2035
  • Table 126: Middle East and Africa Market Volume (Kilotons) Forecast by Solvent Type, 2020-2035
  • Table 127: Middle East and Africa Market Value (USD Billion) Forecast by Packaging Format, 2020-2035
  • Table 128: Middle East and Africa Market Volume (Kilotons) Forecast by Packaging Format, 2020-2035

List of Figures

  • Figure 1: Global Market Volume (Kilotons) Forecast 2020-2035
  • Figure 2: Global Market Pricing Analysis
  • Figure 3: Global Market Value (USD Billion) Forecast 2020-2035
  • Figure 4: Global Market Value Share and BPS Analysis by Active Ingredient Type, 2025 and 2035
  • Figure 5: Global Market Y-o-Y Growth Comparison by Active Ingredient Type, 2025-2035
  • Figure 6: Global Market Attractiveness Analysis by Active Ingredient Type
  • Figure 7: Global Market Value Share and BPS Analysis by Crop Type, 2025 and 2035
  • Figure 8: Global Market Y-o-Y Growth Comparison by Crop Type, 2025-2035
  • Figure 9: Global Market Attractiveness Analysis by Crop Type
  • Figure 10: Global Market Value Share and BPS Analysis by Application, 2025 and 2035
  • Figure 11: Global Market Y-o-Y Growth Comparison by Application, 2025-2035
  • Figure 12: Global Market Attractiveness Analysis by Application
  • Figure 13: Global Market Value Share and BPS Analysis by End User, 2025 and 2035
  • Figure 14: Global Market Y-o-Y Growth Comparison by End User, 2025-2035
  • Figure 15: Global Market Attractiveness Analysis by End User
  • Figure 16: Global Market Value Share and BPS Analysis by Distribution Channel, 2025 and 2035
  • Figure 17: Global Market Y-o-Y Growth Comparison by Distribution Channel, 2025-2035
  • Figure 18: Global Market Attractiveness Analysis by Distribution Channel
  • Figure 19: Global Market Value Share and BPS Analysis by Solvent Type, 2025 and 2035
  • Figure 20: Global Market Y-o-Y Growth Comparison by Solvent Type, 2025-2035
  • Figure 21: Global Market Attractiveness Analysis by Solvent Type
  • Figure 22: Global Market Value Share and BPS Analysis by Packaging Format, 2025 and 2035
  • Figure 23: Global Market Y-o-Y Growth Comparison by Packaging Format, 2025-2035
  • Figure 24: Global Market Attractiveness Analysis by Packaging Format
  • Figure 25: Global Market Value (USD Billion) Share and BPS Analysis by Region, 2025 and 2035
  • Figure 26: Global Market Y-o-Y Growth Comparison by Region, 2025-2035
  • Figure 27: Global Market Attractiveness Analysis by Region
  • Figure 28: North America Market Incremental $ Opportunity, 2025-2035
  • Figure 29: Latin America Market Incremental $ Opportunity, 2025-2035
  • Figure 30: Western Europe Market Incremental $ Opportunity, 2025-2035
  • Figure 31: Eastern Europe Market Incremental $ Opportunity, 2025-2035
  • Figure 32: East Asia Market Incremental $ Opportunity, 2025-2035
  • Figure 33: South Asia & Pacific Market Incremental $ Opportunity, 2025-2035
  • Figure 34: Middle East and Africa Market Incremental $ Opportunity, 2025-2035
  • Figure 35: North America Market Value Share and BPS Analysis by Country, 2025 and 2035
  • Figure 36: North America Market Value Share and BPS Analysis by Active Ingredient Type, 2025 and 2035
  • Figure 37: North America Market Y-o-Y Growth Comparison by Active Ingredient Type, 2025-2035
  • Figure 38: North America Market Attractiveness Analysis by Active Ingredient Type
  • Figure 39: North America Market Value Share and BPS Analysis by Crop Type, 2025 and 2035
  • Figure 40: North America Market Y-o-Y Growth Comparison by Crop Type, 2025-2035
  • Figure 41: North America Market Attractiveness Analysis by Crop Type
  • Figure 42: North America Market Value Share and BPS Analysis by Application, 2025 and 2035
  • Figure 43: North America Market Y-o-Y Growth Comparison by Application, 2025-2035
  • Figure 44: North America Market Attractiveness Analysis by Application
  • Figure 45: North America Market Value Share and BPS Analysis by End User, 2025 and 2035
  • Figure 46: North America Market Y-o-Y Growth Comparison by End User, 2025-2035
  • Figure 47: North America Market Attractiveness Analysis by End User
  • Figure 48: North America Market Value Share and BPS Analysis by Distribution Channel, 2025 and 2035
  • Figure 49: North America Market Y-o-Y Growth Comparison by Distribution Channel, 2025-2035
  • Figure 50: North America Market Attractiveness Analysis by Distribution Channel
  • Figure 51: North America Market Value Share and BPS Analysis by Solvent Type, 2025 and 2035
  • Figure 52: North America Market Y-o-Y Growth Comparison by Solvent Type, 2025-2035
  • Figure 53: North America Market Attractiveness Analysis by Solvent Type
  • Figure 54: North America Market Value Share and BPS Analysis by Packaging Format, 2025 and 2035
  • Figure 55: North America Market Y-o-Y Growth Comparison by Packaging Format, 2025-2035
  • Figure 56: North America Market Attractiveness Analysis by Packaging Format
  • Figure 57: Latin America Market Value Share and BPS Analysis by Country, 2025 and 2035
  • Figure 58: Latin America Market Value Share and BPS Analysis by Active Ingredient Type, 2025 and 2035
  • Figure 59: Latin America Market Y-o-Y Growth Comparison by Active Ingredient Type, 2025-2035
  • Figure 60: Latin America Market Attractiveness Analysis by Active Ingredient Type
  • Figure 61: Latin America Market Value Share and BPS Analysis by Crop Type, 2025 and 2035
  • Figure 62: Latin America Market Y-o-Y Growth Comparison by Crop Type, 2025-2035
  • Figure 63: Latin America Market Attractiveness Analysis by Crop Type
  • Figure 64: Latin America Market Value Share and BPS Analysis by Application, 2025 and 2035
  • Figure 65: Latin America Market Y-o-Y Growth Comparison by Application, 2025-2035
  • Figure 66: Latin America Market Attractiveness Analysis by Application
  • Figure 67: Latin America Market Value Share and BPS Analysis by End User, 2025 and 2035
  • Figure 68: Latin America Market Y-o-Y Growth Comparison by End User, 2025-2035
  • Figure 69: Latin America Market Attractiveness Analysis by End User
  • Figure 70: Latin America Market Value Share and BPS Analysis by Distribution Channel, 2025 and 2035
  • Figure 71: Latin America Market Y-o-Y Growth Comparison by Distribution Channel, 2025-2035
  • Figure 72: Latin America Market Attractiveness Analysis by Distribution Channel
  • Figure 73: Latin America Market Value Share and BPS Analysis by Solvent Type, 2025 and 2035
  • Figure 74: Latin America Market Y-o-Y Growth Comparison by Solvent Type, 2025-2035
  • Figure 75: Latin America Market Attractiveness Analysis by Solvent Type
  • Figure 76: Latin America Market Value Share and BPS Analysis by Packaging Format, 2025 and 2035
  • Figure 77: Latin America Market Y-o-Y Growth Comparison by Packaging Format, 2025-2035
  • Figure 78: Latin America Market Attractiveness Analysis by Packaging Format
  • Figure 79: Western Europe Market Value Share and BPS Analysis by Country, 2025 and 2035
  • Figure 80: Western Europe Market Value Share and BPS Analysis by Active Ingredient Type, 2025 and 2035
  • Figure 81: Western Europe Market Y-o-Y Growth Comparison by Active Ingredient Type, 2025-2035
  • Figure 82: Western Europe Market Attractiveness Analysis by Active Ingredient Type
  • Figure 83: Western Europe Market Value Share and BPS Analysis by Crop Type, 2025 and 2035
  • Figure 84: Western Europe Market Y-o-Y Growth Comparison by Crop Type, 2025-2035
  • Figure 85: Western Europe Market Attractiveness Analysis by Crop Type
  • Figure 86: Western Europe Market Value Share and BPS Analysis by Application, 2025 and 2035
  • Figure 87: Western Europe Market Y-o-Y Growth Comparison by Application, 2025-2035
  • Figure 88: Western Europe Market Attractiveness Analysis by Application
  • Figure 89: Western Europe Market Value Share and BPS Analysis by End User, 2025 and 2035
  • Figure 90: Western Europe Market Y-o-Y Growth Comparison by End User, 2025-2035
  • Figure 91: Western Europe Market Attractiveness Analysis by End User
  • Figure 92: Western Europe Market Value Share and BPS Analysis by Distribution Channel, 2025 and 2035
  • Figure 93: Western Europe Market Y-o-Y Growth Comparison by Distribution Channel, 2025-2035
  • Figure 94: Western Europe Market Attractiveness Analysis by Distribution Channel
  • Figure 95: Western Europe Market Value Share and BPS Analysis by Solvent Type, 2025 and 2035
  • Figure 96: Western Europe Market Y-o-Y Growth Comparison by Solvent Type, 2025-2035
  • Figure 97: Western Europe Market Attractiveness Analysis by Solvent Type
  • Figure 98: Western Europe Market Value Share and BPS Analysis by Packaging Format, 2025 and 2035
  • Figure 99: Western Europe Market Y-o-Y Growth Comparison by Packaging Format, 2025-2035
  • Figure 100: Western Europe Market Attractiveness Analysis by Packaging Format
  • Figure 101: Eastern Europe Market Value Share and BPS Analysis by Country, 2025 and 2035
  • Figure 102: Eastern Europe Market Value Share and BPS Analysis by Active Ingredient Type, 2025 and 2035
  • Figure 103: Eastern Europe Market Y-o-Y Growth Comparison by Active Ingredient Type, 2025-2035
  • Figure 104: Eastern Europe Market Attractiveness Analysis by Active Ingredient Type
  • Figure 105: Eastern Europe Market Value Share and BPS Analysis by Crop Type, 2025 and 2035
  • Figure 106: Eastern Europe Market Y-o-Y Growth Comparison by Crop Type, 2025-2035
  • Figure 107: Eastern Europe Market Attractiveness Analysis by Crop Type
  • Figure 108: Eastern Europe Market Value Share and BPS Analysis by Application, 2025 and 2035
  • Figure 109: Eastern Europe Market Y-o-Y Growth Comparison by Application, 2025-2035
  • Figure 110: Eastern Europe Market Attractiveness Analysis by Application
  • Figure 111: Eastern Europe Market Value Share and BPS Analysis by End User, 2025 and 2035
  • Figure 112: Eastern Europe Market Y-o-Y Growth Comparison by End User, 2025-2035
  • Figure 113: Eastern Europe Market Attractiveness Analysis by End User
  • Figure 114: Eastern Europe Market Value Share and BPS Analysis by Distribution Channel, 2025 and 2035
  • Figure 115: Eastern Europe Market Y-o-Y Growth Comparison by Distribution Channel, 2025-2035
  • Figure 116: Eastern Europe Market Attractiveness Analysis by Distribution Channel
  • Figure 117: Eastern Europe Market Value Share and BPS Analysis by Solvent Type, 2025 and 2035
  • Figure 118: Eastern Europe Market Y-o-Y Growth Comparison by Solvent Type, 2025-2035
  • Figure 119: Eastern Europe Market Attractiveness Analysis by Solvent Type
  • Figure 120: Eastern Europe Market Value Share and BPS Analysis by Packaging Format, 2025 and 2035
  • Figure 121: Eastern Europe Market Y-o-Y Growth Comparison by Packaging Format, 2025-2035
  • Figure 122: Eastern Europe Market Attractiveness Analysis by Packaging Format
  • Figure 123: East Asia Market Value Share and BPS Analysis by Country, 2025 and 2035
  • Figure 124: East Asia Market Value Share and BPS Analysis by Active Ingredient Type, 2025 and 2035
  • Figure 125: East Asia Market Y-o-Y Growth Comparison by Active Ingredient Type, 2025-2035
  • Figure 126: East Asia Market Attractiveness Analysis by Active Ingredient Type
  • Figure 127: East Asia Market Value Share and BPS Analysis by Crop Type, 2025 and 2035
  • Figure 128: East Asia Market Y-o-Y Growth Comparison by Crop Type, 2025-2035
  • Figure 129: East Asia Market Attractiveness Analysis by Crop Type
  • Figure 130: East Asia Market Value Share and BPS Analysis by Application, 2025 and 2035
  • Figure 131: East Asia Market Y-o-Y Growth Comparison by Application, 2025-2035
  • Figure 132: East Asia Market Attractiveness Analysis by Application
  • Figure 133: East Asia Market Value Share and BPS Analysis by End User, 2025 and 2035
  • Figure 134: East Asia Market Y-o-Y Growth Comparison by End User, 2025-2035
  • Figure 135: East Asia Market Attractiveness Analysis by End User
  • Figure 136: East Asia Market Value Share and BPS Analysis by Distribution Channel, 2025 and 2035
  • Figure 137: East Asia Market Y-o-Y Growth Comparison by Distribution Channel, 2025-2035
  • Figure 138: East Asia Market Attractiveness Analysis by Distribution Channel
  • Figure 139: East Asia Market Value Share and BPS Analysis by Solvent Type, 2025 and 2035
  • Figure 140: East Asia Market Y-o-Y Growth Comparison by Solvent Type, 2025-2035
  • Figure 141: East Asia Market Attractiveness Analysis by Solvent Type
  • Figure 142: East Asia Market Value Share and BPS Analysis by Packaging Format, 2025 and 2035
  • Figure 143: East Asia Market Y-o-Y Growth Comparison by Packaging Format, 2025-2035
  • Figure 144: East Asia Market Attractiveness Analysis by Packaging Format
  • Figure 145: South Asia & Pacific Market Value Share and BPS Analysis by Country, 2025 and 2035
  • Figure 146: South Asia & Pacific Market Value Share and BPS Analysis by Active Ingredient Type, 2025 and 2035
  • Figure 147: South Asia & Pacific Market Y-o-Y Growth Comparison by Active Ingredient Type, 2025-2035
  • Figure 148: South Asia & Pacific Market Attractiveness Analysis by Active Ingredient Type
  • Figure 149: South Asia & Pacific Market Value Share and BPS Analysis by Crop Type, 2025 and 2035
  • Figure 150: South Asia & Pacific Market Y-o-Y Growth Comparison by Crop Type, 2025-2035
  • Figure 151: South Asia & Pacific Market Attractiveness Analysis by Crop Type
  • Figure 152: South Asia & Pacific Market Value Share and BPS Analysis by Application, 2025 and 2035
  • Figure 153: South Asia & Pacific Market Y-o-Y Growth Comparison by Application, 2025-2035
  • Figure 154: South Asia & Pacific Market Attractiveness Analysis by Application
  • Figure 155: South Asia & Pacific Market Value Share and BPS Analysis by End User, 2025 and 2035
  • Figure 156: South Asia & Pacific Market Y-o-Y Growth Comparison by End User, 2025-2035
  • Figure 157: South Asia & Pacific Market Attractiveness Analysis by End User
  • Figure 158: South Asia & Pacific Market Value Share and BPS Analysis by Distribution Channel, 2025 and 2035
  • Figure 159: South Asia & Pacific Market Y-o-Y Growth Comparison by Distribution Channel, 2025-2035
  • Figure 160: South Asia & Pacific Market Attractiveness Analysis by Distribution Channel
  • Figure 161: South Asia & Pacific Market Value Share and BPS Analysis by Solvent Type, 2025 and 2035
  • Figure 162: South Asia & Pacific Market Y-o-Y Growth Comparison by Solvent Type, 2025-2035
  • Figure 163: South Asia & Pacific Market Attractiveness Analysis by Solvent Type
  • Figure 164: South Asia & Pacific Market Value Share and BPS Analysis by Packaging Format, 2025 and 2035
  • Figure 165: South Asia & Pacific Market Y-o-Y Growth Comparison by Packaging Format, 2025-2035
  • Figure 166: South Asia & Pacific Market Attractiveness Analysis by Packaging Format
  • Figure 167: Middle East and Africa Market Value Share and BPS Analysis by Country, 2025 and 2035
  • Figure 168: Middle East and Africa Market Value Share and BPS Analysis by Active Ingredient Type, 2025 and 2035
  • Figure 169: Middle East and Africa Market Y-o-Y Growth Comparison by Active Ingredient Type, 2025-2035
  • Figure 170: Middle East and Africa Market Attractiveness Analysis by Active Ingredient Type
  • Figure 171: Middle East and Africa Market Value Share and BPS Analysis by Crop Type, 2025 and 2035
  • Figure 172: Middle East and Africa Market Y-o-Y Growth Comparison by Crop Type, 2025-2035
  • Figure 173: Middle East and Africa Market Attractiveness Analysis by Crop Type
  • Figure 174: Middle East and Africa Market Value Share and BPS Analysis by Application, 2025 and 2035
  • Figure 175: Middle East and Africa Market Y-o-Y Growth Comparison by Application, 2025-2035
  • Figure 176: Middle East and Africa Market Attractiveness Analysis by Application
  • Figure 177: Middle East and Africa Market Value Share and BPS Analysis by End User, 2025 and 2035
  • Figure 178: Middle East and Africa Market Y-o-Y Growth Comparison by End User, 2025-2035
  • Figure 179: Middle East and Africa Market Attractiveness Analysis by End User
  • Figure 180: Middle East and Africa Market Value Share and BPS Analysis by Distribution Channel, 2025 and 2035
  • Figure 181: Middle East and Africa Market Y-o-Y Growth Comparison by Distribution Channel, 2025-2035
  • Figure 182: Middle East and Africa Market Attractiveness Analysis by Distribution Channel
  • Figure 183: Middle East and Africa Market Value Share and BPS Analysis by Solvent Type, 2025 and 2035
  • Figure 184: Middle East and Africa Market Y-o-Y Growth Comparison by Solvent Type, 2025-2035
  • Figure 185: Middle East and Africa Market Attractiveness Analysis by Solvent Type
  • Figure 186: Middle East and Africa Market Value Share and BPS Analysis by Packaging Format, 2025 and 2035
  • Figure 187: Middle East and Africa Market Y-o-Y Growth Comparison by Packaging Format, 2025-2035
  • Figure 188: Middle East and Africa Market Attractiveness Analysis by Packaging Format
  • Figure 189: Global Market - Tier Structure Analysis
  • Figure 190: Global Market - Company Share Analysis

Frequently Asked Questions

What is the projected size of the emulsifiable concentrates market in 2025?

The projected industry size of the industry in 2025 is USD 1.2 billion.

What will be the value of the emulsifiable concentrates market in 2035 and its CAGR?

The industry value in 2035 is USD 1.7 billion, with a CAGR of 3.3%.

Which end-user segment leads the emulsifiable concentrates market?

The agriculture segment leads the industry with a 67% industry share.

Which country is projected to have the highest CAGR in the emulsifiable concentrates market?

India is projected to have the highest CAGR in the industry with a growth rate of 3.5% from 2025 to 2035.

Who is the leading company in the emulsifiable concentrates market?

The leading company in the industry is Bayer AG, with an 18% industry share.

Future Market Insights

Emulsifiable Concentrates Market