Eubiotics Market Size and Share Forecast Outlook 2025 to 2035

The global eubiotics market is projected to grow from USD 4.8 billion in 2025 to USD 9.4 billion by 2035, registering a CAGR of 6.9%. The market expansion is being driven by rising demand for natural feed additives, regulatory restrictions on antibiotic use, and increasing awareness of livestock health and productivity.
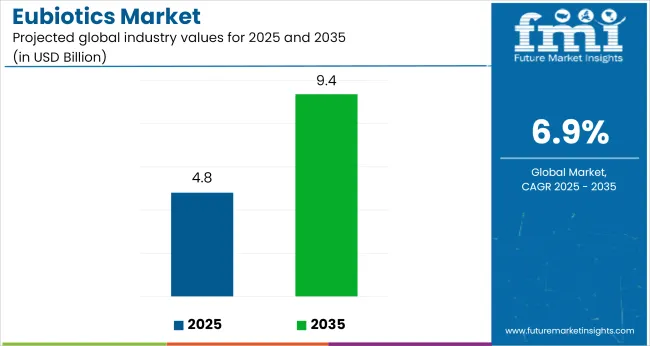
Quick Stats for Eubiotics Market

  • Market Value (2025): USD 4.8 billion
  • Forecast Value (2035): USD 9.4 billion
  • Forecast CAGR: 6.9%
  • Type Leader in 2035: Probiotics (42% market share)
  • Top Form Segment: Dry (68% share)
  • Key Growth Region: Western Europe (Germany is the fastest-growing market with 11.5% CAGR)
Eubiotics Market Industry Value Analysis
Metric Value
Industry Size (2025E) USD 4.8 billion
Industry Value (2035F) USD 9.4 billion
CAGR (2025 to 2035) 6.9%

Growing adoption of eubiotics across poultry, swine, and ruminant sectors is supporting overall market growth, while innovation in spore-forming probiotics and encapsulation technologies is enhancing efficiency and uptake.

The market holds a 100% share in the animal feed additives market due to its core nature as feed additives. It commands around 21% in the feed additives market, highlighting its role in gut health and productivity. Its share in the broader animal nutrition market is about 4%, driven by its inclusion in nutrition programs. In the global feed market, eubiotics hold a modest 1.3% share. However, their share in the entire food and agriculture market remains below 0.02%, signifying a niche but critical segment for livestock productivity and safety.

Government regulations impacting the market focus on antibiotic bans, food safety, and animal welfare. The European Union’s ban on antibiotic growth promoters (AGPs), FDA Guidance for Industry #213 in the USA, and India’s FSSAI feed additive guidelines promote safer and natural alternatives in livestock production. Such regulations are fuelling demand for prebiotics, probiotics, and organic acids to maintain gut health, improve feed conversion ratios, and ensure safe and sustainable meat and dairy production.

Germany is projected to be the fastest-growing market, expanding at a CAGR of 11.5% from 2025 to 2035. Probiotics will lead the type segment with a 42% share, while dry will dominate the form segment with a 68% share. The USA and France markets are also expected to grow steadily at CAGRs of 8.5% and 9.1%, respectively.

Analyzing Eubiotics Market by Top Investment Segments

The eubiotics market is segmented by type, form, function, livestock, and region. By type, the market is divided into probiotics, prebiotics, organic acid, essential oil, and enzymes. In terms of form, the market is bifurcated into dry and liquid. Based on function, the market is segmented into nutrition & gut health, yield, and immunity.

By livestock, the market is segmented into cattle, poultry, swine, aquaculture, and others (sheep, goat, equine, pet food). Regionally, the market is classified into North America, Latin America, Western Europe, South Asia, East Asia, Eastern Europe, and the Middle East & Africa.

Probiotics to Lead the Type Segment with 42% Market Share

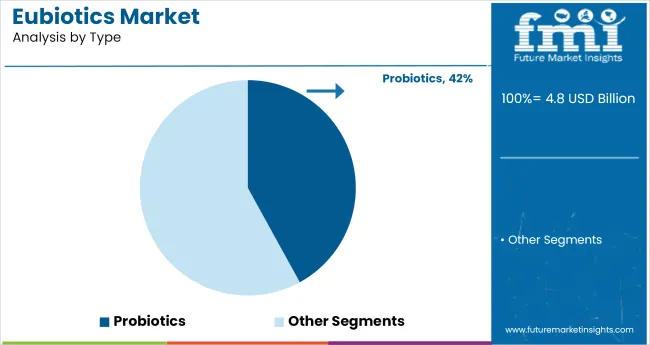
Probiotics are projected to dominate the type segment, capturing 42% of the global eubiotics market share by 2035. Their widespread application in animal feed enhances gut health, immunity, and overall productivity, driven by rising demand for natural feed additives amid global antibiotic restrictions.
  • Probiotics promote beneficial bacteria growth in the gastrointestinal tract, ensuring improved feed efficiency and animal productivity.
  • Increasing regulatory restrictions on antibiotic use are driving demand for probiotics as a natural alternative.
Eubiotics Market Analysis By Type

Dry to Capture the Form Segment with 68% Market Share

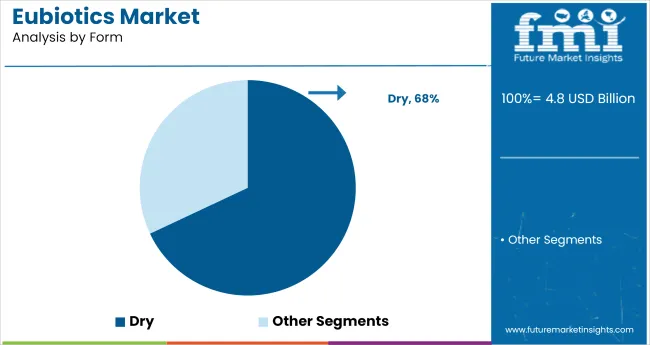
Dry is projected to hold the leading position in the form segment, capturing 68% of the market share by 2035. This dominance is due to their superior stability, extended shelf life, and ease of formulation integration in large-scale feed production systems globally.
  • Dry formulations offer superior stability, longer shelf life, and ease of mixing in feed formulations.
  • These are preferred in large-scale animal production units for convenient handling and cost-effectiveness.
Eubiotics Market Analysis By Form

Nutrition and Gut Health to Lead the Function Segment with 35% Market Share

The nutrition and gut health function segment is expected to dominate, capturing 35% of the global market share by 2035.

  • Eubiotics targeting nutrition and gut health are critical for optimizing nutrient absorption and enhancing livestock growth performance.
  • Growing focus on preventive animal healthcare is driving segment growth.

Poultry to Lead the Livestock Segment with 37% Market Share

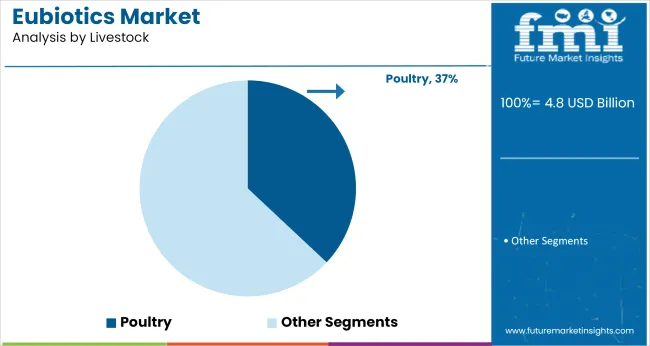
Poultry is projected to dominate the livestock segment, holding 37% of the market share by 2035.
  • Poultry production’s high demand for feed additives to improve feed conversion ratios and immunity is fueling market growth.
  • Rising global consumption of poultry products is enhancing demand for effective eubiotics solutions.
Eubiotics Market Analysis By Livestock

Top Eubiotics Market Dynamics

The global eubiotics market is experiencing steady growth, driven by the increasing demand for natural feed additives and sustainable animal farming practices. Eubiotics play a crucial role in enhancing animal health, productivity, and compliance with antibiotic-free regulations.

Recent Trends in the Eubiotics Market

  • Integration of spore-forming probiotics, encapsulation technologies, and synbiotic formulations is improving stability, bioavailability, and targeted gut delivery of eubiotics.
  • Customized formulations focusing on livestock-specific health solutions are gaining popularity, providing tailored nutrition and immunity support for diverse animal categories.

Challenges in the Eubiotics Market

  • High production costs, particularly for advanced probiotic strains and encapsulated formulations, limit their adoption in price-sensitive markets.
  • Stringent regulatory frameworks and long approval processes for new eubiotics hinder market expansion, requiring substantial investment in R&D and compliance strategies.

Top Countries Manufacturing, Regulating, and Driving Demand for Eubiotics

Germany leads the eubiotics market with the highest CAGR at 11.5%, driven by strict EU antibiotic reduction mandates and sustainability policies. France follows with 9.1% CAGR, supported by strong regulatory backing for antibiotic-free meat. The USA market grows at 8.5% CAGR, underpinned by feed efficiency and productivity gains in livestock.

Japan records 7.2% CAGR, driven by precision livestock farming and encapsulated probiotics. The UK shows the slowest growth at 8.4% CAGR, limited by post-Brexit regulatory delays. Europe remains dominant, with Germany significantly exceeding the global average in eubiotics adoption and market expansion.

The report covers in-depth analysis of 40+ countries; five top-performing OECD countries are highlighted below.

In-depth Analysis of Eubiotics Demand in Japan

The Japan eubiotics revenue is growing at a CAGR of 7.2% from 2025 to 2035. Growth is driven by antibiotic-free livestock policies and high-value meat exports to Asia. As a technology-driven OECD economy, Japan prioritizes feed additives enhancing gut health and feed conversion, integrated into precision livestock farming.

  • High demand in swine, poultry, and aquaculture sectors.
  • Preference for encapsulated probiotics and synbiotics.

Growth Outlook for Eubiotics in Germany

The sales of eubiotics in Germany are expected to expand at 11.5% CAGR during the forecast period, strongly exceeding the global average due to regulatory enforcement. EU antibiotic reduction targets, sustainability mandates, and integrated feed additive programs are pushing adoption. Key applications include poultry, swine, and dairy feed.

  • Strong EU compliance pressures in poultry and dairy sectors.
  • Demand for certified, science-backed probiotic strains.

Industrial Livestock Feed Additives Demand in France

The French eubiotics market is projected to grow at a 9.1% CAGR during the forecast period, supported by regulatory backing and consumer preference for antibiotic-free meat. Demand is driven by national food safety programs, animal welfare regulations, and sustainability initiatives.

  • High adoption in dairy, poultry, and swine feed.
  • Strong focus on heat-stable probiotics for pelleted feeds.

Demand Trajectory for Eubiotics in the USA

The USA eubiotics market is projected to grow at 8.5% CAGR from 2025 to 2035., USA demand is driven by productivity gains, feed efficiency, and animal welfare mandates in meat production.

  • Strong demand for performance-boosting probiotic blends.
  • Premium synbiotics adoption in poultry and swine feed.

Eubiotics Trends in the UK

The UK eubiotics revenue is projected to grow at a CAGR of 8.4% from 2025 to 2035. Growth is supported by livestock health regulations in poultry and swine sectors. Post-Brexit regulatory divergence has slowed new product registrations.

  • Focus on poultry and swine feed applications.
  • Demand for affordable prebiotics and organic acids.

Leading Eubiotics Suppliers and Manufacturers

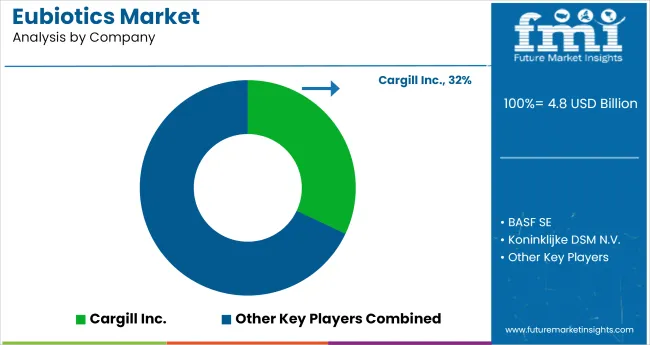
The market is moderately consolidated, with leading players like Cargill Inc., BASF SE, Koninklijke DSM N.V., Novozymes, and Beneo Group dominating the industry. These companies provide advanced, efficient eubiotic solutions catering to livestock sectors such as poultry, swine, cattle, and aquaculture.

Cargill Inc. focuses on integrated feed additive solutions and nutrition programs, while BASF SE specializes in high-purity organic acids and feed enzymes. Koninklijke DSM N.V. delivers innovative probiotic and prebiotic solutions enhancing animal health and productivity.

Novozymes offers enzyme-based eubiotics for improved feed conversion efficiency, and Beneo Group is known for its prebiotic fibre solutions promoting gut health. Other key players like Lesaffre Group, Kemin Industries, Inc., Novus International, Inc., and Chr. Hansen Holding A/S contribute by providing specialized, science-backed eubiotics for diverse livestock applications globally.

Recent Eubiotics Industry News
  • In April 2025, Evonik introduced Ecobiol, a Bacillus subtilis-based probiotic formulated to improve gut health and feed efficiency in poultry. The launch in mainland China supports rising demand for functional feed additives in livestock nutrition.
  • In January 2025, Novus International partnered with Resilient Biotics to develop a microbiome-based feed solution targeting immune support and respiratory health in swine. The collaboration aims to advance antibiotic-free livestock production through gut and lung-focused microbial interventions.
Eubiotics Market Analysis By Company

Eubiotics Market Report Scope

Report Attributes Details
Market Size (2025) USD 4.8 billion
Projected Market Size (2035) USD 9.4 billion
CAGR (2025 to 2035) 6.9%
Base Year for Estimation 2024
Historical Period 2020 to 2024
Projections Period 2025 to 2035
Report Parameter USD billion for value/volume in units
Type Analyzed Probiotics, Prebiotics, Organic Acid, Essential Oil, and Enzymes
Form Analyzed Dry and Liquid
Function Analyzed Nutrition and Gut Health, Yield, and Immunity
Livestock Analyzed Cattle, Poultry, Swine, Aquaculture, and Others (Sheep, Goat, Equine, Pet Food)
Key Growth Region North America, Latin America, Western Europe, South Asia, East Asia, Eastern Europe, Middle East & Africa
Countries Covered United States, United Kingdom, Germany, France, Japan, China, India, Brazil, South Korea, Australia
Key Players Influencing the Market Cargill Inc., BASF SE, Koninklijke DSM N.V., Novozymes, Beneo Group, Lesaffre Group, Kemin Industries, Inc., Novus International, Inc., and Chr. Hansen Holding A/S
Additional Attributes Dollar sales by equipment type, share by power, regional demand growth, policy influence, automation trends, competitive benchmarking

Key Segmentation

By Type:

Based on type, the sector is divided into probiotics, prebiotics, organic acid, essential oil, and enzymes.

By Form:

The eubiotics market segmentation includes dry and liquid based on the form.

By Function:

In terms of function, the industry is categorized into nutrition and gut health, yield, and immunity.

By Livestock:

By livestock, the industry is segmented into cattle, poultry, swine, aquaculture, and others.

By Region:

Analysis has been carried out in key countries of North America, Europe, Asia Pacific, the Middle East and Africa, and Latin America.

Table of Content

  1. Executive Summary
    • Global Market Outlook
    • Demand-side Trends
    • Supply-side Trends
    • Technology Roadmap Analysis
    • Analysis and Recommendations
  2. Market Overview
    • Market Coverage/Taxonomy
    • Market Definition/Scope/Limitations
  3. Market Background
    • Market Dynamics
      • Drivers
      • Restraints
      • Opportunity
      • Trends
    • Scenario Forecast
      • Demand in Optimistic Scenario
      • Demand in Likely Scenario
      • Demand in Conservative Scenario
    • Opportunity Map Analysis
    • Product Life Cycle Analysis
    • Supply Chain Analysis
      • Supply Side Participants and their Roles
        • Producers
        • Mid-Level Participants (Traders/ Agents/ Brokers)
        • Wholesalers and Distributors
      • Value Added and Value Created at Node in the Supply Chain
      • List of Raw Material Suppliers
      • List of Existing and Potential Buyer’s
    • Investment Feasibility Matrix
    • Value Chain Analysis
      • Profit Margin Analysis
      • Wholesalers and Distributors
      • Retailers
    • PESTLE and Porter’s Analysis
    • Regulatory Landscape
      • By Key Regions
      • By Key Countries
    • Regional Parent Market Outlook
    • Production and Consumption Statistics
    • Import and Export Statistics
  4. Global Market Analysis 2020 to 2024 and Forecast, 2025 to 2035
    • Historical Market Size Value (USD Billion) & Volume (Units) Analysis, 2020 to 2024
    • Current and Future Market Size Value (USD Billion) & Volume (Units) Projections, 2025 to 2035
      • Y-o-Y Growth Trend Analysis
      • Absolute $ Opportunity Analysis
  5. Global Market Pricing Analysis 2020 to 2024 and Forecast 2025 to 2035
  6. Global Market Analysis 2020 to 2024 and Forecast 2025 to 2035, By Type
    • Introduction/Key Findings
    • Historical Market Size Value (USD Billion) & Volume (Units) Analysis By Type, 2020 to 2024
    • Current and Future Market Size Value (USD Billion) & Volume (Units) Analysis and Forecast By Type, 2025 to 2035
      • Probiotics
      • Prebiotics
      • Organic Acid
      • Essential Oil
      • Enzymes
    • Y-o-Y Growth Trend Analysis By Type, 2020 to 2024
    • Absolute $ Opportunity Analysis By Type, 2025 to 2035
  7. Global Market Analysis 2020 to 2024 and Forecast 2025 to 2035, By Form
    • Introduction/Key Findings
    • Historical Market Size Value (USD Billion) & Volume (Units) Analysis By Form, 2020 to 2024
    • Current and Future Market Size Value (USD Billion) & Volume (Units) Analysis and Forecast By Form, 2025 to 2035
      • Dry
      • Liquid
    • Y-o-Y Growth Trend Analysis By Form, 2020 to 2024
    • Absolute $ Opportunity Analysis By Form, 2025 to 2035
  8. Global Market Analysis 2020 to 2024 and Forecast 2025 to 2035, By Function
    • Introduction/Key Findings
    • Historical Market Size Value (USD Billion) & Volume (Units) Analysis By Function, 2020 to 2024
    • Current and Future Market Size Value (USD Billion) & Volume (Units) Analysis and Forecast By Function, 2025 to 2035
      • Nutrition and Gut Health
      • Yield
      • Immunity
    • Y-o-Y Growth Trend Analysis By Function, 2020 to 2024
    • Absolute $ Opportunity Analysis By Function, 2025 to 2035
  9. Global Market Analysis 2020 to 2024 and Forecast 2025 to 2035, By Livestock
    • Introduction/Key Findings
    • Historical Market Size Value (USD Billion) & Volume (Units) Analysis By Livestock, 2020 to 2024
    • Current and Future Market Size Value (USD Billion) & Volume (Units) Analysis and Forecast By Livestock, 2025 to 2035
      • Cattle
        • Poultry
        • Swine
        • Aquaculture
        • Others
      • Poultry
      • Swine
      • Aquaculture
      • Others (sheep, goat, equine, pet food)
    • Y-o-Y Growth Trend Analysis By Livestock, 2020 to 2024
    • Absolute $ Opportunity Analysis By Livestock, 2025 to 2035
  10. Global Market Analysis 2020 to 2024 and Forecast 2025 to 2035, By Region
    • Introduction
    • Historical Market Size Value (USD Billion) & Volume (Units) Analysis By Region, 2020 to 2024
    • Current Market Size Value (USD Billion) & Volume (Units) Analysis and Forecast By Region, 2025 to 2035
      • North America
      • Latin America
      • Western Europe
      • Eastern Europe
      • East Asia
      • South Asia & Pacific
      • Middle East and Africa
    • Market Attractiveness Analysis By Region
  11. North America Market Analysis 2020 to 2024 and Forecast 2025 to 2035, By Country
    • Historical Market Size Value (USD Billion) & Volume (Units) Trend Analysis By Market Taxonomy, 2020 to 2024
    • Market Size Value (USD Billion) & Volume (Units) Forecast By Market Taxonomy, 2025 to 2035
      • By Country
        • USA
        • Canada
        • Mexico
      • By Type
      • By Form
      • By Function
      • By Livestock
    • Market Attractiveness Analysis
      • By Country
      • By Type
      • By Form
      • By Function
      • By Livestock
    • Key Takeaways
  12. Latin America Market Analysis 2020 to 2024 and Forecast 2025 to 2035, By Country
    • Historical Market Size Value (USD Billion) & Volume (Units) Trend Analysis By Market Taxonomy, 2020 to 2024
    • Market Size Value (USD Billion) & Volume (Units) Forecast By Market Taxonomy, 2025 to 2035
      • By Country
        • Brazil
        • Argentina
        • Rest of LATAM
      • By Type
      • By Form
      • By Function
      • By Livestock
    • Market Attractiveness Analysis
      • By Country
      • By Type
      • By Form
      • By Function
      • By Livestock
    • Key Takeaways
  13. Western Europe Market Analysis 2020 to 2024 and Forecast 2025 to 2035, By Country
    • Historical Market Size Value (USD Billion) & Volume (Units) Trend Analysis By Market Taxonomy, 2020 to 2024
    • Market Size Value (USD Billion) & Volume (Units) Forecast By Market Taxonomy, 2025 to 2035
      • By Country
        • Germany
        • Italy
        • France
        • UK
        • Spain
        • BENELUX
        • Nordic
        • Rest of W.Europe
      • By Type
      • By Form
      • By Function
      • By Livestock
    • Market Attractiveness Analysis
      • By Country
      • By Type
      • By Form
      • By Function
      • By Livestock
    • Key Takeaways
  14. Eastern Europe Market Analysis 2020 to 2024 and Forecast 2025 to 2035, By Country
    • Historical Market Size Value (USD Billion) & Volume (Units) Trend Analysis By Market Taxonomy, 2020 to 2024
    • Market Size Value (USD Billion) & Volume (Units) Forecast By Market Taxonomy, 2025 to 2035
      • By Country
        • Russia
        • Hungary
        • Poland
        • Balkan & Baltics
        • Rest of E. Europe
      • By Type
      • By Form
      • By Function
      • By Livestock
    • Market Attractiveness Analysis
      • By Country
      • By Type
      • By Form
      • By Function
      • By Livestock
    • Key Takeaways
  15. East Asia Market Analysis 2020 to 2024 and Forecast 2025 to 2035, By Country
    • Historical Market Size Value (USD Billion) & Volume (Units) Trend Analysis By Market Taxonomy, 2020 to 2024
    • Market Size Value (USD Billion) & Volume (Units) Forecast By Market Taxonomy, 2025 to 2035
      • By Country
        • China
        • Japan
        • South Korea
      • By Type
      • By Form
      • By Function
      • By Livestock
    • Market Attractiveness Analysis
      • By Country
      • By Type
      • By Form
      • By Function
      • By Livestock
    • Key Takeaways
  16. South Asia & Pacific Market Analysis 2020 to 2024 and Forecast 2025 to 2035, By Country
    • Historical Market Size Value (USD Billion) & Volume (Units) Trend Analysis By Market Taxonomy, 2020 to 2024
    • Market Size Value (USD Billion) & Volume (Units) Forecast By Market Taxonomy, 2025 to 2035
      • By Country
        • India
        • Australia & New Zealand
        • ASEAN
        • Rest of SAP
      • By Type
      • By Form
      • By Function
      • By Livestock
    • Market Attractiveness Analysis
      • By Country
      • By Type
      • By Form
      • By Function
      • By Livestock
    • Key Takeaways
  17. Middle East and Africa Market Analysis 2020 to 2024 and Forecast 2025 to 2035, By Country
    • Historical Market Size Value (USD Billion) & Volume (Units) Trend Analysis By Market Taxonomy, 2020 to 2024
    • Market Size Value (USD Billion) & Volume (Units) Forecast By Market Taxonomy, 2025 to 2035
      • By Country
        • GCC Countries
        • Northern Africa
        • South Africa
        • Turkiye
        • Rest of MEA
      • By Type
      • By Form
      • By Function
      • By Livestock
    • Market Attractiveness Analysis
      • By Country
      • By Type
      • By Form
      • By Function
      • By Livestock
    • Key Takeaways
  18. Key Countries Market Analysis
    • USA
      • Pricing Analysis
      • Market Share Analysis, 2024
        • By Type
        • By Form
        • By Function
        • By Livestock
    • Canada
      • Pricing Analysis
      • Market Share Analysis, 2024
        • By Type
        • By Form
        • By Function
        • By Livestock
    • Brazil
      • Pricing Analysis
      • Market Share Analysis, 2024
        • By Type
        • By Form
        • By Function
        • By Livestock
    • Mexico
      • Pricing Analysis
      • Market Share Analysis, 2024
        • By Type
        • By Form
        • By Function
        • By Livestock
    • Argentina
      • Pricing Analysis
      • Market Share Analysis, 2024
        • By Type
        • By Form
        • By Function
        • By Livestock
  19. Market Structure Analysis
    • Competition Dashboard
    • Competition Benchmarking
    • Market Share Analysis of Top Players
      • By Regional
      • By Type
      • By Form
      • By Function
      • By Livestock
  20. Competition Analysis
    • Competition Deep Dive
      • Cargill Inc.
        • Overview
        • Product Portfolio
        • Profitability by Market Segments (Product/Age /Sales Channel/Region)
        • Sales Footprint
        • Strategy Overview
          • Marketing Strategy
          • Product Strategy
          • Channel Strategy
      • BASF SE
        • Overview
        • Product Portfolio
        • Profitability by Market Segments (Product/Age /Sales Channel/Region)
        • Sales Footprint
        • Strategy Overview
          • Marketing Strategy
          • Product Strategy
          • Channel Strategy
      • Koninklijke DSM N.V.
        • Overview
        • Product Portfolio
        • Profitability by Market Segments (Product/Age /Sales Channel/Region)
        • Sales Footprint
        • Strategy Overview
          • Marketing Strategy
          • Product Strategy
          • Channel Strategy
      • Novozymes
        • Overview
        • Product Portfolio
        • Profitability by Market Segments (Product/Age /Sales Channel/Region)
        • Sales Footprint
        • Strategy Overview
          • Marketing Strategy
          • Product Strategy
          • Channel Strategy
      • Beneo Group
        • Overview
        • Product Portfolio
        • Profitability by Market Segments (Product/Age /Sales Channel/Region)
        • Sales Footprint
        • Strategy Overview
          • Marketing Strategy
          • Product Strategy
          • Channel Strategy
      • Lesaffre Group
        • Overview
        • Product Portfolio
        • Profitability by Market Segments (Product/Age /Sales Channel/Region)
        • Sales Footprint
        • Strategy Overview
          • Marketing Strategy
          • Product Strategy
          • Channel Strategy
      • Kemin Industries, Inc.
        • Overview
        • Product Portfolio
        • Profitability by Market Segments (Product/Age /Sales Channel/Region)
        • Sales Footprint
        • Strategy Overview
          • Marketing Strategy
          • Product Strategy
          • Channel Strategy
      • Novus International, Inc.
        • Overview
        • Product Portfolio
        • Profitability by Market Segments (Product/Age /Sales Channel/Region)
        • Sales Footprint
        • Strategy Overview
          • Marketing Strategy
          • Product Strategy
          • Channel Strategy
      • Chr. Hansen Holding A/S
        • Overview
        • Product Portfolio
        • Profitability by Market Segments (Product/Age /Sales Channel/Region)
        • Sales Footprint
        • Strategy Overview
          • Marketing Strategy
          • Product Strategy
          • Channel Strategy
  21. Assumptions & Acronyms Used
  22. Research Methodology

List of Tables

  • Table 1: Global Market Value (USD Billion) Forecast by Region, 2020-2035
  • Table 2: Global Market Volume (Units) Forecast by Region, 2020-2035
  • Table 3: Global Market Value (USD Billion) Forecast by Type, 2020-2035
  • Table 4: Global Market Volume (Units) Forecast by Type, 2020-2035
  • Table 5: Global Market Value (USD Billion) Forecast by Form, 2020-2035
  • Table 6: Global Market Volume (Units) Forecast by Form, 2020-2035
  • Table 7: Global Market Value (USD Billion) Forecast by Function, 2020-2035
  • Table 8: Global Market Volume (Units) Forecast by Function, 2020-2035
  • Table 9: Global Market Value (USD Billion) Forecast by Livestock, 2020-2035
  • Table 10: Global Market Volume (Units) Forecast by Livestock, 2020-2035
  • Table 11: North America Market Value (USD Billion) Forecast by Country, 2020-2035
  • Table 12: North America Market Volume (Units) Forecast by Country, 2020-2035
  • Table 13: North America Market Value (USD Billion) Forecast by Type, 2020-2035
  • Table 14: North America Market Volume (Units) Forecast by Type, 2020-2035
  • Table 15: North America Market Value (USD Billion) Forecast by Form, 2020-2035
  • Table 16: North America Market Volume (Units) Forecast by Form, 2020-2035
  • Table 17: North America Market Value (USD Billion) Forecast by Function, 2020-2035
  • Table 18: North America Market Volume (Units) Forecast by Function, 2020-2035
  • Table 19: North America Market Value (USD Billion) Forecast by Livestock, 2020-2035
  • Table 20: North America Market Volume (Units) Forecast by Livestock, 2020-2035
  • Table 21: Latin America Market Value (USD Billion) Forecast by Country, 2020-2035
  • Table 22: Latin America Market Volume (Units) Forecast by Country, 2020-2035
  • Table 23: Latin America Market Value (USD Billion) Forecast by Type, 2020-2035
  • Table 24: Latin America Market Volume (Units) Forecast by Type, 2020-2035
  • Table 25: Latin America Market Value (USD Billion) Forecast by Form, 2020-2035
  • Table 26: Latin America Market Volume (Units) Forecast by Form, 2020-2035
  • Table 27: Latin America Market Value (USD Billion) Forecast by Function, 2020-2035
  • Table 28: Latin America Market Volume (Units) Forecast by Function, 2020-2035
  • Table 29: Latin America Market Value (USD Billion) Forecast by Livestock, 2020-2035
  • Table 30: Latin America Market Volume (Units) Forecast by Livestock, 2020-2035
  • Table 31: Western Europe Market Value (USD Billion) Forecast by Country, 2020-2035
  • Table 32: Western Europe Market Volume (Units) Forecast by Country, 2020-2035
  • Table 33: Western Europe Market Value (USD Billion) Forecast by Type, 2020-2035
  • Table 34: Western Europe Market Volume (Units) Forecast by Type, 2020-2035
  • Table 35: Western Europe Market Value (USD Billion) Forecast by Form, 2020-2035
  • Table 36: Western Europe Market Volume (Units) Forecast by Form, 2020-2035
  • Table 37: Western Europe Market Value (USD Billion) Forecast by Function, 2020-2035
  • Table 38: Western Europe Market Volume (Units) Forecast by Function, 2020-2035
  • Table 39: Western Europe Market Value (USD Billion) Forecast by Livestock, 2020-2035
  • Table 40: Western Europe Market Volume (Units) Forecast by Livestock, 2020-2035
  • Table 41: Eastern Europe Market Value (USD Billion) Forecast by Country, 2020-2035
  • Table 42: Eastern Europe Market Volume (Units) Forecast by Country, 2020-2035
  • Table 43: Eastern Europe Market Value (USD Billion) Forecast by Type, 2020-2035
  • Table 44: Eastern Europe Market Volume (Units) Forecast by Type, 2020-2035
  • Table 45: Eastern Europe Market Value (USD Billion) Forecast by Form, 2020-2035
  • Table 46: Eastern Europe Market Volume (Units) Forecast by Form, 2020-2035
  • Table 47: Eastern Europe Market Value (USD Billion) Forecast by Function, 2020-2035
  • Table 48: Eastern Europe Market Volume (Units) Forecast by Function, 2020-2035
  • Table 49: Eastern Europe Market Value (USD Billion) Forecast by Livestock, 2020-2035
  • Table 50: Eastern Europe Market Volume (Units) Forecast by Livestock, 2020-2035
  • Table 51: East Asia Market Value (USD Billion) Forecast by Country, 2020-2035
  • Table 52: East Asia Market Volume (Units) Forecast by Country, 2020-2035
  • Table 53: East Asia Market Value (USD Billion) Forecast by Type, 2020-2035
  • Table 54: East Asia Market Volume (Units) Forecast by Type, 2020-2035
  • Table 55: East Asia Market Value (USD Billion) Forecast by Form, 2020-2035
  • Table 56: East Asia Market Volume (Units) Forecast by Form, 2020-2035
  • Table 57: East Asia Market Value (USD Billion) Forecast by Function, 2020-2035
  • Table 58: East Asia Market Volume (Units) Forecast by Function, 2020-2035
  • Table 59: East Asia Market Value (USD Billion) Forecast by Livestock, 2020-2035
  • Table 60: East Asia Market Volume (Units) Forecast by Livestock, 2020-2035
  • Table 61: South Asia & Pacific Market Value (USD Billion) Forecast by Country, 2020-2035
  • Table 62: South Asia & Pacific Market Volume (Units) Forecast by Country, 2020-2035
  • Table 63: South Asia & Pacific Market Value (USD Billion) Forecast by Type, 2020-2035
  • Table 64: South Asia & Pacific Market Volume (Units) Forecast by Type, 2020-2035
  • Table 65: South Asia & Pacific Market Value (USD Billion) Forecast by Form, 2020-2035
  • Table 66: South Asia & Pacific Market Volume (Units) Forecast by Form, 2020-2035
  • Table 67: South Asia & Pacific Market Value (USD Billion) Forecast by Function, 2020-2035
  • Table 68: South Asia & Pacific Market Volume (Units) Forecast by Function, 2020-2035
  • Table 69: South Asia & Pacific Market Value (USD Billion) Forecast by Livestock, 2020-2035
  • Table 70: South Asia & Pacific Market Volume (Units) Forecast by Livestock, 2020-2035
  • Table 71: Middle East and Africa Market Value (USD Billion) Forecast by Country, 2020-2035
  • Table 72: Middle East and Africa Market Volume (Units) Forecast by Country, 2020-2035
  • Table 73: Middle East and Africa Market Value (USD Billion) Forecast by Type, 2020-2035
  • Table 74: Middle East and Africa Market Volume (Units) Forecast by Type, 2020-2035
  • Table 75: Middle East and Africa Market Value (USD Billion) Forecast by Form, 2020-2035
  • Table 76: Middle East and Africa Market Volume (Units) Forecast by Form, 2020-2035
  • Table 77: Middle East and Africa Market Value (USD Billion) Forecast by Function, 2020-2035
  • Table 78: Middle East and Africa Market Volume (Units) Forecast by Function, 2020-2035
  • Table 79: Middle East and Africa Market Value (USD Billion) Forecast by Livestock, 2020-2035
  • Table 80: Middle East and Africa Market Volume (Units) Forecast by Livestock, 2020-2035

List of Figures

  • Figure 1: Global Market Volume (Units) Forecast 2020-2035
  • Figure 2: Global Market Pricing Analysis
  • Figure 3: Global Market Value (USD Billion) Forecast 2020-2035
  • Figure 4: Global Market Value Share and BPS Analysis by Type, 2025 and 2035
  • Figure 5: Global Market Y-o-Y Growth Comparison by Type, 2025-2035
  • Figure 6: Global Market Attractiveness Analysis by Type
  • Figure 7: Global Market Value Share and BPS Analysis by Form, 2025 and 2035
  • Figure 8: Global Market Y-o-Y Growth Comparison by Form, 2025-2035
  • Figure 9: Global Market Attractiveness Analysis by Form
  • Figure 10: Global Market Value Share and BPS Analysis by Function, 2025 and 2035
  • Figure 11: Global Market Y-o-Y Growth Comparison by Function, 2025-2035
  • Figure 12: Global Market Attractiveness Analysis by Function
  • Figure 13: Global Market Value Share and BPS Analysis by Livestock, 2025 and 2035
  • Figure 14: Global Market Y-o-Y Growth Comparison by Livestock, 2025-2035
  • Figure 15: Global Market Attractiveness Analysis by Livestock
  • Figure 16: Global Market Value (USD Billion) Share and BPS Analysis by Region, 2025 and 2035
  • Figure 17: Global Market Y-o-Y Growth Comparison by Region, 2025-2035
  • Figure 18: Global Market Attractiveness Analysis by Region
  • Figure 19: North America Market Incremental $ Opportunity, 2025-2035
  • Figure 20: Latin America Market Incremental $ Opportunity, 2025-2035
  • Figure 21: Western Europe Market Incremental $ Opportunity, 2025-2035
  • Figure 22: Eastern Europe Market Incremental $ Opportunity, 2025-2035
  • Figure 23: East Asia Market Incremental $ Opportunity, 2025-2035
  • Figure 24: South Asia & Pacific Market Incremental $ Opportunity, 2025-2035
  • Figure 25: Middle East and Africa Market Incremental $ Opportunity, 2025-2035
  • Figure 26: North America Market Value Share and BPS Analysis by Country, 2025 and 2035
  • Figure 27: North America Market Value Share and BPS Analysis by Type, 2025 and 2035
  • Figure 28: North America Market Y-o-Y Growth Comparison by Type, 2025-2035
  • Figure 29: North America Market Attractiveness Analysis by Type
  • Figure 30: North America Market Value Share and BPS Analysis by Form, 2025 and 2035
  • Figure 31: North America Market Y-o-Y Growth Comparison by Form, 2025-2035
  • Figure 32: North America Market Attractiveness Analysis by Form
  • Figure 33: North America Market Value Share and BPS Analysis by Function, 2025 and 2035
  • Figure 34: North America Market Y-o-Y Growth Comparison by Function, 2025-2035
  • Figure 35: North America Market Attractiveness Analysis by Function
  • Figure 36: North America Market Value Share and BPS Analysis by Livestock, 2025 and 2035
  • Figure 37: North America Market Y-o-Y Growth Comparison by Livestock, 2025-2035
  • Figure 38: North America Market Attractiveness Analysis by Livestock
  • Figure 39: Latin America Market Value Share and BPS Analysis by Country, 2025 and 2035
  • Figure 40: Latin America Market Value Share and BPS Analysis by Type, 2025 and 2035
  • Figure 41: Latin America Market Y-o-Y Growth Comparison by Type, 2025-2035
  • Figure 42: Latin America Market Attractiveness Analysis by Type
  • Figure 43: Latin America Market Value Share and BPS Analysis by Form, 2025 and 2035
  • Figure 44: Latin America Market Y-o-Y Growth Comparison by Form, 2025-2035
  • Figure 45: Latin America Market Attractiveness Analysis by Form
  • Figure 46: Latin America Market Value Share and BPS Analysis by Function, 2025 and 2035
  • Figure 47: Latin America Market Y-o-Y Growth Comparison by Function, 2025-2035
  • Figure 48: Latin America Market Attractiveness Analysis by Function
  • Figure 49: Latin America Market Value Share and BPS Analysis by Livestock, 2025 and 2035
  • Figure 50: Latin America Market Y-o-Y Growth Comparison by Livestock, 2025-2035
  • Figure 51: Latin America Market Attractiveness Analysis by Livestock
  • Figure 52: Western Europe Market Value Share and BPS Analysis by Country, 2025 and 2035
  • Figure 53: Western Europe Market Value Share and BPS Analysis by Type, 2025 and 2035
  • Figure 54: Western Europe Market Y-o-Y Growth Comparison by Type, 2025-2035
  • Figure 55: Western Europe Market Attractiveness Analysis by Type
  • Figure 56: Western Europe Market Value Share and BPS Analysis by Form, 2025 and 2035
  • Figure 57: Western Europe Market Y-o-Y Growth Comparison by Form, 2025-2035
  • Figure 58: Western Europe Market Attractiveness Analysis by Form
  • Figure 59: Western Europe Market Value Share and BPS Analysis by Function, 2025 and 2035
  • Figure 60: Western Europe Market Y-o-Y Growth Comparison by Function, 2025-2035
  • Figure 61: Western Europe Market Attractiveness Analysis by Function
  • Figure 62: Western Europe Market Value Share and BPS Analysis by Livestock, 2025 and 2035
  • Figure 63: Western Europe Market Y-o-Y Growth Comparison by Livestock, 2025-2035
  • Figure 64: Western Europe Market Attractiveness Analysis by Livestock
  • Figure 65: Eastern Europe Market Value Share and BPS Analysis by Country, 2025 and 2035
  • Figure 66: Eastern Europe Market Value Share and BPS Analysis by Type, 2025 and 2035
  • Figure 67: Eastern Europe Market Y-o-Y Growth Comparison by Type, 2025-2035
  • Figure 68: Eastern Europe Market Attractiveness Analysis by Type
  • Figure 69: Eastern Europe Market Value Share and BPS Analysis by Form, 2025 and 2035
  • Figure 70: Eastern Europe Market Y-o-Y Growth Comparison by Form, 2025-2035
  • Figure 71: Eastern Europe Market Attractiveness Analysis by Form
  • Figure 72: Eastern Europe Market Value Share and BPS Analysis by Function, 2025 and 2035
  • Figure 73: Eastern Europe Market Y-o-Y Growth Comparison by Function, 2025-2035
  • Figure 74: Eastern Europe Market Attractiveness Analysis by Function
  • Figure 75: Eastern Europe Market Value Share and BPS Analysis by Livestock, 2025 and 2035
  • Figure 76: Eastern Europe Market Y-o-Y Growth Comparison by Livestock, 2025-2035
  • Figure 77: Eastern Europe Market Attractiveness Analysis by Livestock
  • Figure 78: East Asia Market Value Share and BPS Analysis by Country, 2025 and 2035
  • Figure 79: East Asia Market Value Share and BPS Analysis by Type, 2025 and 2035
  • Figure 80: East Asia Market Y-o-Y Growth Comparison by Type, 2025-2035
  • Figure 81: East Asia Market Attractiveness Analysis by Type
  • Figure 82: East Asia Market Value Share and BPS Analysis by Form, 2025 and 2035
  • Figure 83: East Asia Market Y-o-Y Growth Comparison by Form, 2025-2035
  • Figure 84: East Asia Market Attractiveness Analysis by Form
  • Figure 85: East Asia Market Value Share and BPS Analysis by Function, 2025 and 2035
  • Figure 86: East Asia Market Y-o-Y Growth Comparison by Function, 2025-2035
  • Figure 87: East Asia Market Attractiveness Analysis by Function
  • Figure 88: East Asia Market Value Share and BPS Analysis by Livestock, 2025 and 2035
  • Figure 89: East Asia Market Y-o-Y Growth Comparison by Livestock, 2025-2035
  • Figure 90: East Asia Market Attractiveness Analysis by Livestock
  • Figure 91: South Asia & Pacific Market Value Share and BPS Analysis by Country, 2025 and 2035
  • Figure 92: South Asia & Pacific Market Value Share and BPS Analysis by Type, 2025 and 2035
  • Figure 93: South Asia & Pacific Market Y-o-Y Growth Comparison by Type, 2025-2035
  • Figure 94: South Asia & Pacific Market Attractiveness Analysis by Type
  • Figure 95: South Asia & Pacific Market Value Share and BPS Analysis by Form, 2025 and 2035
  • Figure 96: South Asia & Pacific Market Y-o-Y Growth Comparison by Form, 2025-2035
  • Figure 97: South Asia & Pacific Market Attractiveness Analysis by Form
  • Figure 98: South Asia & Pacific Market Value Share and BPS Analysis by Function, 2025 and 2035
  • Figure 99: South Asia & Pacific Market Y-o-Y Growth Comparison by Function, 2025-2035
  • Figure 100: South Asia & Pacific Market Attractiveness Analysis by Function
  • Figure 101: South Asia & Pacific Market Value Share and BPS Analysis by Livestock, 2025 and 2035
  • Figure 102: South Asia & Pacific Market Y-o-Y Growth Comparison by Livestock, 2025-2035
  • Figure 103: South Asia & Pacific Market Attractiveness Analysis by Livestock
  • Figure 104: Middle East and Africa Market Value Share and BPS Analysis by Country, 2025 and 2035
  • Figure 105: Middle East and Africa Market Value Share and BPS Analysis by Type, 2025 and 2035
  • Figure 106: Middle East and Africa Market Y-o-Y Growth Comparison by Type, 2025-2035
  • Figure 107: Middle East and Africa Market Attractiveness Analysis by Type
  • Figure 108: Middle East and Africa Market Value Share and BPS Analysis by Form, 2025 and 2035
  • Figure 109: Middle East and Africa Market Y-o-Y Growth Comparison by Form, 2025-2035
  • Figure 110: Middle East and Africa Market Attractiveness Analysis by Form
  • Figure 111: Middle East and Africa Market Value Share and BPS Analysis by Function, 2025 and 2035
  • Figure 112: Middle East and Africa Market Y-o-Y Growth Comparison by Function, 2025-2035
  • Figure 113: Middle East and Africa Market Attractiveness Analysis by Function
  • Figure 114: Middle East and Africa Market Value Share and BPS Analysis by Livestock, 2025 and 2035
  • Figure 115: Middle East and Africa Market Y-o-Y Growth Comparison by Livestock, 2025-2035
  • Figure 116: Middle East and Africa Market Attractiveness Analysis by Livestock
  • Figure 117: Global Market - Tier Structure Analysis
  • Figure 118: Global Market - Company Share Analysis

Frequently Asked Questions

What is the projected size of the eubiotics market in 2025?

The market is valued at USD 4.8 billion in 2025.

What is the outlook on eubiotics demand by 2035?

The market is forecasted to reach USD 9.4 billion by 2035, reflecting a CAGR of 7.0%.

Which segment leads the eubiotics market by type in 2035?

Probiotics will lead the type segment, accounting for 42% of the global market share in 2035.

Which form dominates the eubiotics market by 2035?

Dry form will dominate the form segment with a 68% market share in 2035.

Which country is projected to have the fastest-growing eubiotics market?

Germany is projected to grow at the fastest rate, with a CAGR of 11.5% from 2025 to 2035.

Future Market Insights

Eubiotics Market