Herbicides Market Size and Share Forecast Outlook 2025 to 2035

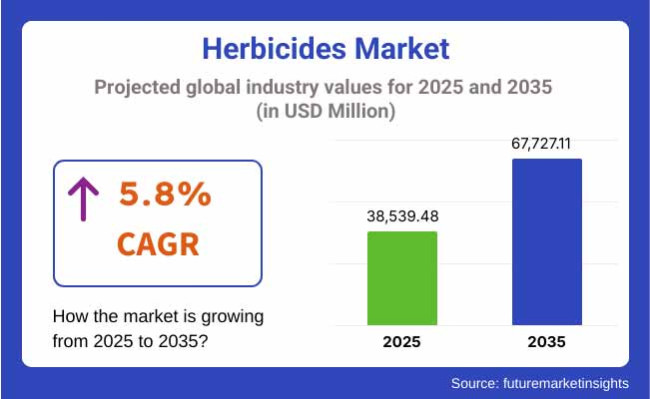
The global herbicides market is projected to expand from USD 38,539.4 Million in 2025 to USD 67,727.1 Million by 2035, advancing at a CAGR of 5.8% during the forecast period. The growth is primarily driven by rising food security concerns, shrinking arable land, and an increasing focus on crop yield optimization. Widespread adoption of conservation tillage and no-till farming systems-especially in North America, South America, and Asia-Pacific-has augmented the demand for herbicides that enable efficient weed control with minimal soil disruption.
Quick Stats for Herbicides Market

  • Industry Value (2025): USD 38,539.4 Million
  • Forecast Value (2035): USD 67,727.1 Million
  • Forecast CAGR (2025 to 2035): 5.8%
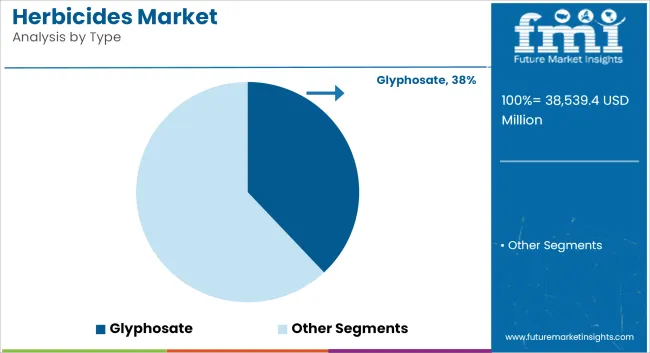
  • Leading Segment by Type in 2025: Glyphosate (≈38% market share)
  • Top Key Players: Bayer AG, BASF SE, Syngenta AG, Corteva Agriscience, FMC Corporation, UPL Ltd., ADAMA Ltd.

Herbicides Market

Metric Value
Market Size in 2025 USD 38,539.4 Million
Projected Market Size in 2035 USD 67,727.1 Million
CAGR (2025 to 2035) 5.8%

Rapid agricultural mechanization, especially in emerging economies, along with government subsidies and integrated weed management programs, is reinforcing market expansion. Moreover, climate change-induced weed pressure and evolving resistance in major crops are prompting the development and deployment of innovative herbicidal molecules and combination products. In particular, glyphosate remains a dominant molecule, supported by its broad-spectrum activity and compatibility with genetically modified (GM) crops.

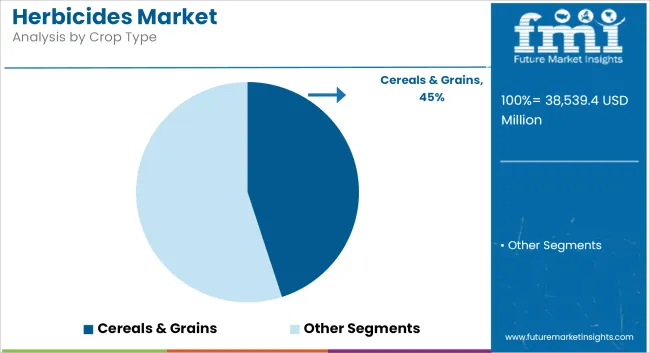
Cereal and grain production especially corn, wheat, and rice constitutes the largest segment of herbicide application. Leading agribusinesses are investing in eco-efficient herbicide formulations that comply with stricter environmental and residue standards, while also addressing the growing demand for residue-free and sustainable farming practices.

Technological advancements such as drone-assisted spraying, precision farming, and AI-based weed detection are increasing application efficiency and reducing input waste. Simultaneously, new bio-based herbicides and resistance management solutions are gaining traction in markets with stringent chemical usage norms like the EU and Japan.

Analyzing Herbicides Market by Top Investing Segments

Glyphosate Dominates as Broad-Spectrum Weed Control Remains Critical

Glyphosate is expected to retain its position as the leading herbicide type, accounting for approximately 38% of global herbicide sales in 2025, with projected growth at a CAGR of 5.8% through 2035. Despite regulatory scrutiny in certain regions, glyphosate remains the backbone of weed control programs due to its broad-spectrum efficacy, affordability, and systemic action.

Its widespread integration with glyphosate-resistant GM crops in the USA, Brazil, and Argentina has solidified its usage in large-scale commercial farming. With rising labor shortages and increasing demand for zero-tillage practices, glyphosate-based solutions are being rapidly adopted to support efficient weed management with fewer field operations.

Leading companies such as Bayer and Corteva are investing in next-generation glyphosate formulations with enhanced safety profiles, drift control features, and resistance management additives. Even in regions facing tighter regulatory control, glyphosate remains indispensable due to the lack of cost-effective alternatives that offer comparable field performance.

Furthermore, the integration of glyphosate with digital agriculture platforms, real-time field mapping, and automated sprayers is improving application precision, reducing environmental impact, and enhancing return on investment for farmers worldwide.
Cereals & Grains Segment to Drive Maximum Herbicide Demand

The cereals and grains segment led by corn, rice, and wheat is forecast to account for over 45% of herbicide consumption in 2025, growing at a CAGR of 6.6% over the next decade. These staple crops require consistent and timely weed control to protect yields, particularly in intensively cultivated regions like Asia-Pacific, North America, and Eastern Europe.

Surging food demand, particularly in populous nations such as India and China, is prompting farmers to increase yield per hectare, making herbicides a vital component of modern crop protection programs. In Brazil and Argentina, herbicide use in soybean-corn rotation cycles is increasing due to its efficiency in controlling both broadleaf and grassy weeds.

The integration of herbicides into pre- and post-emergence treatment programs ensures season-long weed suppression, improves nutrient availability, and reduces competition for sunlight and water. Companies are tailoring crop-specific and climate-resilient herbicide solutions for key grain-growing belts, aligning with region-specific agronomic practices.

Government incentives to boost grain productivity and reduce import dependency are catalyzing the adoption of herbicide-tolerant crops and enabling more frequent herbicide usage, especially in India, Sub-Saharan Africa, and Southeast Asia.
Challenges and Opportunities

Challenge

Regulatory Restrictions and Environmental Concerns

Stringent regulations in the herbicides market are expected to cool down the market growth due to rising concerns over its impact on human and environmental health. Around the world, government agencies are mulling or implementing curtailments of chemical herbicides like glyphosate based in part on their suggested connections to soil degradation, groundwater contamination and possible health risks.

This increases compliance costs for manufacturers and restricts product availability across different regions. To both comply with regulations and retain competitive advantage in the marketplace, companies need to devote resources to developing sustainable herbicide formulations and exploring bio-based alternatives.

Growing Herbicide Resistance in Weeds

The rising resistance of weeds to widely used herbicide poses a serious threat to nowpect agricultural industry. The overuse of chemical herbicides has created weed species resistant to these chemical products, making traditional herbicides less effective. This requires the discovery of new active substances, but also integrated approaches of weed control to electrical weed management (EWM), which combines chemical, mechanical and biological methods in order to overcome resistance problems.

Opportunity

Rising Demand for Bio-Based and Organic Herbicides

The importance given to sustainable agriculture and organic farming is increasing and hence the market for bio-based and organic herbicides is expected to grow. Farmers are also gradually moving towards natural solutions for weed control to reduce the environmental impacts and satisfy consumers looking for organic products. Therefore, organizations involved with the research and development of eco-friendly formulations targeted for herbicides are likely to profit in this market.

Technological Advancements in Precision Agriculture

AI is also playing its part in progressing precision agriculture by improving spraying systems, unleashing drones or even applying precision herbicides with a GPS system that minimizes chemical waste. Such technologies allow farmers to use herbicides more accurately, reducing impact on the environment and increasing crop yield. Adoption of digital farming technologies and smart click here herbicide classification methods by the companies can help in capitalize on this trend and expand their market presence.
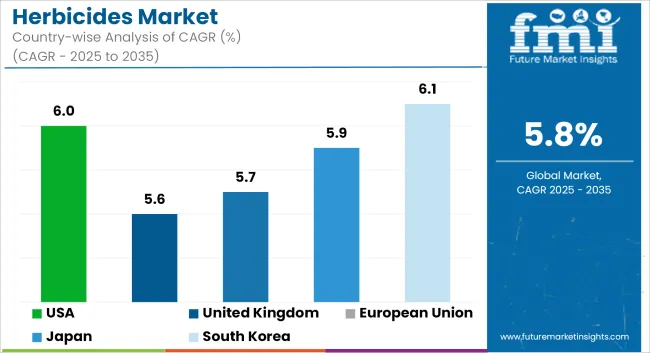
Country-wise Outlook- Herbicides Market

United States

The demand for herbicides in the USA is steadily increasing due to the growing adoption of advanced weed management solutions. Moreover, increasing concerns regarding crop yield optimization and growing demand for sustainable farming practices are promoting the utilization of selective and non-selective herbicides.

Moreover, increasing planting of genetically modified (GM) crops resistant to herbicides and active investment in precision agriculture are also driving the growth of the market. Industry Trends: The move towards bio-based herbicides and regulatory policies surrounding the organic applications of chemicals.

Country CAGR (2025 to 2035)
USA 6.0%

United Kingdom

The UK herbicides market is expanding amid increased concerns about food security and the effectiveness of agriculture. To minimize crop losses and improve productivity, farmer are rapidly adopting herbicides.

Moreover, government regulations favoring sustainable agriculture and integrated weed management strategies, are stimulating the need for eco-friendly and bio-based herbicides. Market dynamics are also being impacted by developments in agrochemical formulations and increasing research on herbicide-resistant weeds.

Country CAGR (2025 to 2035)
UK 5.6%

European Union

The EU herbicides market negatively impacted by stringent rules towards the use of chemical pesticides and rise in organic farming. Soaring adoption of bio-herbicides in sustainable agriculture are prompting countries like Germany, France, and Spain to move towards sustainable agricultural practices.

With the European Green Deal and the Farm to Fork strategy encouraging farmers across the EU to limit chemical herbicide consumption, there is continuing innovation in why new methods of weed control. The presence of key agrochemical companies and increasing R&D spending are also supporting market growth.

Country CAGR (2025 to 2035)
European Union (EU) 5.7%

Japan

There is growing demand for herbicides in Japan, driven by the country’s emphasis on precision agriculture and reducing labor needs in farming. Due to the aging farmer population, herbicide use for weed control is only going to continue for the short term.

Moreover, innovations in technology, such as slow-release and targeted application products (along with other herbicide formulations) are propelling market demand. AI and drone technologies are also getting integrated for precision herbicide application, and this is also shaping the market trends.

Country CAGR (2025 to 2035)
Japan 5.9%

South Korea

The growth in agricultural modernization and enhanced government support for smart farming in South Korea is driving the market for herbicides in the country.

The trend for sustainable or less harmful herbicides, along with a more nuanced knowledge about the role of chemical residues in soil health, is affecting market demand. Research on new generation of herbicides with less environmental impact is on the rise which is further supporting the market growth.

Country CAGR (2025 to 2035)
South Korea 6.1%

Competitive Outlook

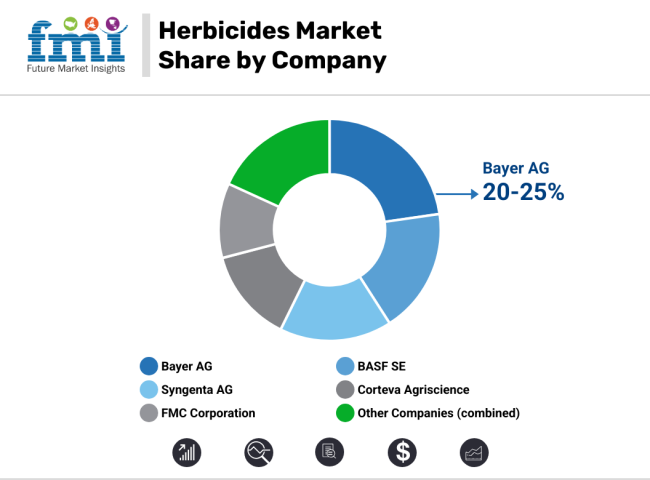
Herbicides Market Share By Company

The herbicides market is characterized by a dynamic competitive landscape shaped by consolidation, innovation, and regulatory adaptation. Key players including Bayer AG, Syngenta, Corteva Agriscience, FMC, BASF, and UPL are pursuing aggressive strategies in both molecule innovation and geographic expansion. Emphasis is being placed on the development of low-drift, low-residue, and multi-mode-of-action herbicides to combat weed resistance and meet environmental standards.

Global leaders are scaling up R&D investments in bio-herbicides and precision application tools to enable sustainable weed control. Strategic acquisitions and partnerships are being used to build resilient product pipelines and distribution networks in high-growth regions like Africa, ASEAN, and Latin America. Notable examples include collaborations for AI-powered spray optimization and drone-compatible formulations.

  • 2025, Corteva Agriscience launched Enversa 3CS, a proprietary encapsulated formulation of acetochlor for use in soybeans and corn. This formulation enables extended residual control of small-seeded annual weeds and grasses, with excellent crop safety and tank-mix compatibility. It is already registered and being marketed
  • January 21, 2025, BASF introduced Liberty Ultra 1.76SL, a next-generation herbicide containing L-glufosinate, a more active isomer than previous formulations. This allows for lower use rates and improved spray retention on weed foliage, enhancing performance and crop safety. It is designed for glufosinate-resistant crops.

Key Players

  • BASF SE
  • DowDupont Inc.
  • Bayer AG
  • FMC Corporation
  • Syngenta AG
  • Nufarm Limited
  • Nissan Chemical Industries Ltd.
  • Drexel Chemical Company
  • ADAMA Germany GmbH
  • Otsuka AgriTechno Co Ltd

Key Segments

By Type:

  • Glyphosate
  • Diquat
  • 2,4-D

By Crop Type:

  • Cereals & grains
  • Oilseeds & pulses
  • Fruits & vegetables
  • Others

By Region:

  • North America
  • Latin America
  • East Asia
  • South Asia & Pacific
  • Eastern Europe
  • Western Europe
  • Middle East & Africa

Table of Content

  1. Executive Summary
  2. Industry Introduction, including Taxonomy and Market Definition
  3. Market Trends and Success Factors, including Macro-economic Factors, Market Dynamics, and Recent Industry Developments
  4. Market Demand Analysis 2020 to 2024 and Forecast 2025 to 2035, including Historical Analysis and Future Projections
  5. Pricing Analysis
  6. Market Analysis 2020 to 2024 and Forecast 2025 to 2035
    • By Type
    • By Crop Type
  7. Market Analysis 2020 to 2024 and Forecast 2025 to 2035, By Type
    • Glyphosate
    • Diquat
    • 2,4-D
  8. Market Analysis 2020 to 2024 and Forecast 2025 to 2035, By Crop Type
    • Cereals & Grains
    • Oilseeds & Pulses
    • Fruits & Vegetables
    • Others
  9. Market Analysis 2020 to 2024 and Forecast 2025 to 2035, By Region
    • North America
    • Latin America
    • East Asia
    • South Asia & Pacific
    • Eastern Europe
    • Western Europe
    • Middle East & Africa
  10. North America Sales Analysis 2020 to 2024 and Forecast 2025 to 2035, by Key Segments and Countries
  11. Latin America Sales Analysis 2020 to 2024 and Forecast 2025 to 2035, by Key Segments and Countries
  12. East Asia Sales Analysis 2020 to 2024 and Forecast 2025 to 2035, by Key Segments and Countries
  13. South Asia & Pacific Sales Analysis 2020 to 2024 and Forecast 2025 to 2035, by Key Segments and Countries
  14. Eastern Europe Sales Analysis 2020 to 2024 and Forecast 2025 to 2035, by Key Segments and Countries
  15. Western Europe Sales Analysis 2020 to 2024 and Forecast 2025 to 2035, by Key Segments and Countries
  16. Middle East & Africa Sales Analysis 2020 to 2024 and Forecast 2025 to 2035, by Key Segments and Countries
  17. Sales Forecast 2025 to 2035 by Type and Crop Type for 30 Countries
  18. Competition Outlook, including Market Structure Analysis, Company Share Analysis by Key Players, and Competition Dashboard
  19. Company Profile
    • BASF SE
    • DowDupont Inc.
    • Bayer AG
    • FMC Corporation
    • Syngenta AG
    • Nufarm Limited
    • Nissan Chemical Industries Ltd.
    • Drexel Chemical Company
    • ADAMA Germany GmbH
    • Otsuka AgriTechno Co Ltd

List of Tables

  • Table 1: Global Market Value (USD Million) Forecast by Region, 2020 to 2035
  • Table 2: Global Market Volume (Tons) Forecast by Region, 2020 to 2035
  • Table 3: Global Market Value (USD Million) Forecast by Product Type, 2020 to 2035
  • Table 4: Global Market Volume (Tons) Forecast by Product Type, 2020 to 2035
  • Table 5: Global Market Value (USD Million) Forecast by Mode of Action, 2020 to 2035
  • Table 6: Global Market Volume (Tons) Forecast by Mode of Action, 2020 to 2035
  • Table 7: Global Market Value (USD Million) Forecast by Crop Type, 2020 to 2035
  • Table 8: Global Market Volume (Tons) Forecast by Crop Type, 2020 to 2035
  • Table 9: North America Market Value (USD Million) Forecast by Country, 2020 to 2035
  • Table 10: North America Market Volume (Tons) Forecast by Country, 2020 to 2035
  • Table 11: North America Market Value (USD Million) Forecast by Product Type, 2020 to 2035
  • Table 12: North America Market Volume (Tons) Forecast by Product Type, 2020 to 2035
  • Table 13: North America Market Value (USD Million) Forecast by Mode of Action, 2020 to 2035
  • Table 14: North America Market Volume (Tons) Forecast by Mode of Action, 2020 to 2035
  • Table 15: North America Market Value (USD Million) Forecast by Crop Type, 2020 to 2035
  • Table 16: North America Market Volume (Tons) Forecast by Crop Type, 2020 to 2035
  • Table 17: Latin America Market Value (USD Million) Forecast by Country, 2020 to 2035
  • Table 18: Latin America Market Volume (Tons) Forecast by Country, 2020 to 2035
  • Table 19: Latin America Market Value (USD Million) Forecast by Product Type, 2020 to 2035
  • Table 20: Latin America Market Volume (Tons) Forecast by Product Type, 2020 to 2035
  • Table 21: Latin America Market Value (USD Million) Forecast by Mode of Action, 2020 to 2035
  • Table 22: Latin America Market Volume (Tons) Forecast by Mode of Action, 2020 to 2035
  • Table 23: Latin America Market Value (USD Million) Forecast by Crop Type, 2020 to 2035
  • Table 24: Latin America Market Volume (Tons) Forecast by Crop Type, 2020 to 2035
  • Table 25: Europe Market Value (USD Million) Forecast by Country, 2020 to 2035
  • Table 26: Europe Market Volume (Tons) Forecast by Country, 2020 to 2035
  • Table 27: Europe Market Value (USD Million) Forecast by Product Type, 2020 to 2035
  • Table 28: Europe Market Volume (Tons) Forecast by Product Type, 2020 to 2035
  • Table 29: Europe Market Value (USD Million) Forecast by Mode of Action, 2020 to 2035
  • Table 30: Europe Market Volume (Tons) Forecast by Mode of Action, 2020 to 2035
  • Table 31: Europe Market Value (USD Million) Forecast by Crop Type, 2020 to 2035
  • Table 32: Europe Market Volume (Tons) Forecast by Crop Type, 2020 to 2035
  • Table 33: East Asia Market Value (USD Million) Forecast by Country, 2020 to 2035
  • Table 34: East Asia Market Volume (Tons) Forecast by Country, 2020 to 2035
  • Table 35: East Asia Market Value (USD Million) Forecast by Product Type, 2020 to 2035
  • Table 36: East Asia Market Volume (Tons) Forecast by Product Type, 2020 to 2035
  • Table 37: East Asia Market Value (USD Million) Forecast by Mode of Action, 2020 to 2035
  • Table 38: East Asia Market Volume (Tons) Forecast by Mode of Action, 2020 to 2035
  • Table 39: East Asia Market Value (USD Million) Forecast by Crop Type, 2020 to 2035
  • Table 40: East Asia Market Volume (Tons) Forecast by Crop Type, 2020 to 2035
  • Table 41: South Asia & Pacific Market Value (USD Million) Forecast by Country, 2020 to 2035
  • Table 42: South Asia & Pacific Market Volume (Tons) Forecast by Country, 2020 to 2035
  • Table 43: South Asia & Pacific Market Value (USD Million) Forecast by Product Type, 2020 to 2035
  • Table 44: South Asia & Pacific Market Volume (Tons) Forecast by Product Type, 2020 to 2035
  • Table 45: South Asia & Pacific Market Value (USD Million) Forecast by Mode of Action, 2020 to 2035
  • Table 46: South Asia & Pacific Market Volume (Tons) Forecast by Mode of Action, 2020 to 2035
  • Table 47: South Asia & Pacific Market Value (USD Million) Forecast by Crop Type, 2020 to 2035
  • Table 48: South Asia & Pacific Market Volume (Tons) Forecast by Crop Type, 2020 to 2035
  • Table 49: MEA Market Value (USD Million) Forecast by Country, 2020 to 2035
  • Table 50: MEA Market Volume (Tons) Forecast by Country, 2020 to 2035
  • Table 51: MEA Market Value (USD Million) Forecast by Product Type, 2020 to 2035
  • Table 52: MEA Market Volume (Tons) Forecast by Product Type, 2020 to 2035
  • Table 53: MEA Market Value (USD Million) Forecast by Mode of Action, 2020 to 2035
  • Table 54: MEA Market Volume (Tons) Forecast by Mode of Action, 2020 to 2035
  • Table 55: MEA Market Value (USD Million) Forecast by Crop Type, 2020 to 2035
  • Table 56: MEA Market Volume (Tons) Forecast by Crop Type, 2020 to 2035

List of Figures

  • Figure 1: Global Market Value (USD Million) by Product Type, 2025 to 2035
  • Figure 2: Global Market Value (USD Million) by Mode of Action, 2025 to 2035
  • Figure 3: Global Market Value (USD Million) by Crop Type, 2025 to 2035
  • Figure 4: Global Market Value (USD Million) by Region, 2025 to 2035
  • Figure 5: Global Market Value (USD Million) Analysis by Region, 2020 to 2035
  • Figure 6: Global Market Volume (Tons) Analysis by Region, 2020 to 2035
  • Figure 7: Global Market Value Share (%) and BPS Analysis by Region, 2025 to 2035
  • Figure 8: Global Market Y-o-Y Growth (%) Projections by Region, 2025 to 2035
  • Figure 9: Global Market Value (USD Million) Analysis by Product Type, 2020 to 2035
  • Figure 10: Global Market Volume (Tons) Analysis by Product Type, 2020 to 2035
  • Figure 11: Global Market Value Share (%) and BPS Analysis by Product Type, 2025 to 2035
  • Figure 12: Global Market Y-o-Y Growth (%) Projections by Product Type, 2025 to 2035
  • Figure 13: Global Market Value (USD Million) Analysis by Mode of Action, 2020 to 2035
  • Figure 14: Global Market Volume (Tons) Analysis by Mode of Action, 2020 to 2035
  • Figure 15: Global Market Value Share (%) and BPS Analysis by Mode of Action, 2025 to 2035
  • Figure 16: Global Market Y-o-Y Growth (%) Projections by Mode of Action, 2025 to 2035
  • Figure 17: Global Market Value (USD Million) Analysis by Crop Type, 2020 to 2035
  • Figure 18: Global Market Volume (Tons) Analysis by Crop Type, 2020 to 2035
  • Figure 19: Global Market Value Share (%) and BPS Analysis by Crop Type, 2025 to 2035
  • Figure 20: Global Market Y-o-Y Growth (%) Projections by Crop Type, 2025 to 2035
  • Figure 21: Global Market Attractiveness by Product Type, 2025 to 2035
  • Figure 22: Global Market Attractiveness by Mode of Action, 2025 to 2035
  • Figure 23: Global Market Attractiveness by Crop Type, 2025 to 2035
  • Figure 24: Global Market Attractiveness by Region, 2025 to 2035
  • Figure 25: North America Market Value (USD Million) by Product Type, 2025 to 2035
  • Figure 26: North America Market Value (USD Million) by Mode of Action, 2025 to 2035
  • Figure 27: North America Market Value (USD Million) by Crop Type, 2025 to 2035
  • Figure 28: North America Market Value (USD Million) by Country, 2025 to 2035
  • Figure 29: North America Market Value (USD Million) Analysis by Country, 2020 to 2035
  • Figure 30: North America Market Volume (Tons) Analysis by Country, 2020 to 2035
  • Figure 31: North America Market Value Share (%) and BPS Analysis by Country, 2025 to 2035
  • Figure 32: North America Market Y-o-Y Growth (%) Projections by Country, 2025 to 2035
  • Figure 33: North America Market Value (USD Million) Analysis by Product Type, 2020 to 2035
  • Figure 34: North America Market Volume (Tons) Analysis by Product Type, 2020 to 2035
  • Figure 35: North America Market Value Share (%) and BPS Analysis by Product Type, 2025 to 2035
  • Figure 36: North America Market Y-o-Y Growth (%) Projections by Product Type, 2025 to 2035
  • Figure 37: North America Market Value (USD Million) Analysis by Mode of Action, 2020 to 2035
  • Figure 38: North America Market Volume (Tons) Analysis by Mode of Action, 2020 to 2035
  • Figure 39: North America Market Value Share (%) and BPS Analysis by Mode of Action, 2025 to 2035
  • Figure 40: North America Market Y-o-Y Growth (%) Projections by Mode of Action, 2025 to 2035
  • Figure 41: North America Market Value (USD Million) Analysis by Crop Type, 2020 to 2035
  • Figure 42: North America Market Volume (Tons) Analysis by Crop Type, 2020 to 2035
  • Figure 43: North America Market Value Share (%) and BPS Analysis by Crop Type, 2025 to 2035
  • Figure 44: North America Market Y-o-Y Growth (%) Projections by Crop Type, 2025 to 2035
  • Figure 45: North America Market Attractiveness by Product Type, 2025 to 2035
  • Figure 46: North America Market Attractiveness by Mode of Action, 2025 to 2035
  • Figure 47: North America Market Attractiveness by Crop Type, 2025 to 2035
  • Figure 48: North America Market Attractiveness by Country, 2025 to 2035
  • Figure 49: Latin America Market Value (USD Million) by Product Type, 2025 to 2035
  • Figure 50: Latin America Market Value (USD Million) by Mode of Action, 2025 to 2035
  • Figure 51: Latin America Market Value (USD Million) by Crop Type, 2025 to 2035
  • Figure 52: Latin America Market Value (USD Million) by Country, 2025 to 2035
  • Figure 53: Latin America Market Value (USD Million) Analysis by Country, 2020 to 2035
  • Figure 54: Latin America Market Volume (Tons) Analysis by Country, 2020 to 2035
  • Figure 55: Latin America Market Value Share (%) and BPS Analysis by Country, 2025 to 2035
  • Figure 56: Latin America Market Y-o-Y Growth (%) Projections by Country, 2025 to 2035
  • Figure 57: Latin America Market Value (USD Million) Analysis by Product Type, 2020 to 2035
  • Figure 58: Latin America Market Volume (Tons) Analysis by Product Type, 2020 to 2035
  • Figure 59: Latin America Market Value Share (%) and BPS Analysis by Product Type, 2025 to 2035
  • Figure 60: Latin America Market Y-o-Y Growth (%) Projections by Product Type, 2025 to 2035
  • Figure 61: Latin America Market Value (USD Million) Analysis by Mode of Action, 2020 to 2035
  • Figure 62: Latin America Market Volume (Tons) Analysis by Mode of Action, 2020 to 2035
  • Figure 63: Latin America Market Value Share (%) and BPS Analysis by Mode of Action, 2025 to 2035
  • Figure 64: Latin America Market Y-o-Y Growth (%) Projections by Mode of Action, 2025 to 2035
  • Figure 65: Latin America Market Value (USD Million) Analysis by Crop Type, 2020 to 2035
  • Figure 66: Latin America Market Volume (Tons) Analysis by Crop Type, 2020 to 2035
  • Figure 67: Latin America Market Value Share (%) and BPS Analysis by Crop Type, 2025 to 2035
  • Figure 68: Latin America Market Y-o-Y Growth (%) Projections by Crop Type, 2025 to 2035
  • Figure 69: Latin America Market Attractiveness by Product Type, 2025 to 2035
  • Figure 70: Latin America Market Attractiveness by Mode of Action, 2025 to 2035
  • Figure 71: Latin America Market Attractiveness by Crop Type, 2025 to 2035
  • Figure 72: Latin America Market Attractiveness by Country, 2025 to 2035
  • Figure 73: Europe Market Value (USD Million) by Product Type, 2025 to 2035
  • Figure 74: Europe Market Value (USD Million) by Mode of Action, 2025 to 2035
  • Figure 75: Europe Market Value (USD Million) by Crop Type, 2025 to 2035
  • Figure 76: Europe Market Value (USD Million) by Country, 2025 to 2035
  • Figure 77: Europe Market Value (USD Million) Analysis by Country, 2020 to 2035
  • Figure 78: Europe Market Volume (Tons) Analysis by Country, 2020 to 2035
  • Figure 79: Europe Market Value Share (%) and BPS Analysis by Country, 2025 to 2035
  • Figure 80: Europe Market Y-o-Y Growth (%) Projections by Country, 2025 to 2035
  • Figure 81: Europe Market Value (USD Million) Analysis by Product Type, 2020 to 2035
  • Figure 82: Europe Market Volume (Tons) Analysis by Product Type, 2020 to 2035
  • Figure 83: Europe Market Value Share (%) and BPS Analysis by Product Type, 2025 to 2035
  • Figure 84: Europe Market Y-o-Y Growth (%) Projections by Product Type, 2025 to 2035
  • Figure 85: Europe Market Value (USD Million) Analysis by Mode of Action, 2020 to 2035
  • Figure 86: Europe Market Volume (Tons) Analysis by Mode of Action, 2020 to 2035
  • Figure 87: Europe Market Value Share (%) and BPS Analysis by Mode of Action, 2025 to 2035
  • Figure 88: Europe Market Y-o-Y Growth (%) Projections by Mode of Action, 2025 to 2035
  • Figure 89: Europe Market Value (USD Million) Analysis by Crop Type, 2020 to 2035
  • Figure 90: Europe Market Volume (Tons) Analysis by Crop Type, 2020 to 2035
  • Figure 91: Europe Market Value Share (%) and BPS Analysis by Crop Type, 2025 to 2035
  • Figure 92: Europe Market Y-o-Y Growth (%) Projections by Crop Type, 2025 to 2035
  • Figure 93: Europe Market Attractiveness by Product Type, 2025 to 2035
  • Figure 94: Europe Market Attractiveness by Mode of Action, 2025 to 2035
  • Figure 95: Europe Market Attractiveness by Crop Type, 2025 to 2035
  • Figure 96: Europe Market Attractiveness by Country, 2025 to 2035
  • Figure 97: East Asia Market Value (USD Million) by Product Type, 2025 to 2035
  • Figure 98: East Asia Market Value (USD Million) by Mode of Action, 2025 to 2035
  • Figure 99: East Asia Market Value (USD Million) by Crop Type, 2025 to 2035
  • Figure 100: East Asia Market Value (USD Million) by Country, 2025 to 2035
  • Figure 101: East Asia Market Value (USD Million) Analysis by Country, 2020 to 2035
  • Figure 102: East Asia Market Volume (Tons) Analysis by Country, 2020 to 2035
  • Figure 103: East Asia Market Value Share (%) and BPS Analysis by Country, 2025 to 2035
  • Figure 104: East Asia Market Y-o-Y Growth (%) Projections by Country, 2025 to 2035
  • Figure 105: East Asia Market Value (USD Million) Analysis by Product Type, 2020 to 2035
  • Figure 106: East Asia Market Volume (Tons) Analysis by Product Type, 2020 to 2035
  • Figure 107: East Asia Market Value Share (%) and BPS Analysis by Product Type, 2025 to 2035
  • Figure 108: East Asia Market Y-o-Y Growth (%) Projections by Product Type, 2025 to 2035
  • Figure 109: East Asia Market Value (USD Million) Analysis by Mode of Action, 2020 to 2035
  • Figure 110: East Asia Market Volume (Tons) Analysis by Mode of Action, 2020 to 2035
  • Figure 111: East Asia Market Value Share (%) and BPS Analysis by Mode of Action, 2025 to 2035
  • Figure 112: East Asia Market Y-o-Y Growth (%) Projections by Mode of Action, 2025 to 2035
  • Figure 113: East Asia Market Value (USD Million) Analysis by Crop Type, 2020 to 2035
  • Figure 114: East Asia Market Volume (Tons) Analysis by Crop Type, 2020 to 2035
  • Figure 115: East Asia Market Value Share (%) and BPS Analysis by Crop Type, 2025 to 2035
  • Figure 116: East Asia Market Y-o-Y Growth (%) Projections by Crop Type, 2025 to 2035
  • Figure 117: East Asia Market Attractiveness by Product Type, 2025 to 2035
  • Figure 118: East Asia Market Attractiveness by Mode of Action, 2025 to 2035
  • Figure 119: East Asia Market Attractiveness by Crop Type, 2025 to 2035
  • Figure 120: East Asia Market Attractiveness by Country, 2025 to 2035
  • Figure 121: South Asia & Pacific Market Value (USD Million) by Product Type, 2025 to 2035
  • Figure 122: South Asia & Pacific Market Value (USD Million) by Mode of Action, 2025 to 2035
  • Figure 123: South Asia & Pacific Market Value (USD Million) by Crop Type, 2025 to 2035
  • Figure 124: South Asia & Pacific Market Value (USD Million) by Country, 2025 to 2035
  • Figure 125: South Asia & Pacific Market Value (USD Million) Analysis by Country, 2020 to 2035
  • Figure 126: South Asia & Pacific Market Volume (Tons) Analysis by Country, 2020 to 2035
  • Figure 127: South Asia & Pacific Market Value Share (%) and BPS Analysis by Country, 2025 to 2035
  • Figure 128: South Asia & Pacific Market Y-o-Y Growth (%) Projections by Country, 2025 to 2035
  • Figure 129: South Asia & Pacific Market Value (USD Million) Analysis by Product Type, 2020 to 2035
  • Figure 130: South Asia & Pacific Market Volume (Tons) Analysis by Product Type, 2020 to 2035
  • Figure 131: South Asia & Pacific Market Value Share (%) and BPS Analysis by Product Type, 2025 to 2035
  • Figure 132: South Asia & Pacific Market Y-o-Y Growth (%) Projections by Product Type, 2025 to 2035
  • Figure 133: South Asia & Pacific Market Value (USD Million) Analysis by Mode of Action, 2020 to 2035
  • Figure 134: South Asia & Pacific Market Volume (Tons) Analysis by Mode of Action, 2020 to 2035
  • Figure 135: South Asia & Pacific Market Value Share (%) and BPS Analysis by Mode of Action, 2025 to 2035
  • Figure 136: South Asia & Pacific Market Y-o-Y Growth (%) Projections by Mode of Action, 2025 to 2035
  • Figure 137: South Asia & Pacific Market Value (USD Million) Analysis by Crop Type, 2020 to 2035
  • Figure 138: South Asia & Pacific Market Volume (Tons) Analysis by Crop Type, 2020 to 2035
  • Figure 139: South Asia & Pacific Market Value Share (%) and BPS Analysis by Crop Type, 2025 to 2035
  • Figure 140: South Asia & Pacific Market Y-o-Y Growth (%) Projections by Crop Type, 2025 to 2035
  • Figure 141: South Asia & Pacific Market Attractiveness by Product Type, 2025 to 2035
  • Figure 142: South Asia & Pacific Market Attractiveness by Mode of Action, 2025 to 2035
  • Figure 143: South Asia & Pacific Market Attractiveness by Crop Type, 2025 to 2035
  • Figure 144: South Asia & Pacific Market Attractiveness by Country, 2025 to 2035
  • Figure 145: MEA Market Value (USD Million) by Product Type, 2025 to 2035
  • Figure 146: MEA Market Value (USD Million) by Mode of Action, 2025 to 2035
  • Figure 147: MEA Market Value (USD Million) by Crop Type, 2025 to 2035
  • Figure 148: MEA Market Value (USD Million) by Country, 2025 to 2035
  • Figure 149: MEA Market Value (USD Million) Analysis by Country, 2020 to 2035
  • Figure 150: MEA Market Volume (Tons) Analysis by Country, 2020 to 2035
  • Figure 151: MEA Market Value Share (%) and BPS Analysis by Country, 2025 to 2035
  • Figure 152: MEA Market Y-o-Y Growth (%) Projections by Country, 2025 to 2035
  • Figure 153: MEA Market Value (USD Million) Analysis by Product Type, 2020 to 2035
  • Figure 154: MEA Market Volume (Tons) Analysis by Product Type, 2020 to 2035
  • Figure 155: MEA Market Value Share (%) and BPS Analysis by Product Type, 2025 to 2035
  • Figure 156: MEA Market Y-o-Y Growth (%) Projections by Product Type, 2025 to 2035
  • Figure 157: MEA Market Value (USD Million) Analysis by Mode of Action, 2020 to 2035
  • Figure 158: MEA Market Volume (Tons) Analysis by Mode of Action, 2020 to 2035
  • Figure 159: MEA Market Value Share (%) and BPS Analysis by Mode of Action, 2025 to 2035
  • Figure 160: MEA Market Y-o-Y Growth (%) Projections by Mode of Action, 2025 to 2035
  • Figure 161: MEA Market Value (USD Million) Analysis by Crop Type, 2020 to 2035
  • Figure 162: MEA Market Volume (Tons) Analysis by Crop Type, 2020 to 2035
  • Figure 163: MEA Market Value Share (%) and BPS Analysis by Crop Type, 2025 to 2035
  • Figure 164: MEA Market Y-o-Y Growth (%) Projections by Crop Type, 2025 to 2035
  • Figure 165: MEA Market Attractiveness by Product Type, 2025 to 2035
  • Figure 166: MEA Market Attractiveness by Mode of Action, 2025 to 2035
  • Figure 167: MEA Market Attractiveness by Crop Type, 2025 to 2035
  • Figure 168: MEA Market Attractiveness by Country, 2025 to 2035

Frequently Asked Questions

What was the overall size of the herbicides market in 2025?

The overall market size for herbicides market was USD 38,539.4 million in 2025.

How big the herbicides market is expected in 2035?

The herbicides market expected to reach USD 67,727.1 million in 2035.

What will drive the demand for herbicides market during the forecast period?

Rising global food demand, increasing adoption of modern farming techniques, expanding agricultural land, and growing concerns over weed management will drive the herbicides market during the forecast period.

List the top 5 countries contributing herbicides market?

The top 5 countries which drives the development of herbicides market are USA, UK, Europe Union, Japan and South Korea.

Which segment in type is expected to herbicides market?

Cereals & grains segment driving market growth to command significant share over the assessment period.

Explore Fertilizer & Agrochemicals Insights

Future Market Insights

Herbicides Market