The global ortho-xylene market will keep on expanding incrementally during 2025 to 2035 due to mounting demand from plasticizer, agrochemical, and building material markets. Ortho-xylene is an aromatic hydrocarbon that is derived from petroleum, the major share of whose applications as a feedstock for phthalic anhydride further get utilized in the manufacture of PVC resins, dyes, and polyester resins.
Due to better infrastructure and plastic manufacture in key regions, the demand for ortho-xylene grows. The global market for ortho-xylene is USD 4,312 million in 2025 and will be USD 6,667 million in 2035 at a CAGR of 4.5%.
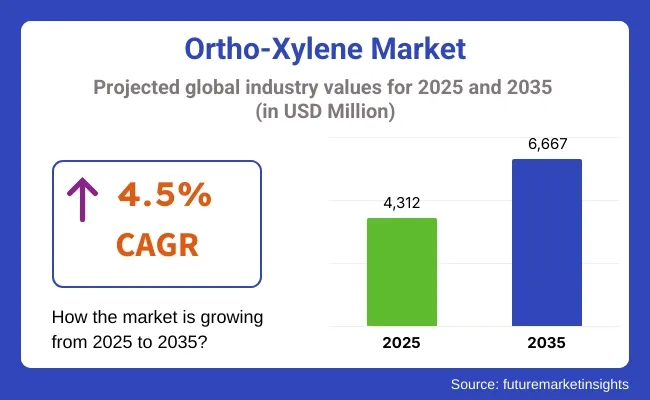
| Metric | Value |
|---|---|
| Market Size in 2025 | USD 4,312 million |
| Projected Market Size in 2035 | USD 6,667 million |
| CAGR (2025 to 2035) | 4.5% |
The industry is sustained by rising phthalate plasticizers demand, downstream market innovation like alkyd resins, and safe supply of feedstock from the worldwide petrochemical network. Chemical resistance and the economy of ortho-xylene still keep it in the middle in most end-use applications.
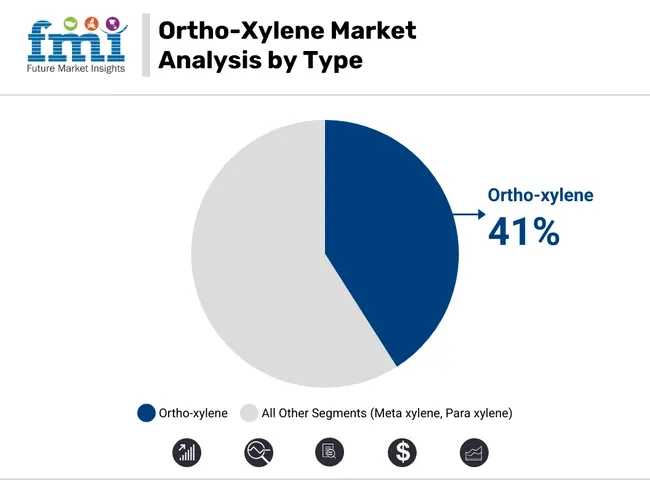
| Type | Market Share (2025) |
|---|---|
| Ortho-xylene | 41% |
Ortho-xylene will capture nearly 41% of the isomer market share in 2025 due to its strategic role as an intermediate to produce phthalic anhydride, a key intermediate to produce plasticizers, resins, and dyes. Drivers for ortho-xylene demand are growing applications of products in the automotive, construction, and consumer industries.
Mass producers such as Reliance Industries and ExxonMobil are also involved in the production of ortho-xylene, thus fulfilling the sharp demand around the world, particularly in industrially developed nations. Its widespread use across applications guarantees a dominant position in the market, in addition to growing industrial output in developing nations. As phthalic anhydride will continue to be a requirement across industries, ortho-xylene will continue to maintain the market share in the future.
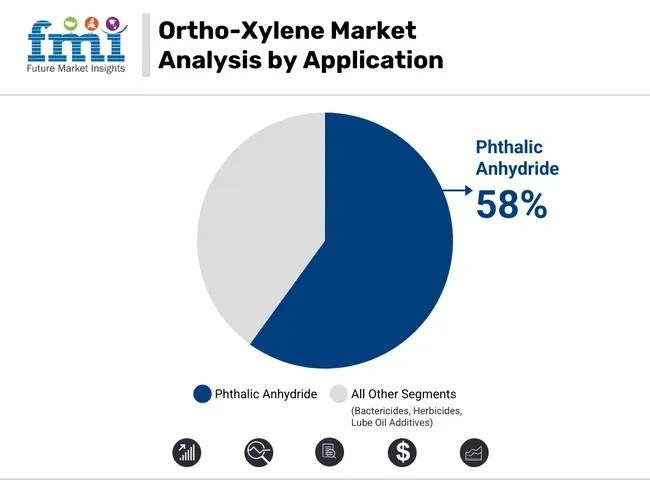
| Application | Market Share (2025) |
|---|---|
| Phthalic Anhydride | 58% |
Production of phthalic anhydride continues to be the biggest use of ortho-xylene at record-high 58% in 2025. The biggest use of phthalic anhydride is production of alkyd resins, which are big paint and coating binders. The resins provide strength, corrosion resistance, and pleasing appearances and thus continue to be a major application in engineering and construction, automobile manufacturing, and others.
Asia has an expanding high-performance coatings industry, with China and India paving the way with high growth in infrastructure, along with increasing automobile production. Phthalic anhydride and thus ortho-xylene is used here as they require quality as well as storage life on such immense levels. Developing economies use ortho-xylene for the reason of utilizing phthalic anhydride.
Challenges: Environmental challenges, availability of feedstock and price volatility, regulatory issues
Crude oil prices also affect the ortho-xylene market, and the ortho-xylene price is directly correlated to the supply of xylene. Additionally, increased awareness of the environmental impact of phthalates and VOCs is driving demand for tighter regulations, particularly in Europe and North America.
Opportunities: Bio-Based Alternatives, Downstream Innovation and Growth Markets
So, there are opportunities for bio-based ortho-xylene and then phthalic anhydride derivatives that meet regulatory requirements but has a performance opportunity. Shrinking supply of plastics and building chemicals in the US, coupled with growing demand in Africa, Southeast Asia, and Latin America creates new opportunities for suppliers and producers.
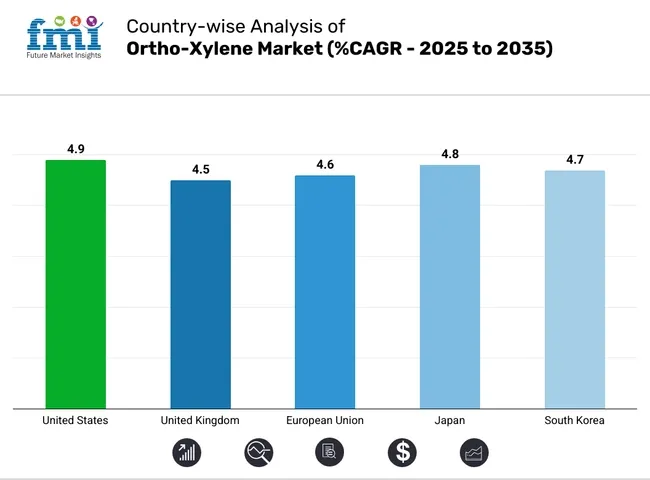
The USA ortho-xylene market remains robust due to high phthalic anhydride demand from the automotive wire coating and flexible packaging sectors. Major chemical hubs in Texas and Louisiana have expanded xylene recovery units with upgraded emission control systems, enhancing domestic availability amid global supply disruptions.
| Country | CAGR (2025 to 2035) |
|---|---|
| USA | 4.9% |
In the UK, demand for ortho-xylene is stabilizing due to eco-focused restrictions on conventional plasticizers. However, value-added applications in high-end coatings and flame-retardant polymers for electronics continue to drive specialized consumption. Facilities are investing in emission abatement and chemical recycling technologies to meet environmental mandates.
| Country | CAGR (2025 to 2035) |
|---|---|
| UK | 4.5% |
The EU market is under pressure from environmental regulations but still maintains strong demand in engineered resins and sustainable insulation materials. Countries like Germany, Italy, and Poland are developing hybrid xylene processing models that combine traditional methods with renewable aromatics to meet industrial needs sustainably.
| Region | CAGR (2025 to 2035) |
|---|---|
| European Union (EU) | 4.6% |
Japan’s specialty chemicals sector continues to use ortho-xylene in niche performance coatings and advanced polyester composites. The shift toward solvent-free manufacturing in Japan is being balanced with investments in purification and reprocessing units for xylene streams to lower carbon emissions in production.
| Country | CAGR (2025 to 2035) |
|---|---|
| Japan | 4.8% |
South Korea is leveraging its strong petrochemical base to support ortho-xylene use in performance plastics and film applications. With increasing integration in EV battery thermal insulation and next-gen packaging films, the market is diversifying beyond construction. Regional producers are optimizing xylene yields using digital twin modelling.
| Country | CAGR (2025 to 2035) |
|---|---|
| South Korea | 4.7% |
Ortho-Xylene market is witnessing continuous growth and is mainly used to supplement phthalic anhydride that serves large scale manufacturing of plasticizers, alkyd resins, and polyester resins. The rising demand from industries like construction, automotive, and electronics also drives market growth.
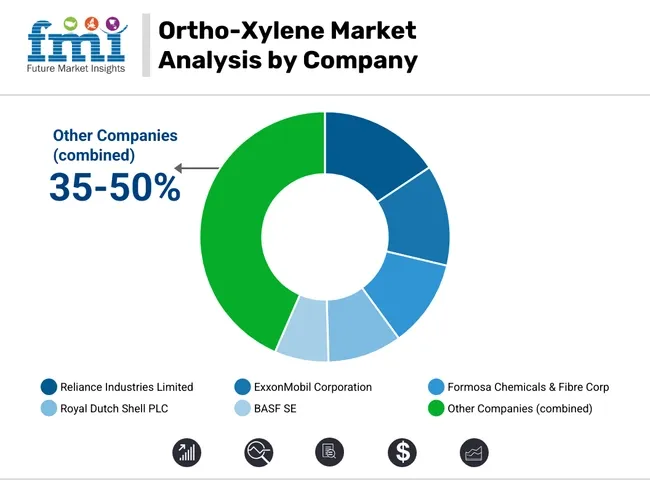
Reliance Industries Limited (15-18%)
Reliance is a market leader having high production capacities and a strong distribution network catering to domestic and international markets. Its continued investments in tech and boosting of capacity demonstrate its response to surging demand.
ExxonMobil Corporation (12-15%)
Supported by its large refining backbone and technological solutions, ExxonMobil is known for the production of high-purity ortho-xylene. The increasing emphasis on sustainability along with strategic partnerships added more value to their market share.
Formosa Chemicals & Fibre Corp (10-13%)
We also note particularly the differentiation based on product purity and diversification of Formosa, which has invested in bio-based alternatives. These initiatives represent their responsiveness to changing market and environmental dynamics.
Royal Dutch Shell PLC (8-11%)
Digital Technologies and Environmental Considerations in Shell Operations They have the heads-up on sustainability, in part, thanks to a collaborative effort with research institutions.
BASF SE (5-8%)
The incorporation of circular economy concepts, along with the production of specialized products (such as high-performance plasticizers), illustrate BASF's commitment to innovation and sustainability, tailored to meet industry-specific needs.
Other Key Players (35-50% Combined)
The ortho-xylene market was valued at approximately USD 4,312 million in 2025.
The market is projected to reach around USD 6,667 million by 2035.
The increasing demand for phthalic anhydride, used in producing plasticizers and resins, is a significant driver. Additionally, growth in the construction and automotive sectors boosts the need for ortho-xylene derivatives.
The leading countries in the ortho-xylene market include China, India, the United States, Germany, and Japan.
The phthalic anhydride application segment dominates the market, driven by its extensive use in manufacturing plasticizers, alkyd resins, and unsaturated polyester resins.
Table 1: Global Market Value (US$ Million) Forecast by Region, 2017 to 2032
Table 2: Global Market Volume (Tons) Forecast by Region, 2017 to 2032
Table 3: Global Market Value (US$ Million) Forecast by Grade, 2017 to 2032
Table 4: Global Market Volume (Tons) Forecast by Grade, 2017 to 2032
Table 5: Global Market Value (US$ Million) Forecast by Application, 2017 to 2032
Table 6: Global Market Volume (Tons) Forecast by Application, 2017 to 2032
Table 7: North America Market Value (US$ Million) Forecast by Country, 2017 to 2032
Table 8: North America Market Volume (Tons) Forecast by Country, 2017 to 2032
Table 9: North America Market Value (US$ Million) Forecast by Grade, 2017 to 2032
Table 10: North America Market Volume (Tons) Forecast by Grade, 2017 to 2032
Table 11: North America Market Value (US$ Million) Forecast by Application, 2017 to 2032
Table 12: North America Market Volume (Tons) Forecast by Application, 2017 to 2032
Table 13: Latin America Market Value (US$ Million) Forecast by Country, 2017 to 2032
Table 14: Latin America Market Volume (Tons) Forecast by Country, 2017 to 2032
Table 15: Latin America Market Value (US$ Million) Forecast by Grade, 2017 to 2032
Table 16: Latin America Market Volume (Tons) Forecast by Grade, 2017 to 2032
Table 17: Latin America Market Value (US$ Million) Forecast by Application, 2017 to 2032
Table 18: Latin America Market Volume (Tons) Forecast by Application, 2017 to 2032
Table 19: Europe Market Value (US$ Million) Forecast by Country, 2017 to 2032
Table 20: Europe Market Volume (Tons) Forecast by Country, 2017 to 2032
Table 21: Europe Market Value (US$ Million) Forecast by Grade, 2017 to 2032
Table 22: Europe Market Volume (Tons) Forecast by Grade, 2017 to 2032
Table 23: Europe Market Value (US$ Million) Forecast by Application, 2017 to 2032
Table 24: Europe Market Volume (Tons) Forecast by Application, 2017 to 2032
Table 25: East Asia Market Value (US$ Million) Forecast by Country, 2017 to 2032
Table 26: East Asia Market Volume (Tons) Forecast by Country, 2017 to 2032
Table 27: East Asia Market Value (US$ Million) Forecast by Grade, 2017 to 2032
Table 28: East Asia Market Volume (Tons) Forecast by Grade, 2017 to 2032
Table 29: East Asia Market Value (US$ Million) Forecast by Application, 2017 to 2032
Table 30: East Asia Market Volume (Tons) Forecast by Application, 2017 to 2032
Table 31: South Asia & Pacific Market Value (US$ Million) Forecast by Country, 2017 to 2032
Table 32: South Asia & Pacific Market Volume (Tons) Forecast by Country, 2017 to 2032
Table 33: South Asia & Pacific Market Value (US$ Million) Forecast by Grade, 2017 to 2032
Table 34: South Asia & Pacific Market Volume (Tons) Forecast by Grade, 2017 to 2032
Table 35: South Asia & Pacific Market Value (US$ Million) Forecast by Application, 2017 to 2032
Table 36: South Asia & Pacific Market Volume (Tons) Forecast by Application, 2017 to 2032
Table 37: MEA Market Value (US$ Million) Forecast by Country, 2017 to 2032
Table 38: MEA Market Volume (Tons) Forecast by Country, 2017 to 2032
Table 39: MEA Market Value (US$ Million) Forecast by Grade, 2017 to 2032
Table 40: MEA Market Volume (Tons) Forecast by Grade, 2017 to 2032
Table 41: MEA Market Value (US$ Million) Forecast by Application, 2017 to 2032
Table 42: MEA Market Volume (Tons) Forecast by Application, 2017 to 2032
Figure 1: Global Market Value (US$ Million) by Grade, 2022 to 2032
Figure 2: Global Market Value (US$ Million) by Application, 2022 to 2032
Figure 3: Global Market Value (US$ Million) by Region, 2022 to 2032
Figure 4: Global Market Value (US$ Million) Analysis by Region, 2017 to 2032
Figure 5: Global Market Volume (Tons) Analysis by Region, 2017 to 2032
Figure 6: Global Market Value Share (%) and BPS Analysis by Region, 2022 to 2032
Figure 7: Global Market Y-o-Y Growth (%) Projections by Region, 2022 to 2032
Figure 8: Global Market Value (US$ Million) Analysis by Grade, 2017 to 2032
Figure 9: Global Market Volume (Tons) Analysis by Grade, 2017 to 2032
Figure 10: Global Market Value Share (%) and BPS Analysis by Grade, 2022 to 2032
Figure 11: Global Market Y-o-Y Growth (%) Projections by Grade, 2022 to 2032
Figure 12: Global Market Value (US$ Million) Analysis by Application, 2017 to 2032
Figure 13: Global Market Volume (Tons) Analysis by Application, 2017 to 2032
Figure 14: Global Market Value Share (%) and BPS Analysis by Application, 2022 to 2032
Figure 15: Global Market Y-o-Y Growth (%) Projections by Application, 2022 to 2032
Figure 16: Global Market Attractiveness by Grade, 2022 to 2032
Figure 17: Global Market Attractiveness by Application, 2022 to 2032
Figure 18: Global Market Attractiveness by Region, 2022 to 2032
Figure 19: North America Market Value (US$ Million) by Grade, 2022 to 2032
Figure 20: North America Market Value (US$ Million) by Application, 2022 to 2032
Figure 21: North America Market Value (US$ Million) by Country, 2022 to 2032
Figure 22: North America Market Value (US$ Million) Analysis by Country, 2017 to 2032
Figure 23: North America Market Volume (Tons) Analysis by Country, 2017 to 2032
Figure 24: North America Market Value Share (%) and BPS Analysis by Country, 2022 to 2032
Figure 25: North America Market Y-o-Y Growth (%) Projections by Country, 2022 to 2032
Figure 26: North America Market Value (US$ Million) Analysis by Grade, 2017 to 2032
Figure 27: North America Market Volume (Tons) Analysis by Grade, 2017 to 2032
Figure 28: North America Market Value Share (%) and BPS Analysis by Grade, 2022 to 2032
Figure 29: North America Market Y-o-Y Growth (%) Projections by Grade, 2022 to 2032
Figure 30: North America Market Value (US$ Million) Analysis by Application, 2017 to 2032
Figure 31: North America Market Volume (Tons) Analysis by Application, 2017 to 2032
Figure 32: North America Market Value Share (%) and BPS Analysis by Application, 2022 to 2032
Figure 33: North America Market Y-o-Y Growth (%) Projections by Application, 2022 to 2032
Figure 34: North America Market Attractiveness by Grade, 2022 to 2032
Figure 35: North America Market Attractiveness by Application, 2022 to 2032
Figure 36: North America Market Attractiveness by Country, 2022 to 2032
Figure 37: Latin America Market Value (US$ Million) by Grade, 2022 to 2032
Figure 38: Latin America Market Value (US$ Million) by Application, 2022 to 2032
Figure 39: Latin America Market Value (US$ Million) by Country, 2022 to 2032
Figure 40: Latin America Market Value (US$ Million) Analysis by Country, 2017 to 2032
Figure 41: Latin America Market Volume (Tons) Analysis by Country, 2017 to 2032
Figure 42: Latin America Market Value Share (%) and BPS Analysis by Country, 2022 to 2032
Figure 43: Latin America Market Y-o-Y Growth (%) Projections by Country, 2022 to 2032
Figure 44: Latin America Market Value (US$ Million) Analysis by Grade, 2017 to 2032
Figure 45: Latin America Market Volume (Tons) Analysis by Grade, 2017 to 2032
Figure 46: Latin America Market Value Share (%) and BPS Analysis by Grade, 2022 to 2032
Figure 47: Latin America Market Y-o-Y Growth (%) Projections by Grade, 2022 to 2032
Figure 48: Latin America Market Value (US$ Million) Analysis by Application, 2017 to 2032
Figure 49: Latin America Market Volume (Tons) Analysis by Application, 2017 to 2032
Figure 50: Latin America Market Value Share (%) and BPS Analysis by Application, 2022 to 2032
Figure 51: Latin America Market Y-o-Y Growth (%) Projections by Application, 2022 to 2032
Figure 52: Latin America Market Attractiveness by Grade, 2022 to 2032
Figure 53: Latin America Market Attractiveness by Application, 2022 to 2032
Figure 54: Latin America Market Attractiveness by Country, 2022 to 2032
Figure 55: Europe Market Value (US$ Million) by Grade, 2022 to 2032
Figure 56: Europe Market Value (US$ Million) by Application, 2022 to 2032
Figure 57: Europe Market Value (US$ Million) by Country, 2022 to 2032
Figure 58: Europe Market Value (US$ Million) Analysis by Country, 2017 to 2032
Figure 59: Europe Market Volume (Tons) Analysis by Country, 2017 to 2032
Figure 60: Europe Market Value Share (%) and BPS Analysis by Country, 2022 to 2032
Figure 61: Europe Market Y-o-Y Growth (%) Projections by Country, 2022 to 2032
Figure 62: Europe Market Value (US$ Million) Analysis by Grade, 2017 to 2032
Figure 63: Europe Market Volume (Tons) Analysis by Grade, 2017 to 2032
Figure 64: Europe Market Value Share (%) and BPS Analysis by Grade, 2022 to 2032
Figure 65: Europe Market Y-o-Y Growth (%) Projections by Grade, 2022 to 2032
Figure 66: Europe Market Value (US$ Million) Analysis by Application, 2017 to 2032
Figure 67: Europe Market Volume (Tons) Analysis by Application, 2017 to 2032
Figure 68: Europe Market Value Share (%) and BPS Analysis by Application, 2022 to 2032
Figure 69: Europe Market Y-o-Y Growth (%) Projections by Application, 2022 to 2032
Figure 70: Europe Market Attractiveness by Grade, 2022 to 2032
Figure 71: Europe Market Attractiveness by Application, 2022 to 2032
Figure 72: Europe Market Attractiveness by Country, 2022 to 2032
Figure 73: East Asia Market Value (US$ Million) by Grade, 2022 to 2032
Figure 74: East Asia Market Value (US$ Million) by Application, 2022 to 2032
Figure 75: East Asia Market Value (US$ Million) by Country, 2022 to 2032
Figure 76: East Asia Market Value (US$ Million) Analysis by Country, 2017 to 2032
Figure 77: East Asia Market Volume (Tons) Analysis by Country, 2017 to 2032
Figure 78: East Asia Market Value Share (%) and BPS Analysis by Country, 2022 to 2032
Figure 79: East Asia Market Y-o-Y Growth (%) Projections by Country, 2022 to 2032
Figure 80: East Asia Market Value (US$ Million) Analysis by Grade, 2017 to 2032
Figure 81: East Asia Market Volume (Tons) Analysis by Grade, 2017 to 2032
Figure 82: East Asia Market Value Share (%) and BPS Analysis by Grade, 2022 to 2032
Figure 83: East Asia Market Y-o-Y Growth (%) Projections by Grade, 2022 to 2032
Figure 84: East Asia Market Value (US$ Million) Analysis by Application, 2017 to 2032
Figure 85: East Asia Market Volume (Tons) Analysis by Application, 2017 to 2032
Figure 86: East Asia Market Value Share (%) and BPS Analysis by Application, 2022 to 2032
Figure 87: East Asia Market Y-o-Y Growth (%) Projections by Application, 2022 to 2032
Figure 88: East Asia Market Attractiveness by Grade, 2022 to 2032
Figure 89: East Asia Market Attractiveness by Application, 2022 to 2032
Figure 90: East Asia Market Attractiveness by Country, 2022 to 2032
Figure 91: South Asia & Pacific Market Value (US$ Million) by Grade, 2022 to 2032
Figure 92: South Asia & Pacific Market Value (US$ Million) by Application, 2022 to 2032
Figure 93: South Asia & Pacific Market Value (US$ Million) by Country, 2022 to 2032
Figure 94: South Asia & Pacific Market Value (US$ Million) Analysis by Country, 2017 to 2032
Figure 95: South Asia & Pacific Market Volume (Tons) Analysis by Country, 2017 to 2032
Figure 96: South Asia & Pacific Market Value Share (%) and BPS Analysis by Country, 2022 to 2032
Figure 97: South Asia & Pacific Market Y-o-Y Growth (%) Projections by Country, 2022 to 2032
Figure 98: South Asia & Pacific Market Value (US$ Million) Analysis by Grade, 2017 to 2032
Figure 99: South Asia & Pacific Market Volume (Tons) Analysis by Grade, 2017 to 2032
Figure 100: South Asia & Pacific Market Value Share (%) and BPS Analysis by Grade, 2022 to 2032
Figure 101: South Asia & Pacific Market Y-o-Y Growth (%) Projections by Grade, 2022 to 2032
Figure 102: South Asia & Pacific Market Value (US$ Million) Analysis by Application, 2017 to 2032
Figure 103: South Asia & Pacific Market Volume (Tons) Analysis by Application, 2017 to 2032
Figure 104: South Asia & Pacific Market Value Share (%) and BPS Analysis by Application, 2022 to 2032
Figure 105: South Asia & Pacific Market Y-o-Y Growth (%) Projections by Application, 2022 to 2032
Figure 106: South Asia & Pacific Market Attractiveness by Grade, 2022 to 2032
Figure 107: South Asia & Pacific Market Attractiveness by Application, 2022 to 2032
Figure 108: South Asia & Pacific Market Attractiveness by Country, 2022 to 2032
Figure 109: MEA Market Value (US$ Million) by Grade, 2022 to 2032
Figure 110: MEA Market Value (US$ Million) by Application, 2022 to 2032
Figure 111: MEA Market Value (US$ Million) by Country, 2022 to 2032
Figure 112: MEA Market Value (US$ Million) Analysis by Country, 2017 to 2032
Figure 113: MEA Market Volume (Tons) Analysis by Country, 2017 to 2032
Figure 114: MEA Market Value Share (%) and BPS Analysis by Country, 2022 to 2032
Figure 115: MEA Market Y-o-Y Growth (%) Projections by Country, 2022 to 2032
Figure 116: MEA Market Value (US$ Million) Analysis by Grade, 2017 to 2032
Figure 117: MEA Market Volume (Tons) Analysis by Grade, 2017 to 2032
Figure 118: MEA Market Value Share (%) and BPS Analysis by Grade, 2022 to 2032
Figure 119: MEA Market Y-o-Y Growth (%) Projections by Grade, 2022 to 2032
Figure 120: MEA Market Value (US$ Million) Analysis by Application, 2017 to 2032
Figure 121: MEA Market Volume (Tons) Analysis by Application, 2017 to 2032
Figure 122: MEA Market Value Share (%) and BPS Analysis by Application, 2022 to 2032
Figure 123: MEA Market Y-o-Y Growth (%) Projections by Application, 2022 to 2032
Figure 124: MEA Market Attractiveness by Grade, 2022 to 2032
Figure 125: MEA Market Attractiveness by Application, 2022 to 2032
Figure 126: MEA Market Attractiveness by Country, 2022 to 2032


Full Research Suite comprises of:
Market outlook & trends analysis
Interviews & case studies
Strategic recommendations
Vendor profiles & capabilities analysis
5-year forecasts
8 regions and 60+ country-level data splits
Market segment data splits
12 months of continuous data updates
DELIVERED AS:
PDF EXCEL ONLINE

Thank you!
You will receive an email from our Business Development Manager. Please be sure to check your SPAM/JUNK folder too.
Chat With
MaRIA