Reports

- Global Locations -

Headquarters

Future Market Insights, Inc.

Christiana Corporate, 200
Continental Drive, Suite 401,
Newark, Delaware - 19713,
United States

T: +1-845-579-5705

Americas

Future Market Insights, Inc.

616 Corporate Way, Suite 2-9018,
Valley Cottage, NY 10989, United States

T: +1-347-918-3531

MEA

Future Market Insights

1602-6 Jumeirah Bay X2 Tower, Plot No: JLT-PH2-X2A,
Jumeirah Lakes Towers, Dubai,
United Arab Emirates

Europe

Future Market Insights

3rd Floor, 207 Regent Street,
W1B 3HH London
United Kingdom

T: + 44 (0) 20 8123 9659
D: +44 (0) 20 3287 4268

Asia Pacific

Future Market Insights

IndiaLand Global Tech Park, Unit UG-1, Behind Grand HighStreet, Phase 1, Hinjawadi, MH, Pune – 411057, India

Glucuronolactone Market Outlook

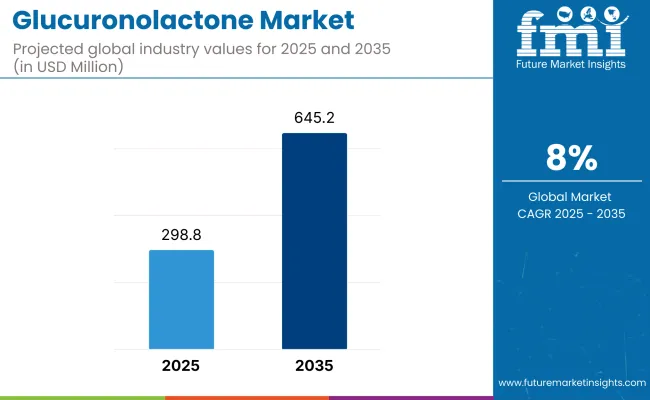
The glucuronolactone market size is projected to be valued at US$ 120 million in 2023 and is expected to rise to US$ 256.2 million by 2033. The sales of glucuronolactone are expected to thrive at a significant CAGR of 8.0% during the forecast period.

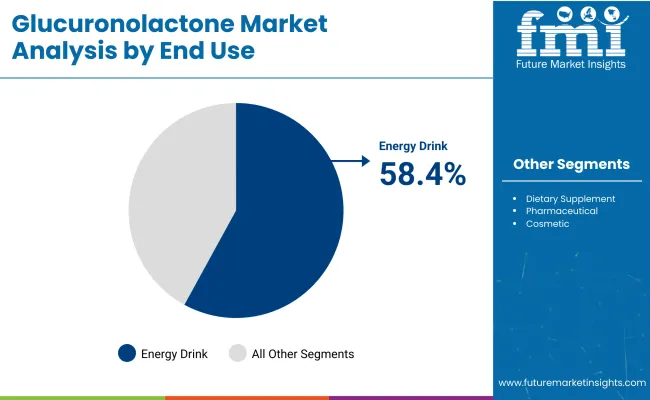
Glucuronolactone is used as a food additive in food and functional beverages. In terms of purity, 0.99% grade of glucuronolactone is highly preferable among manufacturers. Also, increasing consumption of energy drinks is one of the key factors fueling the demand for Glucuronolactone in the market.

Glucuronolactone is an odorless, white solid substance found in people, animals, and the gums of plants. It is a vital component of all linked tissues. It is a chemical created by the human liver's glucose metabolism. Glucuronolactone is a component of connective tissues as well as an important antioxidant in the production of ascorbic acid.

Given its numerous health benefits, the increasing adoption of glucuronolactone from various end-use industries such as pharmaceuticals and food and beverages is a significant factor contributing to the growth glucuronolactone market. Some factors expected to drive the glucuronolactone market further during the forecast period include:

  • Increased use of glucuronolactone as an ingredient in functional foods and energy drinks to act as a potent antioxidant.
  • Eliminate harmful chemicals through waste from the body, fueled by increased consumer health awareness.
Attributes Details
Glucuronolactone Market Estimated Size (2023) US$ 120 million
Glucuronolactone Market CAGR (2023 to 2033) 8.0%
Glucuronolactone Market Forecasted Size (2033) US$ 256.2 million

Don't pay for what you don't need

Customize your report by selecting specific countries or regions and save 30%!

Glucuronolactone Market Historic and Future Outlook Comparison

Glucuronolactone sales expanded at a CAGR of 5.4% between 2018 and 2022. The period marked the entry of various market players and product innovations.

In pharmaceuticals, glucuronolactone is frequently used as a component in the production of a range of treatment options for food and drug poisoning, hepatitis, and immune response modulation. Further, a rise in demand from bodybuilders and athletes is also expected to contribute to market expansion.

High glucuronolactone prices, as well as various negative impacts related to excessive glucuronolactone intakes, such as dizziness, disorientation, and fast heartbeat, are anticipated to hamper the market growth during the forecast period.

Glucuronolactone-based Dietary Supplements are Becoming Popular

The human brain, liver, and heart contain glucuronolactone, which is involved in a range of physiological functions. Some of its metabolic roles include osmoregulation, membrane stability, and bile acid conjugation. Further, cardiovascular disease, retinal degeneration, and epilepsy are all diseases that can be caused by glucuronolactone shortage.

Glucuronolactone supplementation has been demonstrated to be beneficial to one's health. This indeed is increasing the demand for dietary supplements around the world as people grow concerned about their health. Furthermore, this has increased demand for glucuronolactone containing supplements, resulting in market expansion.

The rise in demand from the pharmaceutical and food & beverage industries, as well as increased awareness about a healthy lifestyle, are two key factors driving the glucuronolactone market.

Nandini Roy Choudhury

Principal Consultant

Talk to Analyst

Find your sweet spots for generating winning opportunities in this market.

Comparative View of the Adjacent Glucuronolactone Market

Glucuronolactone Market:

Attributes Glucuronolactone Market
CAGR (2023 to 2033) 8.0%
Market Value (2033) US$ 256.2 million
Growth Factor The increasing adoption of glucuronolactone from various end-use industries such as pharmaceuticals and food and beverages is a significant factor contributing to the growth of the glucuronolactone market.
Opportunity Glucuronolactone supplementation has been demonstrated to be beneficial to one's health. This indeed is increasing the demand for dietary supplements around the world as people grow concerned about their health.

Bakery Ingredients Market:

Attributes Bakery Ingredients Market
CAGR (2023 to 2033) 6.4%
Market Value (2033) US$ 22.94 billion
Growth Factor Sales of baked goods have dramatically expanded along with new experiments, and demand for healthy foods has compelled businesses to use new ingredients. Vendor businesses have increased their market share as a result.
Opportunity Bakeries now offer meals around-the-clock owing to the online food delivery option. Due to this, the market is now both exclusive and open to new techniques, materials, and experimentation.

Food Mixes Market:

Attributes Food Mixes Market
CAGR (2023 to 2033) 5.3%
Market Value (2033) US$ 7.27 billion
Growth Factor The food and beverage industry worldwide is anticipated to contribute to the significant growth rate that the global market for baking mixes will have over the course of the forecast period.
Opportunity the market for bakery mixes is anticipated to grow profitably over the next years, due to rising demand for bakery goods and rising bread consumption.

Category-wise Insights

Glucuronolactone Application in Pharmaceuticals is Accounting for a Prominent Share

The pharmaceutical application is estimated to rise at a signifcant rate, with a CAGR of 7.0% from 2023 to 2033, as a result of the increased application of glucuronolactone-based pills and supplements to treat hepatocirrhosis, arthritis, and hepatitis, Furthermore, the market growth is likely to be fueled by the recovery of the pharmaceutical industry in the United States over the forecast period.

Powder Form of Glucuronolactone is Accounting for a Significant Share

The powder form of glucuronolactone is projected to account for a significant share as consumers are consuming it as a dietary supplement over the projection period. Additionally, a growing health conscious population in the urban area is expected to boost demand growth for powder glucuronolactone.

Get the data you need at a Fraction of the cost

Personalize your report by choosing insights you need
and save 40%!

Regional Analysis of the Glucuronolactone Market

Sales of Glucuronolactone in the United States

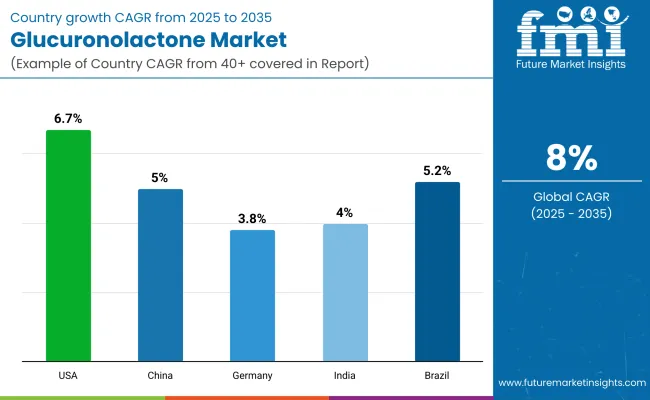
The United States accounted for 25.7% of the total market in 2022 in North America and is expected to rise significantly due to the widespread use of glucuronolactone as a nutritional supplement in the country. Additionally, glucuronolactone-containing drinks have been popular in the country.

Companies like Rockstar Inc., Red Bull, and Monster have released numerous glucuronolactone-containing drinks, which might offer enormous potential throughout the projected period. However, due to restrictions on the use of glucuronolactone in traditional beverages, the majority of these drinks are sold as supplements.

Consumption of Glucuronolactone in the United Kingdom

The use of glucuronolactone in prescription medications for the treatment of collagen disease, hepatitis, and bone illnesses in the United Kingdom, and Europe is predicted to increase at a CAGR of 3.0% from 2023 to 2033. In addition, government backing, together with increased research and development expenditure, is predicted to contribute significantly to market growth.

Rising Demand for Glucuronolactone in China

The high number of glucuronolactone producers in China and the high level of exports are expected to increase at a CAGR of 5.8% from 2023 to 2033. Furthermore, the product's widespread availability in China is projected to benefit the market in the approaching years. Also, the pharmaceutical industry in China, India, Indonesia, Malaysia, the Philippines, Singapore, Thailand, and Vietnam is expanding.

Market Competition

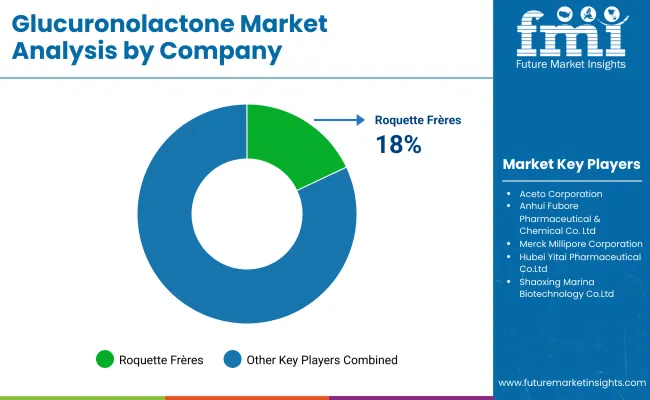
Some of the key players operating in the glucuronolactone market are Shaoxing Marina Biotechnology Co.Ltd., Hubei Yitai Pharmaceutical Co.Ltd., Anhui Fubore Pharmaceutical & Chemical Co.Ltd., Functional Food chem International Corporation, Merck Millipore Corporation, Jungbunzlauer, Shandong Fuyuan Bio-Tech CO.LTD, Roquette Frères, Shandong Xinhong Pharmaceutical Co., Ltd., Shandong Baisheng Biotechnology Co., Ltd., and others.

  • Hubei Yitai Pharmaceutical Co., Ltd provides glucuronolactone, which is commonly used as a food ingredient in health foods and functional beverages. The product control’s immunological function, anti-aging, moistens skin, improves oxygen to the brain, and aids in tiredness recovery.
  • Red Bull Energy Drink is one of the leading end-users, selling its products in over 169 countries and selling roughly 6 billion cans every year. Red Bull's primary markets are the United States and Western Europe.

Scope of the Report

Attributes Details
Growth Rate CAGR of 8.0% from 2023 to 2033
Base Year of Estimation 2022
Historical Data 2018 to 2022
Forecast Period 2023 to 2033
Quantitative Units Revenue in US$ million and Volume in Units and F-CAGR from 2023 to 2033
Report Coverage Revenue Forecast, Volume Forecast, Company Ranking, Competitive Landscape, growth factors, Trends and Pricing Analysis
Key Segments Covered
  • By Form
  • By End User
  • By Region
Regions Covered
  • North America
  • Latin America
  • Europe
  • East Asia
  • South Asia
  • The Middle East & Africa
  • Oceania
Key Countries Profiled
  • The United States
  • Canada
  • Brazil
  • Mexico
  • Germany
  • Italy
  • France
  • The United Kingdom
  • Spain
  • Russia
  • China
  • Japan
  • India
  • GCC Countries
  • Australia
Key Companies Profiled
  • Shaoxing Marina Biotechnology Co.Ltd.
  • Hubei Yitai Pharmaceutical Co.Ltd.
  • Merck Millipore Corporation
  • Anhui Fubore Pharmaceutical & Chemical Co.Ltd.
  • Functional Food chem International Corporation
  • Jungbunzlauer
  • Shandong Fuyuan Bio-Tech CO.LTD.
  • Roquette Frères
  • Shandong Xinhong Pharmaceutical Co., Ltd.
  • Shandong Baisheng Biotechnology Co., Ltd.
  • Ceto Coorporation
  • Creative Compound
  • Foodchem International
  • Merck Millipore
Customization & Pricing Available upon Request

Key Segments Covered in the Glucuronolactone Market Report

By Form:

  • Powder
  • Liquid
  • Tablet & Capsules

By End Use:

  • Dietary Supplement
  • Energy Drinks
  • Pharmaceuticals
  • Cosmetics
  • Functional Food

By Region:

  • North America
  • Latin America
  • Western Europe
  • Eastern Europe
  • Asia Pacific excluding Japan (APEJ)
  • Japan
  • The Middle East & Africa (MEA)

Frequently Asked Questions

What is the Glucuronolactone Market Size in 2023? 

The market is valued at US$ 120.0 million in 2023. 

Who are the Prominent Market Players? 

Jungbunzlauer, and Roquette Frères are the prominent market players. 

What is the Projected Market Size in 2033? 

The market is likely to reach US$ 256.2 million by 2033. 

What Drives the Sales of the Market? 

Rising awareness about a healthy lifestyle drives sales.

How is the historical performance of the Market? 

The market registered a CAGR of 5.4% from 2018 to 2022.

Table of Content

1. Executive Summary

    1.1. Global Market Outlook

    1.2. Demand-side Trends

    1.3. Supply-side Trends

    1.4. Technology Roadmap Analysis

    1.5. Analysis and Recommendations

2. Market Overview

    2.1. Market Coverage / Taxonomy

    2.2. Market Definition / Scope / Limitations

3. Market Background

    3.1. Market Dynamics

        3.1.1. Drivers

        3.1.2. Restraints

        3.1.3. Opportunity

        3.1.4. Trends

    3.2. Scenario Forecast

        3.2.1. Demand in Optimistic Scenario

        3.2.2. Demand in Likely Scenario

        3.2.3. Demand in Conservative Scenario

    3.3. Opportunity Map Analysis

    3.4. Product Life Cycle Analysis

    3.5. Supply Chain Analysis

        3.5.1. Supply Side Participants and their Roles

            3.5.1.1. Producers

            3.5.1.2. Mid-Level Participants (Traders/ Agents/ Brokers)

            3.5.1.3. Wholesalers and Distributors

        3.5.2. Value Added and Value Created at Node in the Supply Chain

        3.5.3. List of Raw Material Suppliers

        3.5.4. List of Existing and Potential Buyer’s

    3.6. Investment Feasibility Matrix

    3.7. Value Chain Analysis

        3.7.1. Profit Margin Analysis

        3.7.2. Wholesalers and Distributors

        3.7.3. Retailers

    3.8. PESTLE and Porter’s Analysis

    3.9. Regulatory Landscape

        3.9.1. By Key Regions

        3.9.2. By Key Countries

    3.10. Regional Parent Market Outlook

    3.11. Production and Consumption Statistics

    3.12. Import and Export Statistics

4. Global Market Analysis 2018 to 2022 and Forecast, 2023 to 2033

    4.1. Historical Market Size Value (US$ Million) & Volume (MT) Analysis, 2018 to 2022

    4.2. Current and Future Market Size Value (US$ Million) & Volume (MT) Projections, 2023 to 2033

        4.2.1. Y-o-Y Growth Trend Analysis

        4.2.2. Absolute $ Opportunity Analysis

5. Global Market Analysis 2018 to 2022 and Forecast 2023 to 2033, By Form

    5.1. Introduction / Key Findings

    5.2. Historical Market Size Value (US$ Million) & Volume (MT) Analysis By Form, 2018 to 2022

    5.3. Current and Future Market Size Value (US$ Million) & Volume (MT) Analysis and Forecast By Form, 2023 to 2033

        5.3.1. Powder

        5.3.2. Liquid

        5.3.3. Tablet & Capsules

    5.4. Y-o-Y Growth Trend Analysis By Form, 2018 to 2022

    5.5. Absolute $ Opportunity Analysis By Form, 2023 to 2033

6. Global Market Analysis 2018 to 2022 and Forecast 2023 to 2033, By End Use

    6.1. Introduction / Key Findings

    6.2. Historical Market Size Value (US$ Million) & Volume (MT) Analysis By End Use, 2018 to 2022

    6.3. Current and Future Market Size Value (US$ Million) & Volume (MT) Analysis and Forecast By End Use, 2023 to 2033

        6.3.1. Dietary Supplement

        6.3.2. Energy Drinks

        6.3.3. Pharmaceuticals

        6.3.4. Cosmetics

        6.3.5. Functional Food

    6.4. Y-o-Y Growth Trend Analysis By End Use, 2018 to 2022

    6.5. Absolute $ Opportunity Analysis By End Use, 2023 to 2033

7. Global Market Analysis 2018 to 2022 and Forecast 2023 to 2033, By Region

    7.1. Introduction

    7.2. Historical Market Size Value (US$ Million) & Volume (MT) Analysis By Region, 2018 to 2022

    7.3. Current Market Size Value (US$ Million) & Volume (MT) Analysis and Forecast By Region, 2023 to 2033

        7.3.1. North America

        7.3.2. Latin America

        7.3.3. Western Europe

        7.3.4. Eastern Europe

        7.3.5. South Asia and Pacific

        7.3.6. East Asia

        7.3.7. Middle East and Africa

    7.4. Market Attractiveness Analysis By Region

8. North America Market Analysis 2018 to 2022 and Forecast 2023 to 2033, By Country

    8.1. Historical Market Size Value (US$ Million) & Volume (MT) Trend Analysis By Market Taxonomy, 2018 to 2022

    8.2. Market Size Value (US$ Million) & Volume (MT) Forecast By Market Taxonomy, 2023 to 2033

        8.2.1. By Country

            8.2.1.1. USA

            8.2.1.2. Canada

        8.2.2. By Form

        8.2.3. By End Use

    8.3. Market Attractiveness Analysis

        8.3.1. By Country

        8.3.2. By Form

        8.3.3. By End Use

    8.4. Key Takeaways

9. Latin America Market Analysis 2018 to 2022 and Forecast 2023 to 2033, By Country

    9.1. Historical Market Size Value (US$ Million) & Volume (MT) Trend Analysis By Market Taxonomy, 2018 to 2022

    9.2. Market Size Value (US$ Million) & Volume (MT) Forecast By Market Taxonomy, 2023 to 2033

        9.2.1. By Country

            9.2.1.1. Brazil

            9.2.1.2. Mexico

            9.2.1.3. Rest of Latin America

        9.2.2. By Form

        9.2.3. By End Use

    9.3. Market Attractiveness Analysis

        9.3.1. By Country

        9.3.2. By Form

        9.3.3. By End Use

    9.4. Key Takeaways

10. Western Europe Market Analysis 2018 to 2022 and Forecast 2023 to 2033, By Country

    10.1. Historical Market Size Value (US$ Million) & Volume (MT) Trend Analysis By Market Taxonomy, 2018 to 2022

    10.2. Market Size Value (US$ Million) & Volume (MT) Forecast By Market Taxonomy, 2023 to 2033

        10.2.1. By Country

            10.2.1.1. Germany

            10.2.1.2. UK

            10.2.1.3. France

            10.2.1.4. Spain

            10.2.1.5. Italy

            10.2.1.6. Rest of Western Europe

        10.2.2. By Form

        10.2.3. By End Use

    10.3. Market Attractiveness Analysis

        10.3.1. By Country

        10.3.2. By Form

        10.3.3. By End Use

    10.4. Key Takeaways

11. Eastern Europe Market Analysis 2018 to 2022 and Forecast 2023 to 2033, By Country

    11.1. Historical Market Size Value (US$ Million) & Volume (MT) Trend Analysis By Market Taxonomy, 2018 to 2022

    11.2. Market Size Value (US$ Million) & Volume (MT) Forecast By Market Taxonomy, 2023 to 2033

        11.2.1. By Country

            11.2.1.1. Poland

            11.2.1.2. Russia

            11.2.1.3. Czech Republic

            11.2.1.4. Romania

            11.2.1.5. Rest of Eastern Europe

        11.2.2. By Form

        11.2.3. By End Use

    11.3. Market Attractiveness Analysis

        11.3.1. By Country

        11.3.2. By Form

        11.3.3. By End Use

    11.4. Key Takeaways

12. South Asia and Pacific Market Analysis 2018 to 2022 and Forecast 2023 to 2033, By Country

    12.1. Historical Market Size Value (US$ Million) & Volume (MT) Trend Analysis By Market Taxonomy, 2018 to 2022

    12.2. Market Size Value (US$ Million) & Volume (MT) Forecast By Market Taxonomy, 2023 to 2033

        12.2.1. By Country

            12.2.1.1. India

            12.2.1.2. Bangladesh

            12.2.1.3. Australia

            12.2.1.4. New Zealand

            12.2.1.5. Rest of South Asia and Pacific

        12.2.2. By Form

        12.2.3. By End Use

    12.3. Market Attractiveness Analysis

        12.3.1. By Country

        12.3.2. By Form

        12.3.3. By End Use

    12.4. Key Takeaways

13. East Asia Market Analysis 2018 to 2022 and Forecast 2023 to 2033, By Country

    13.1. Historical Market Size Value (US$ Million) & Volume (MT) Trend Analysis By Market Taxonomy, 2018 to 2022

    13.2. Market Size Value (US$ Million) & Volume (MT) Forecast By Market Taxonomy, 2023 to 2033

        13.2.1. By Country

            13.2.1.1. China

            13.2.1.2. Japan

            13.2.1.3. South Korea

        13.2.2. By Form

        13.2.3. By End Use

    13.3. Market Attractiveness Analysis

        13.3.1. By Country

        13.3.2. By Form

        13.3.3. By End Use

    13.4. Key Takeaways

14. Middle East and Africa Market Analysis 2018 to 2022 and Forecast 2023 to 2033, By Country

    14.1. Historical Market Size Value (US$ Million) & Volume (MT) Trend Analysis By Market Taxonomy, 2018 to 2022

    14.2. Market Size Value (US$ Million) & Volume (MT) Forecast By Market Taxonomy, 2023 to 2033

        14.2.1. By Country

            14.2.1.1. GCC Countries

            14.2.1.2. South Africa

            14.2.1.3. Israel

            14.2.1.4. Rest of MEA

        14.2.2. By Form

        14.2.3. By End Use

    14.3. Market Attractiveness Analysis

        14.3.1. By Country

        14.3.2. By Form

        14.3.3. By End Use

    14.4. Key Takeaways

15. Key Countries Market Analysis

    15.1. USA

        15.1.1. Pricing Analysis

        15.1.2. Market Share Analysis, 2022

            15.1.2.1. By Form

            15.1.2.2. By End Use

    15.2. Canada

        15.2.1. Pricing Analysis

        15.2.2. Market Share Analysis, 2022

            15.2.2.1. By Form

            15.2.2.2. By End Use

    15.3. Brazil

        15.3.1. Pricing Analysis

        15.3.2. Market Share Analysis, 2022

            15.3.2.1. By Form

            15.3.2.2. By End Use

    15.4. Mexico

        15.4.1. Pricing Analysis

        15.4.2. Market Share Analysis, 2022

            15.4.2.1. By Form

            15.4.2.2. By End Use

    15.5. Germany

        15.5.1. Pricing Analysis

        15.5.2. Market Share Analysis, 2022

            15.5.2.1. By Form

            15.5.2.2. By End Use

    15.6. UK

        15.6.1. Pricing Analysis

        15.6.2. Market Share Analysis, 2022

            15.6.2.1. By Form

            15.6.2.2. By End Use

    15.7. France

        15.7.1. Pricing Analysis

        15.7.2. Market Share Analysis, 2022

            15.7.2.1. By Form

            15.7.2.2. By End Use

    15.8. Spain

        15.8.1. Pricing Analysis

        15.8.2. Market Share Analysis, 2022

            15.8.2.1. By Form

            15.8.2.2. By End Use

    15.9. Italy

        15.9.1. Pricing Analysis

        15.9.2. Market Share Analysis, 2022

            15.9.2.1. By Form

            15.9.2.2. By End Use

    15.10. Poland

        15.10.1. Pricing Analysis

        15.10.2. Market Share Analysis, 2022

            15.10.2.1. By Form

            15.10.2.2. By End Use

    15.11. Russia

        15.11.1. Pricing Analysis

        15.11.2. Market Share Analysis, 2022

            15.11.2.1. By Form

            15.11.2.2. By End Use

    15.12. Czech Republic

        15.12.1. Pricing Analysis

        15.12.2. Market Share Analysis, 2022

            15.12.2.1. By Form

            15.12.2.2. By End Use

    15.13. Romania

        15.13.1. Pricing Analysis

        15.13.2. Market Share Analysis, 2022

            15.13.2.1. By Form

            15.13.2.2. By End Use

    15.14. India

        15.14.1. Pricing Analysis

        15.14.2. Market Share Analysis, 2022

            15.14.2.1. By Form

            15.14.2.2. By End Use

    15.15. Bangladesh

        15.15.1. Pricing Analysis

        15.15.2. Market Share Analysis, 2022

            15.15.2.1. By Form

            15.15.2.2. By End Use

    15.16. Australia

        15.16.1. Pricing Analysis

        15.16.2. Market Share Analysis, 2022

            15.16.2.1. By Form

            15.16.2.2. By End Use

    15.17. New Zealand

        15.17.1. Pricing Analysis

        15.17.2. Market Share Analysis, 2022

            15.17.2.1. By Form

            15.17.2.2. By End Use

    15.18. China

        15.18.1. Pricing Analysis

        15.18.2. Market Share Analysis, 2022

            15.18.2.1. By Form

            15.18.2.2. By End Use

    15.19. Japan

        15.19.1. Pricing Analysis

        15.19.2. Market Share Analysis, 2022

            15.19.2.1. By Form

            15.19.2.2. By End Use

    15.20. South Korea

        15.20.1. Pricing Analysis

        15.20.2. Market Share Analysis, 2022

            15.20.2.1. By Form

            15.20.2.2. By End Use

    15.21. GCC Countries

        15.21.1. Pricing Analysis

        15.21.2. Market Share Analysis, 2022

            15.21.2.1. By Form

            15.21.2.2. By End Use

    15.22. South Africa

        15.22.1. Pricing Analysis

        15.22.2. Market Share Analysis, 2022

            15.22.2.1. By Form

            15.22.2.2. By End Use

    15.23. Israel

        15.23.1. Pricing Analysis

        15.23.2. Market Share Analysis, 2022

            15.23.2.1. By Form

            15.23.2.2. By End Use

16. Market Structure Analysis

    16.1. Competition Dashboard

    16.2. Competition Benchmarking

    16.3. Market Share Analysis of Top Players

        16.3.1. By Regional

        16.3.2. By Form

        16.3.3. By End Use

17. Competition Analysis

    17.1. Competition Deep Dive

        17.1.1. Shaoxing Marina Biotechnology Co.Ltd.

            17.1.1.1. Overview

            17.1.1.2. Product Portfolio

            17.1.1.3. Profitability by Market Segments

            17.1.1.4. Sales Footprint

            17.1.1.5. Strategy Overview

                17.1.1.5.1. Marketing Strategy

                17.1.1.5.2. Product Strategy

                17.1.1.5.3. Channel Strategy

        17.1.2. Hubei Yitai Pharmaceutical Co.Ltd.

            17.1.2.1. Overview

            17.1.2.2. Product Portfolio

            17.1.2.3. Profitability by Market Segments

            17.1.2.4. Sales Footprint

            17.1.2.5. Strategy Overview

                17.1.2.5.1. Marketing Strategy

                17.1.2.5.2. Product Strategy

                17.1.2.5.3. Channel Strategy

        17.1.3. Merck Millipore Corporation

            17.1.3.1. Overview

            17.1.3.2. Product Portfolio

            17.1.3.3. Profitability by Market Segments

            17.1.3.4. Sales Footprint

            17.1.3.5. Strategy Overview

                17.1.3.5.1. Marketing Strategy

                17.1.3.5.2. Product Strategy

                17.1.3.5.3. Channel Strategy

        17.1.4. Anhui Fubore Pharmaceutical & Chemical Co.Ltd.

            17.1.4.1. Overview

            17.1.4.2. Product Portfolio

            17.1.4.3. Profitability by Market Segments

            17.1.4.4. Sales Footprint

            17.1.4.5. Strategy Overview

                17.1.4.5.1. Marketing Strategy

                17.1.4.5.2. Product Strategy

                17.1.4.5.3. Channel Strategy

        17.1.5. Functional Food chem International Corporation

            17.1.5.1. Overview

            17.1.5.2. Product Portfolio

            17.1.5.3. Profitability by Market Segments

            17.1.5.4. Sales Footprint

            17.1.5.5. Strategy Overview

                17.1.5.5.1. Marketing Strategy

                17.1.5.5.2. Product Strategy

                17.1.5.5.3. Channel Strategy

        17.1.6. Jungbunzlauer

            17.1.6.1. Overview

            17.1.6.2. Product Portfolio

            17.1.6.3. Profitability by Market Segments

            17.1.6.4. Sales Footprint

            17.1.6.5. Strategy Overview

                17.1.6.5.1. Marketing Strategy

                17.1.6.5.2. Product Strategy

                17.1.6.5.3. Channel Strategy

        17.1.7. Shandong Fuyuan Bio-Tech CO.LTD.

            17.1.7.1. Overview

            17.1.7.2. Product Portfolio

            17.1.7.3. Profitability by Market Segments

            17.1.7.4. Sales Footprint

            17.1.7.5. Strategy Overview

                17.1.7.5.1. Marketing Strategy

                17.1.7.5.2. Product Strategy

                17.1.7.5.3. Channel Strategy

        17.1.8. Roquette Frères

            17.1.8.1. Overview

            17.1.8.2. Product Portfolio

            17.1.8.3. Profitability by Market Segments

            17.1.8.4. Sales Footprint

            17.1.8.5. Strategy Overview

                17.1.8.5.1. Marketing Strategy

                17.1.8.5.2. Product Strategy

                17.1.8.5.3. Channel Strategy

        17.1.9. Shandong Xinhong Pharmaceutical Co., Ltd.

            17.1.9.1. Overview

            17.1.9.2. Product Portfolio

            17.1.9.3. Profitability by Market Segments

            17.1.9.4. Sales Footprint

            17.1.9.5. Strategy Overview

                17.1.9.5.1. Marketing Strategy

                17.1.9.5.2. Product Strategy

                17.1.9.5.3. Channel Strategy

        17.1.10. Shandong Baisheng Biotechnology Co., Ltd.

            17.1.10.1. Overview

            17.1.10.2. Product Portfolio

            17.1.10.3. Profitability by Market Segments

            17.1.10.4. Sales Footprint

            17.1.10.5. Strategy Overview

                17.1.10.5.1. Marketing Strategy

                17.1.10.5.2. Product Strategy

                17.1.10.5.3. Channel Strategy

        17.1.11. Ceto Coorporation

            17.1.11.1. Overview

            17.1.11.2. Product Portfolio

            17.1.11.3. Profitability by Market Segments

            17.1.11.4. Sales Footprint

            17.1.11.5. Strategy Overview

                17.1.11.5.1. Marketing Strategy

                17.1.11.5.2. Product Strategy

                17.1.11.5.3. Channel Strategy

        17.1.12. Creative Compound

            17.1.12.1. Overview

            17.1.12.2. Product Portfolio

            17.1.12.3. Profitability by Market Segments

            17.1.12.4. Sales Footprint

            17.1.12.5. Strategy Overview

                17.1.12.5.1. Marketing Strategy

                17.1.12.5.2. Product Strategy

                17.1.12.5.3. Channel Strategy

        17.1.13. Foodchem International

            17.1.13.1. Overview

            17.1.13.2. Product Portfolio

            17.1.13.3. Profitability by Market Segments

            17.1.13.4. Sales Footprint

            17.1.13.5. Strategy Overview

                17.1.13.5.1. Marketing Strategy

                17.1.13.5.2. Product Strategy

                17.1.13.5.3. Channel Strategy

        17.1.14. Merck Millipore

            17.1.14.1. Overview

            17.1.14.2. Product Portfolio

            17.1.14.3. Profitability by Market Segments

            17.1.14.4. Sales Footprint

            17.1.14.5. Strategy Overview

                17.1.14.5.1. Marketing Strategy

                17.1.14.5.2. Product Strategy

                17.1.14.5.3. Channel Strategy

18. Assumptions & Acronyms Used

19. Research Methodology

Don't pay for what you don't need

Customize your report by selecting specific countries or regions and save 30%!

List of Tables

Table 1: Global Market Value (US$ Million) Forecast by Region, 2018 to 2033

Table 2: Global Market Volume (MT) Forecast by Region, 2018 to 2033

Table 3: Global Market Value (US$ Million) Forecast by Form, 2018 to 2033

Table 4: Global Market Volume (MT) Forecast by Form, 2018 to 2033

Table 5: Global Market Value (US$ Million) Forecast by End Use, 2018 to 2033

Table 6: Global Market Volume (MT) Forecast by End Use, 2018 to 2033

Table 7: North America Market Value (US$ Million) Forecast by Country, 2018 to 2033

Table 8: North America Market Volume (MT) Forecast by Country, 2018 to 2033

Table 9: North America Market Value (US$ Million) Forecast by Form, 2018 to 2033

Table 10: North America Market Volume (MT) Forecast by Form, 2018 to 2033

Table 11: North America Market Value (US$ Million) Forecast by End Use, 2018 to 2033

Table 12: North America Market Volume (MT) Forecast by End Use, 2018 to 2033

Table 13: Latin America Market Value (US$ Million) Forecast by Country, 2018 to 2033

Table 14: Latin America Market Volume (MT) Forecast by Country, 2018 to 2033

Table 15: Latin America Market Value (US$ Million) Forecast by Form, 2018 to 2033

Table 16: Latin America Market Volume (MT) Forecast by Form, 2018 to 2033

Table 17: Latin America Market Value (US$ Million) Forecast by End Use, 2018 to 2033

Table 18: Latin America Market Volume (MT) Forecast by End Use, 2018 to 2033

Table 19: Western Europe Market Value (US$ Million) Forecast by Country, 2018 to 2033

Table 20: Western Europe Market Volume (MT) Forecast by Country, 2018 to 2033

Table 21: Western Europe Market Value (US$ Million) Forecast by Form, 2018 to 2033

Table 22: Western Europe Market Volume (MT) Forecast by Form, 2018 to 2033

Table 23: Western Europe Market Value (US$ Million) Forecast by End Use, 2018 to 2033

Table 24: Western Europe Market Volume (MT) Forecast by End Use, 2018 to 2033

Table 25: Eastern Europe Market Value (US$ Million) Forecast by Country, 2018 to 2033

Table 26: Eastern Europe Market Volume (MT) Forecast by Country, 2018 to 2033

Table 27: Eastern Europe Market Value (US$ Million) Forecast by Form, 2018 to 2033

Table 28: Eastern Europe Market Volume (MT) Forecast by Form, 2018 to 2033

Table 29: Eastern Europe Market Value (US$ Million) Forecast by End Use, 2018 to 2033

Table 30: Eastern Europe Market Volume (MT) Forecast by End Use, 2018 to 2033

Table 31: South Asia and Pacific Market Value (US$ Million) Forecast by Country, 2018 to 2033

Table 32: South Asia and Pacific Market Volume (MT) Forecast by Country, 2018 to 2033

Table 33: South Asia and Pacific Market Value (US$ Million) Forecast by Form, 2018 to 2033

Table 34: South Asia and Pacific Market Volume (MT) Forecast by Form, 2018 to 2033

Table 35: South Asia and Pacific Market Value (US$ Million) Forecast by End Use, 2018 to 2033

Table 36: South Asia and Pacific Market Volume (MT) Forecast by End Use, 2018 to 2033

Table 37: East Asia Market Value (US$ Million) Forecast by Country, 2018 to 2033

Table 38: East Asia Market Volume (MT) Forecast by Country, 2018 to 2033

Table 39: East Asia Market Value (US$ Million) Forecast by Form, 2018 to 2033

Table 40: East Asia Market Volume (MT) Forecast by Form, 2018 to 2033

Table 41: East Asia Market Value (US$ Million) Forecast by End Use, 2018 to 2033

Table 42: East Asia Market Volume (MT) Forecast by End Use, 2018 to 2033

Table 43: Middle East and Africa Market Value (US$ Million) Forecast by Country, 2018 to 2033

Table 44: Middle East and Africa Market Volume (MT) Forecast by Country, 2018 to 2033

Table 45: Middle East and Africa Market Value (US$ Million) Forecast by Form, 2018 to 2033

Table 46: Middle East and Africa Market Volume (MT) Forecast by Form, 2018 to 2033

Table 47: Middle East and Africa Market Value (US$ Million) Forecast by End Use, 2018 to 2033

Table 48: Middle East and Africa Market Volume (MT) Forecast by End Use, 2018 to 2033
Nandini Roy Choudhury

Principal Consultant

Talk to Analyst

Find your sweet spots for generating winning opportunities in this market.

List of Charts

Figure 1: Global Market Value (US$ Million) by Form, 2023 to 2033

Figure 2: Global Market Value (US$ Million) by End Use, 2023 to 2033

Figure 3: Global Market Value (US$ Million) by Region, 2023 to 2033

Figure 4: Global Market Value (US$ Million) Analysis by Region, 2018 to 2033

Figure 5: Global Market Volume (MT) Analysis by Region, 2018 to 2033

Figure 6: Global Market Value Share (%) and BPS Analysis by Region, 2023 to 2033

Figure 7: Global Market Y-o-Y Growth (%) Projections by Region, 2023 to 2033

Figure 8: Global Market Value (US$ Million) Analysis by Form, 2018 to 2033

Figure 9: Global Market Volume (MT) Analysis by Form, 2018 to 2033

Figure 10: Global Market Value Share (%) and BPS Analysis by Form, 2023 to 2033

Figure 11: Global Market Y-o-Y Growth (%) Projections by Form, 2023 to 2033

Figure 12: Global Market Value (US$ Million) Analysis by End Use, 2018 to 2033

Figure 13: Global Market Volume (MT) Analysis by End Use, 2018 to 2033

Figure 14: Global Market Value Share (%) and BPS Analysis by End Use, 2023 to 2033

Figure 15: Global Market Y-o-Y Growth (%) Projections by End Use, 2023 to 2033

Figure 16: Global Market Attractiveness by Form, 2023 to 2033

Figure 17: Global Market Attractiveness by End Use, 2023 to 2033

Figure 18: Global Market Attractiveness by Region, 2023 to 2033

Figure 19: North America Market Value (US$ Million) by Form, 2023 to 2033

Figure 20: North America Market Value (US$ Million) by End Use, 2023 to 2033

Figure 21: North America Market Value (US$ Million) by Country, 2023 to 2033

Figure 22: North America Market Value (US$ Million) Analysis by Country, 2018 to 2033

Figure 23: North America Market Volume (MT) Analysis by Country, 2018 to 2033

Figure 24: North America Market Value Share (%) and BPS Analysis by Country, 2023 to 2033

Figure 25: North America Market Y-o-Y Growth (%) Projections by Country, 2023 to 2033

Figure 26: North America Market Value (US$ Million) Analysis by Form, 2018 to 2033

Figure 27: North America Market Volume (MT) Analysis by Form, 2018 to 2033

Figure 28: North America Market Value Share (%) and BPS Analysis by Form, 2023 to 2033

Figure 29: North America Market Y-o-Y Growth (%) Projections by Form, 2023 to 2033

Figure 30: North America Market Value (US$ Million) Analysis by End Use, 2018 to 2033

Figure 31: North America Market Volume (MT) Analysis by End Use, 2018 to 2033

Figure 32: North America Market Value Share (%) and BPS Analysis by End Use, 2023 to 2033

Figure 33: North America Market Y-o-Y Growth (%) Projections by End Use, 2023 to 2033

Figure 34: North America Market Attractiveness by Form, 2023 to 2033

Figure 35: North America Market Attractiveness by End Use, 2023 to 2033

Figure 36: North America Market Attractiveness by Country, 2023 to 2033

Figure 37: Latin America Market Value (US$ Million) by Form, 2023 to 2033

Figure 38: Latin America Market Value (US$ Million) by End Use, 2023 to 2033

Figure 39: Latin America Market Value (US$ Million) by Country, 2023 to 2033

Figure 40: Latin America Market Value (US$ Million) Analysis by Country, 2018 to 2033

Figure 41: Latin America Market Volume (MT) Analysis by Country, 2018 to 2033

Figure 42: Latin America Market Value Share (%) and BPS Analysis by Country, 2023 to 2033

Figure 43: Latin America Market Y-o-Y Growth (%) Projections by Country, 2023 to 2033

Figure 44: Latin America Market Value (US$ Million) Analysis by Form, 2018 to 2033

Figure 45: Latin America Market Volume (MT) Analysis by Form, 2018 to 2033

Figure 46: Latin America Market Value Share (%) and BPS Analysis by Form, 2023 to 2033

Figure 47: Latin America Market Y-o-Y Growth (%) Projections by Form, 2023 to 2033

Figure 48: Latin America Market Value (US$ Million) Analysis by End Use, 2018 to 2033

Figure 49: Latin America Market Volume (MT) Analysis by End Use, 2018 to 2033

Figure 50: Latin America Market Value Share (%) and BPS Analysis by End Use, 2023 to 2033

Figure 51: Latin America Market Y-o-Y Growth (%) Projections by End Use, 2023 to 2033

Figure 52: Latin America Market Attractiveness by Form, 2023 to 2033

Figure 53: Latin America Market Attractiveness by End Use, 2023 to 2033

Figure 54: Latin America Market Attractiveness by Country, 2023 to 2033

Figure 55: Western Europe Market Value (US$ Million) by Form, 2023 to 2033

Figure 56: Western Europe Market Value (US$ Million) by End Use, 2023 to 2033

Figure 57: Western Europe Market Value (US$ Million) by Country, 2023 to 2033

Figure 58: Western Europe Market Value (US$ Million) Analysis by Country, 2018 to 2033

Figure 59: Western Europe Market Volume (MT) Analysis by Country, 2018 to 2033

Figure 60: Western Europe Market Value Share (%) and BPS Analysis by Country, 2023 to 2033

Figure 61: Western Europe Market Y-o-Y Growth (%) Projections by Country, 2023 to 2033

Figure 62: Western Europe Market Value (US$ Million) Analysis by Form, 2018 to 2033

Figure 63: Western Europe Market Volume (MT) Analysis by Form, 2018 to 2033

Figure 64: Western Europe Market Value Share (%) and BPS Analysis by Form, 2023 to 2033

Figure 65: Western Europe Market Y-o-Y Growth (%) Projections by Form, 2023 to 2033

Figure 66: Western Europe Market Value (US$ Million) Analysis by End Use, 2018 to 2033

Figure 67: Western Europe Market Volume (MT) Analysis by End Use, 2018 to 2033

Figure 68: Western Europe Market Value Share (%) and BPS Analysis by End Use, 2023 to 2033

Figure 69: Western Europe Market Y-o-Y Growth (%) Projections by End Use, 2023 to 2033

Figure 70: Western Europe Market Attractiveness by Form, 2023 to 2033

Figure 71: Western Europe Market Attractiveness by End Use, 2023 to 2033

Figure 72: Western Europe Market Attractiveness by Country, 2023 to 2033

Figure 73: Eastern Europe Market Value (US$ Million) by Form, 2023 to 2033

Figure 74: Eastern Europe Market Value (US$ Million) by End Use, 2023 to 2033

Figure 75: Eastern Europe Market Value (US$ Million) by Country, 2023 to 2033

Figure 76: Eastern Europe Market Value (US$ Million) Analysis by Country, 2018 to 2033

Figure 77: Eastern Europe Market Volume (MT) Analysis by Country, 2018 to 2033

Figure 78: Eastern Europe Market Value Share (%) and BPS Analysis by Country, 2023 to 2033

Figure 79: Eastern Europe Market Y-o-Y Growth (%) Projections by Country, 2023 to 2033

Figure 80: Eastern Europe Market Value (US$ Million) Analysis by Form, 2018 to 2033

Figure 81: Eastern Europe Market Volume (MT) Analysis by Form, 2018 to 2033

Figure 82: Eastern Europe Market Value Share (%) and BPS Analysis by Form, 2023 to 2033

Figure 83: Eastern Europe Market Y-o-Y Growth (%) Projections by Form, 2023 to 2033

Figure 84: Eastern Europe Market Value (US$ Million) Analysis by End Use, 2018 to 2033

Figure 85: Eastern Europe Market Volume (MT) Analysis by End Use, 2018 to 2033

Figure 86: Eastern Europe Market Value Share (%) and BPS Analysis by End Use, 2023 to 2033

Figure 87: Eastern Europe Market Y-o-Y Growth (%) Projections by End Use, 2023 to 2033

Figure 88: Eastern Europe Market Attractiveness by Form, 2023 to 2033

Figure 89: Eastern Europe Market Attractiveness by End Use, 2023 to 2033

Figure 90: Eastern Europe Market Attractiveness by Country, 2023 to 2033

Figure 91: South Asia and Pacific Market Value (US$ Million) by Form, 2023 to 2033

Figure 92: South Asia and Pacific Market Value (US$ Million) by End Use, 2023 to 2033

Figure 93: South Asia and Pacific Market Value (US$ Million) by Country, 2023 to 2033

Figure 94: South Asia and Pacific Market Value (US$ Million) Analysis by Country, 2018 to 2033

Figure 95: South Asia and Pacific Market Volume (MT) Analysis by Country, 2018 to 2033

Figure 96: South Asia and Pacific Market Value Share (%) and BPS Analysis by Country, 2023 to 2033

Figure 97: South Asia and Pacific Market Y-o-Y Growth (%) Projections by Country, 2023 to 2033

Figure 98: South Asia and Pacific Market Value (US$ Million) Analysis by Form, 2018 to 2033

Figure 99: South Asia and Pacific Market Volume (MT) Analysis by Form, 2018 to 2033

Figure 100: South Asia and Pacific Market Value Share (%) and BPS Analysis by Form, 2023 to 2033

Figure 101: South Asia and Pacific Market Y-o-Y Growth (%) Projections by Form, 2023 to 2033

Figure 102: South Asia and Pacific Market Value (US$ Million) Analysis by End Use, 2018 to 2033

Figure 103: South Asia and Pacific Market Volume (MT) Analysis by End Use, 2018 to 2033

Figure 104: South Asia and Pacific Market Value Share (%) and BPS Analysis by End Use, 2023 to 2033

Figure 105: South Asia and Pacific Market Y-o-Y Growth (%) Projections by End Use, 2023 to 2033

Figure 106: South Asia and Pacific Market Attractiveness by Form, 2023 to 2033

Figure 107: South Asia and Pacific Market Attractiveness by End Use, 2023 to 2033

Figure 108: South Asia and Pacific Market Attractiveness by Country, 2023 to 2033

Figure 109: East Asia Market Value (US$ Million) by Form, 2023 to 2033

Figure 110: East Asia Market Value (US$ Million) by End Use, 2023 to 2033

Figure 111: East Asia Market Value (US$ Million) by Country, 2023 to 2033

Figure 112: East Asia Market Value (US$ Million) Analysis by Country, 2018 to 2033

Figure 113: East Asia Market Volume (MT) Analysis by Country, 2018 to 2033

Figure 114: East Asia Market Value Share (%) and BPS Analysis by Country, 2023 to 2033

Figure 115: East Asia Market Y-o-Y Growth (%) Projections by Country, 2023 to 2033

Figure 116: East Asia Market Value (US$ Million) Analysis by Form, 2018 to 2033

Figure 117: East Asia Market Volume (MT) Analysis by Form, 2018 to 2033

Figure 118: East Asia Market Value Share (%) and BPS Analysis by Form, 2023 to 2033

Figure 119: East Asia Market Y-o-Y Growth (%) Projections by Form, 2023 to 2033

Figure 120: East Asia Market Value (US$ Million) Analysis by End Use, 2018 to 2033

Figure 121: East Asia Market Volume (MT) Analysis by End Use, 2018 to 2033

Figure 122: East Asia Market Value Share (%) and BPS Analysis by End Use, 2023 to 2033

Figure 123: East Asia Market Y-o-Y Growth (%) Projections by End Use, 2023 to 2033

Figure 124: East Asia Market Attractiveness by Form, 2023 to 2033

Figure 125: East Asia Market Attractiveness by End Use, 2023 to 2033

Figure 126: East Asia Market Attractiveness by Country, 2023 to 2033

Figure 127: Middle East and Africa Market Value (US$ Million) by Form, 2023 to 2033

Figure 128: Middle East and Africa Market Value (US$ Million) by End Use, 2023 to 2033

Figure 129: Middle East and Africa Market Value (US$ Million) by Country, 2023 to 2033

Figure 130: Middle East and Africa Market Value (US$ Million) Analysis by Country, 2018 to 2033

Figure 131: Middle East and Africa Market Volume (MT) Analysis by Country, 2018 to 2033

Figure 132: Middle East and Africa Market Value Share (%) and BPS Analysis by Country, 2023 to 2033

Figure 133: Middle East and Africa Market Y-o-Y Growth (%) Projections by Country, 2023 to 2033

Figure 134: Middle East and Africa Market Value (US$ Million) Analysis by Form, 2018 to 2033

Figure 135: Middle East and Africa Market Volume (MT) Analysis by Form, 2018 to 2033

Figure 136: Middle East and Africa Market Value Share (%) and BPS Analysis by Form, 2023 to 2033

Figure 137: Middle East and Africa Market Y-o-Y Growth (%) Projections by Form, 2023 to 2033

Figure 138: Middle East and Africa Market Value (US$ Million) Analysis by End Use, 2018 to 2033

Figure 139: Middle East and Africa Market Volume (MT) Analysis by End Use, 2018 to 2033

Figure 140: Middle East and Africa Market Value Share (%) and BPS Analysis by End Use, 2023 to 2033

Figure 141: Middle East and Africa Market Y-o-Y Growth (%) Projections by End Use, 2023 to 2033

Figure 142: Middle East and Africa Market Attractiveness by Form, 2023 to 2033

Figure 143: Middle East and Africa Market Attractiveness by End Use, 2023 to 2033

Figure 144: Middle East and Africa Market Attractiveness by Country, 2023 to 2033

Recommendations

Food and Beverage

Food Premix Market

Published : March 2024

Food and Beverage

Bakery Ingredient Market

Published : October 2023

Explore Food and Beverage Insights

View Reports