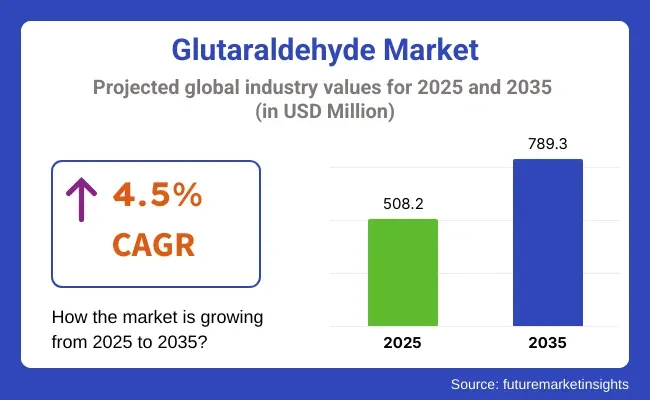
The market will grow at a CAGR of 4.5% and it is projected to reach USD 789.3 million by 2035 from USD 508.2 million in 2025. Booming demand for high-level disinfectants in healthcare, stringent hygiene standards in food processing, and regulatory pressure to prevent microbial growth in industrial water systems are driving the growth. Innovations in its formulation and development of controlled-release products are also expanding the compound to niche industrial applications.
| Metric | Value |
|---|---|
| Market Size (2025E) | USD 508.2 Million |
| Market Value (2035F) | USD 789.3 Million |
| CAGR (2025 to 2035) | 4.5% |
The glutaraldehyde market is forecast to grow steadily from 2025 to 2035 owing to its wide-end usage across healthcare, water treatment, animal husbandry and their sectors. Glutaraldehyde is a powerful biocidal, disinfectant, and crosslinking agent, commonly used for the cold sterilization of medical and dental equipment, in disinfectant formulations, and as a fixative in the laboratory. As industrial hygiene and sustainability efforts grow, it has also found expanded use as a microbicide in oil and gas pipelines and in cooling water systems.
| By Product | Market Share (2025) |
|---|---|
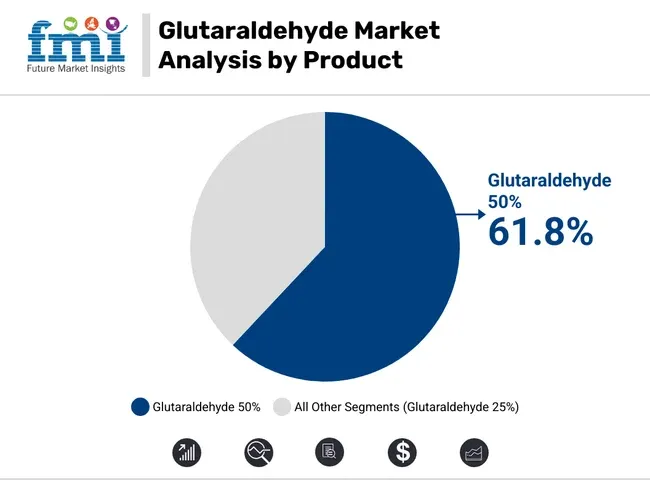
| Glutaraldehyde 50% | 61.8% |
The largest share of the glutaraldehyde market is accounted by the 50% grade because of its application in disinfection, sterilization and industrial processing. With a good biocidal property at high concentration, is widely used in anti-microbial applications, pregnant women and so on.
Glutaraldehyde 50% is widely used as a cold sterilant in hospitals and by healthcare providers for sterilizing surgical instruments, endoscopes and other reusable medical equipment. This broad-spectrum antimicrobial effect enables it to kill bacteria, viruses and fungi without material corrosion. Leather, paper and oil & gas manufacturers also prefer the 50% concentration for its chemical stability and better performance in cross-linking and biocidal formulations.
You are able to operate as a time and resource effectively solution with its 50% grade where only half the volume needed to be used in each application due to its higher efficacy. The approval of Glutaraldehyde 50% in various countries remains conducive to the market share of Glutaraldehyde 50% for healthcare and industrial purposes, which is further enhanced by manufacturers increasingly focusing on enhancing the safety of formulations and packaging aspects focused on ease of handling.
| By Application | Market Share (2025) |
|---|---|
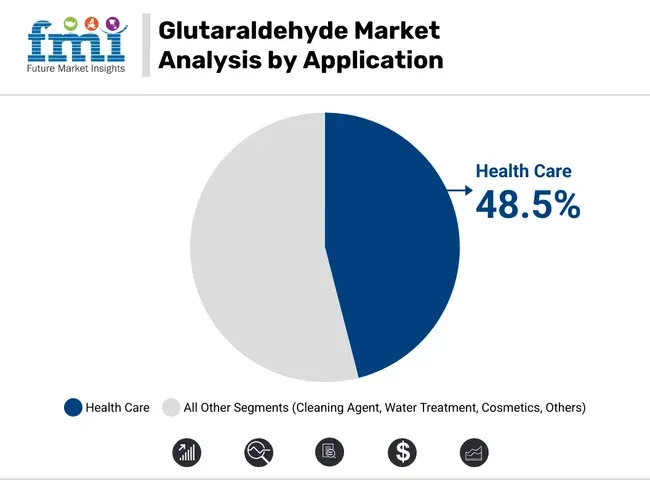
| Health Care | 48.5% |
Industry-wise, healthcare industry is the major consumer for glutaraldehyde as it plays a major role in the sterilization and disinfection process. Glutaraldehyde-based products are a mainstay for hospitals, outpatient clinics, and diagnostic laboratories for the sterilization of non-autoclavable medical instruments and surgical devices. Glutaraldehyde is invariably used in Infection Prevention & Control in healthcare settings because it destroys many pathogens.
Glutaraldehyde, which is favoured by healthcare administrators and infection control specialists, creates non-corrosive interactions with metals and is compatible with more complex instruments. As a trusted conventional in medical-grade sanitation protocols, its proven ability to thoroughly disinfect high-touch surfaces and reusable equipment, combined with its cost-effectiveness, further strengthens its standing. Furthermore, the increasing number of surgical procedures, particularly in emerging markets, keeps driving the demand for glutaraldehyde in hospitals and ambulatory centres.
Manufacturers are investing in new formulations that feature fewer odours and less risk for worker exposure to the products in order to keep workers safe and compliant with health regulations. Training programs regarding appropriate usage and better ventilation systems in hospitals have additionally aided continued adoption, elevating healthcare as a noteworthy application segment in glutaraldehyde industry.
Toxicity and Environmental Concerns
Glutaraldehyde, although effective, can be toxic to humans and aquatic organisms, which reduces its use in some applications and geographic areas. Harmful if inhaled or absorbed through skin causes severe irritation or sensitization.
As environmental regulations become more stringent especially in Europe and portions of North Americaexposure limits and disposal practices for certain toxins are increasingly under scrutiny. Developing reliable designs that comply with changing consumer demand, safety, and environmental norms while ensuring effective product performance presents a challenge for manufacturers.
Development of Safer, High-Efficiency Formulations
Continuous innovation help in providing the low-toxicity, high-performance solutions. The shelf life, corrosivity, biocidal effectiveness of glutaraldehyde can be improved by combining it with stabilizers and pH buffers. In addition, controlled-release technologies and microencapsulation can potentially be applied to reduce handling risks and enhance operational safety. As the demand for effective but safe disinfectants increases, such innovations could broaden the compound’s use in healthcare, veterinary hygiene and food & beverage sanitation.
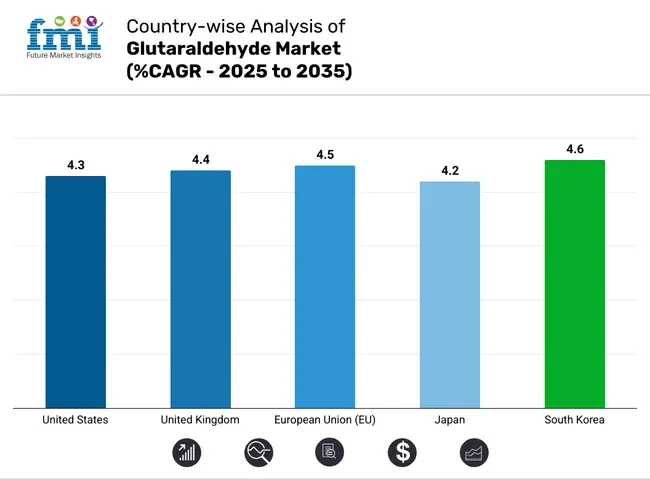
From 2025 to 2035, the United States market for glutaraldehyde is anticipated to grow at a CAGR of 4.3%. The rise in adoption of high-level disinfectants for healthcare and diagnostic application is driving your growth area. With increased vigilance over infection control, hospitals and laboratories are using glutaraldehyde-based solutions in sterilization regimens.
Furthermore, the increasing usage of it in industrial water treatment processes and also as a fixative in scientific research keeps providing support for the market dynamics. Further, regulatory compliance and biosafety guidelines promote sustained product demand across diverse high-precision applications.
| Country | CAGR (2025 to 2035) |
|---|---|
| United States | 4.3% |
Market for glutaraldehyde in the United Kingdom is anticipated to grow at a healthy CAGR of 4.4% over the next decade. Well-established healthcare infrastructure and the emphasis on reducing healthcare-associated infections in the country is likely to bolster the adoption of glutaraldehyde disinfectants.
Its use in cold sterilization, veterinary care, and dentistry is gradually increasing. Environmental and regulatory frameworks also play a role in incentivizing the development of stabilized formulations with enhanced safety, further shaping the trajectory of the market in the country.
| Country | CAGR (2025 to 2035) |
|---|---|
| United Kingdom | 4.4% |
The glutaraldehyde market of the European region is projected to expand at a CAGR of 4.5% latest by 2035. The steady uptake of glutaraldehyde across multiple industries is supported by increasing investments in advanced sterilization systems in the region, along with the growth of biopharmaceutical manufacturing.
The likes of Germany, France and Italy, are big contributors in the area as they focus on infection control, pharmaceutical quality assurance, and environmental safety. Rising standards around disinfection efficacy and chemical safety are also driving innovation in product formulation, as regulators tighten the screws on manufacturers.
| Region | CAGR (2025 to 2035) |
|---|---|
| European Union | 4.5% |
From 2025 to 2035, glutaraldehyde market in Japan is anticipated to grow at a CAGR of 4.2%. Demand in medical device sterilization and pharmaceutical quality control, as well as high-purity chemical manufacturing, underlies the market.
Sterilization agents like glutaraldehyde will continue to be an essential part in Japan as the country also focuses on advanced healthcare solutions and care for its aging population. In addition, stringent hygiene requirements in food processing and healthcare settings are driving adoption.
| Country | CAGR (2025 to 2035) |
|---|---|
| Japan | 4.2% |
Glutaraldehyde market in South Korea is expected to grow by 4.6% CAGR during the period 2023 to 2028. Demand is being propelled by the country’s burgeoning life sciences industry and investment into pharmaceutical manufacturing facilities.
Its role as a cross-linking agent and antimicrobial compound in varied applicationswell into leather processing and laboratory researchguarantees stable growth. Harmonisation with worldwide disinfection standards and a strong supply chain also adds to the market scalability.
| Country | CAGR (2025 to 2035) |
|---|---|
| South Korea | 4.6% |
The glutaraldehyde market is expected to experience significant growth because of the increase in demand for performance-oriented disinfectants, sterilization agents, and fixatives in the healthcare, water treatment, and leather processing sectors. In response to global regulations and strive to keep quality standards consistent for use in all sectors of industry, the best companies are enhancing production technologies and strengthening supply chain capabilities.
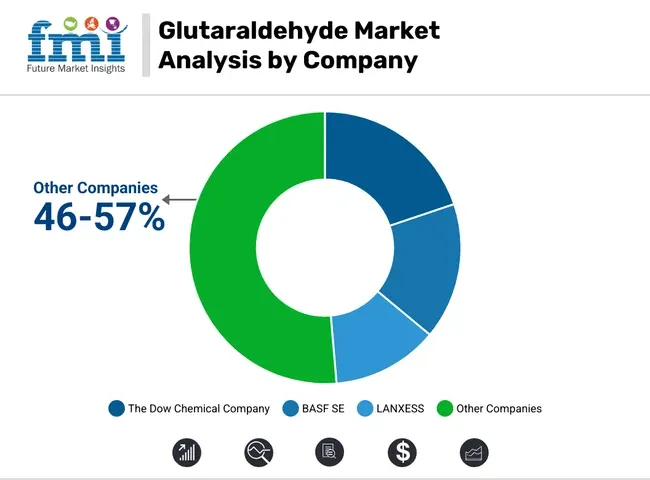
The Dow Chemical Company (18-22%)
Dow leads with high-grade, multipurpose glutaraldehyde offerings used in medical sterilization, oil & gas, and industrial disinfection. Its global distribution and advanced R&D capabilities solidify its market dominance.
BASF SE (14-18%)
BASF focuses on sustainable glutaraldehyde formulations that comply with European Union biocidal regulations. It actively invests in R&D to meet evolving sterilization needs in hospitals and laboratories.
LANXESS (11-14%)
LANXESS positions itself as a key supplier of ultra-pure glutaraldehyde for leather tanning and specialty chemicals. It leverages backward integration and a strong European presence.
Chemtex Speciality Limited
Chemtex has gained traction in emerging markets by offering cost-effective and application-specific glutaraldehyde solutions, particularly for water treatment and poultry disinfection.
Other Key Players (46-57% Combined)
These companies contribute to market fragmentation by offering regionally focused or niche-grade glutaraldehyde products:
The overall market size for the Glutaraldehyde Market was USD 508.2 Million in 2025.
The Glutaraldehyde Market is expected to reach USD 789.3 Million in 2035.
The demand is driven by increasing use as a disinfectant and sterilizing agent in healthcare, rising applications in water treatment and oil & gas industries, and growing adoption in leather tanning and laboratory chemical processes.
The top 5 countries driving market growth are the USA, UK, Europe, Japan and South Korea.
The healthcare segment is expected to command a significant share over the assessment period.
Table 1: Global Market Value (US$ Million) Forecast by Region, 2017 to 2032
Table 2: Global Market Volume (Tons) Forecast by Region, 2017 to 2032
Table 3: Global Market Value (US$ Million) Forecast by Product Type, 2017 to 2032
Table 4: Global Market Volume (Tons) Forecast by Product Type, 2017 to 2032
Table 5: Global Market Value (US$ Million) Forecast by Application, 2017 to 2032
Table 6: Global Market Volume (Tons) Forecast by Application, 2017 to 2032
Table 7: Global Market Value (US$ Million) Forecast by End-Use, 2017 to 2032
Table 8: Global Market Volume (Tons) Forecast by End-Use, 2017 to 2032
Table 9: North America Market Value (US$ Million) Forecast by Country, 2017 to 2032
Table 10: North America Market Volume (Tons) Forecast by Country, 2017 to 2032
Table 11: North America Market Value (US$ Million) Forecast by Product Type, 2017 to 2032
Table 12: North America Market Volume (Tons) Forecast by Product Type, 2017 to 2032
Table 13: North America Market Value (US$ Million) Forecast by Application, 2017 to 2032
Table 14: North America Market Volume (Tons) Forecast by Application, 2017 to 2032
Table 15: North America Market Value (US$ Million) Forecast by End-Use, 2017 to 2032
Table 16: North America Market Volume (Tons) Forecast by End-Use, 2017 to 2032
Table 17: Latin America Market Value (US$ Million) Forecast by Country, 2017 to 2032
Table 18: Latin America Market Volume (Tons) Forecast by Country, 2017 to 2032
Table 19: Latin America Market Value (US$ Million) Forecast by Product Type, 2017 to 2032
Table 20: Latin America Market Volume (Tons) Forecast by Product Type, 2017 to 2032
Table 21: Latin America Market Value (US$ Million) Forecast by Application, 2017 to 2032
Table 22: Latin America Market Volume (Tons) Forecast by Application, 2017 to 2032
Table 23: Latin America Market Value (US$ Million) Forecast by End-Use, 2017 to 2032
Table 24: Latin America Market Volume (Tons) Forecast by End-Use, 2017 to 2032
Table 25: Europe Market Value (US$ Million) Forecast by Country, 2017 to 2032
Table 26: Europe Market Volume (Tons) Forecast by Country, 2017 to 2032
Table 27: Europe Market Value (US$ Million) Forecast by Product Type, 2017 to 2032
Table 28: Europe Market Volume (Tons) Forecast by Product Type, 2017 to 2032
Table 29: Europe Market Value (US$ Million) Forecast by Application, 2017 to 2032
Table 30: Europe Market Volume (Tons) Forecast by Application, 2017 to 2032
Table 31: Europe Market Value (US$ Million) Forecast by End-Use, 2017 to 2032
Table 32: Europe Market Volume (Tons) Forecast by End-Use, 2017 to 2032
Table 33: East Asia Market Value (US$ Million) Forecast by Country, 2017 to 2032
Table 34: East Asia Market Volume (Tons) Forecast by Country, 2017 to 2032
Table 35: East Asia Market Value (US$ Million) Forecast by Product Type, 2017 to 2032
Table 36: East Asia Market Volume (Tons) Forecast by Product Type, 2017 to 2032
Table 37: East Asia Market Value (US$ Million) Forecast by Application, 2017 to 2032
Table 38: East Asia Market Volume (Tons) Forecast by Application, 2017 to 2032
Table 39: East Asia Market Value (US$ Million) Forecast by End-Use, 2017 to 2032
Table 40: East Asia Market Volume (Tons) Forecast by End-Use, 2017 to 2032
Table 41: South Asia & Pacific Market Value (US$ Million) Forecast by Country, 2017 to 2032
Table 42: South Asia & Pacific Market Volume (Tons) Forecast by Country, 2017 to 2032
Table 43: South Asia & Pacific Market Value (US$ Million) Forecast by Product Type, 2017 to 2032
Table 44: South Asia & Pacific Market Volume (Tons) Forecast by Product Type, 2017 to 2032
Table 45: South Asia & Pacific Market Value (US$ Million) Forecast by Application, 2017 to 2032
Table 46: South Asia & Pacific Market Volume (Tons) Forecast by Application, 2017 to 2032
Table 47: South Asia & Pacific Market Value (US$ Million) Forecast by End-Use, 2017 to 2032
Table 48: South Asia & Pacific Market Volume (Tons) Forecast by End-Use, 2017 to 2032
Table 49: MEA Market Value (US$ Million) Forecast by Country, 2017 to 2032
Table 50: MEA Market Volume (Tons) Forecast by Country, 2017 to 2032
Table 51: MEA Market Value (US$ Million) Forecast by Product Type, 2017 to 2032
Table 52: MEA Market Volume (Tons) Forecast by Product Type, 2017 to 2032
Table 53: MEA Market Value (US$ Million) Forecast by Application, 2017 to 2032
Table 54: MEA Market Volume (Tons) Forecast by Application, 2017 to 2032
Table 55: MEA Market Value (US$ Million) Forecast by End-Use, 2017 to 2032
Table 56: MEA Market Volume (Tons) Forecast by End-Use, 2017 to 2032
Figure 1: Global Glutaraldehyde Market Value (US$ Mn) by Product Type, 2022-2032
Figure 2: Global Glutaraldehyde Market Value (US$ Mn) by Application, 2022-2032
Figure 3: Global Glutaraldehyde Market Value (US$ Mn) by End-Use, 2022-2032
Figure 4: Global Glutaraldehyde Market Value (US$ Mn) by Region, 2022-2032
Figure 5: Global Glutaraldehyde Market Value (US$ Mn) Analysis by Region, 2017-2032
Figure 6: Global Glutaraldehyde Market Volume (Tons) Analysis by Region, 2017-2032
Figure 7: Global Glutaraldehyde Market Value Share (%) and BPS Analysis by Region, 2022-2032
Figure 8: Global Glutaraldehyde Market Y-o-Y Growth (%) Projections by Region, 2022-2032
Figure 9: Global Glutaraldehyde Market Value (US$ Mn) Analysis by Product Type, 2017-2032
Figure 10: Global Glutaraldehyde Market Volume (Tons) Analysis by Product Type, 2017-2032
Figure 11: Global Glutaraldehyde Market Value Share (%) and BPS Analysis by Product Type, 2022-2032
Figure 12: Global Glutaraldehyde Market Y-o-Y Growth (%) Projections by Product Type, 2022-2032
Figure 13: Global Glutaraldehyde Market Value (US$ Mn) Analysis by Application, 2017-2032
Figure 14: Global Glutaraldehyde Market Volume (Tons) Analysis by Application, 2017-2032
Figure 15: Global Glutaraldehyde Market Value Share (%) and BPS Analysis by Application, 2022-2032
Figure 16: Global Glutaraldehyde Market Y-o-Y Growth (%) Projections by Application, 2022-2032
Figure 17: Global Glutaraldehyde Market Value (US$ Mn) Analysis by End-Use, 2017-2032
Figure 18: Global Glutaraldehyde Market Volume (Tons) Analysis by End-Use, 2017-2032
Figure 19: Global Glutaraldehyde Market Value Share (%) and BPS Analysis by End-Use, 2022-2032
Figure 20: Global Glutaraldehyde Market Y-o-Y Growth (%) Projections by End-Use, 2022-2032
Figure 21: Global Glutaraldehyde Market Attractiveness by Product Type, 2022-2032
Figure 22: Global Glutaraldehyde Market Attractiveness by Application, 2022-2032
Figure 23: Global Glutaraldehyde Market Attractiveness by End-Use, 2022-2032
Figure 24: Global Glutaraldehyde Market Attractiveness by Region, 2022-2032
Figure 25: North America Glutaraldehyde Market Value (US$ Mn) by Product Type, 2022-2032
Figure 26: North America Glutaraldehyde Market Value (US$ Mn) by Application, 2022-2032
Figure 27: North America Glutaraldehyde Market Value (US$ Mn) by End-Use, 2022-2032
Figure 28: North America Glutaraldehyde Market Value (US$ Mn) by Country, 2022-2032
Figure 29: North America Glutaraldehyde Market Value (US$ Mn) Analysis by Country, 2017-2032
Figure 30: North America Glutaraldehyde Market Volume (Tons) Analysis by Country, 2017-2032
Figure 31: North America Glutaraldehyde Market Value Share (%) and BPS Analysis by Country, 2022-2032
Figure 32: North America Glutaraldehyde Market Y-o-Y Growth (%) Projections by Country, 2022-2032
Figure 33: North America Glutaraldehyde Market Value (US$ Mn) Analysis by Product Type, 2017-2032
Figure 34: North America Glutaraldehyde Market Volume (Tons) Analysis by Product Type, 2017-2032
Figure 35: North America Glutaraldehyde Market Value Share (%) and BPS Analysis by Product Type, 2022-2032
Figure 36: North America Glutaraldehyde Market Y-o-Y Growth (%) Projections by Product Type, 2022-2032
Figure 37: North America Glutaraldehyde Market Value (US$ Mn) Analysis by Application, 2017-2032
Figure 38: North America Glutaraldehyde Market Volume (Tons) Analysis by Application, 2017-2032
Figure 39: North America Glutaraldehyde Market Value Share (%) and BPS Analysis by Application, 2022-2032
Figure 40: North America Glutaraldehyde Market Y-o-Y Growth (%) Projections by Application, 2022-2032
Figure 41: North America Glutaraldehyde Market Value (US$ Mn) Analysis by End-Use, 2017-2032
Figure 42: North America Glutaraldehyde Market Volume (Tons) Analysis by End-Use, 2017-2032
Figure 43: North America Glutaraldehyde Market Value Share (%) and BPS Analysis by End-Use, 2022-2032
Figure 44: North America Glutaraldehyde Market Y-o-Y Growth (%) Projections by End-Use, 2022-2032
Figure 45: North America Glutaraldehyde Market Attractiveness by Product Type, 2022-2032
Figure 46: North America Glutaraldehyde Market Attractiveness by Application, 2022-2032
Figure 47: North America Glutaraldehyde Market Attractiveness by End-Use, 2022-2032
Figure 48: North America Glutaraldehyde Market Attractiveness by Country, 2022-2032
Figure 49: Latin America Glutaraldehyde Market Value (US$ Mn) by Product Type, 2022-2032
Figure 50: Latin America Glutaraldehyde Market Value (US$ Mn) by Application, 2022-2032
Figure 51: Latin America Glutaraldehyde Market Value (US$ Mn) by End-Use, 2022-2032
Figure 52: Latin America Glutaraldehyde Market Value (US$ Mn) by Country, 2022-2032
Figure 53: Latin America Glutaraldehyde Market Value (US$ Mn) Analysis by Country, 2017-2032
Figure 54: Latin America Glutaraldehyde Market Volume (Tons) Analysis by Country, 2017-2032
Figure 55: Latin America Glutaraldehyde Market Value Share (%) and BPS Analysis by Country, 2022-2032
Figure 56: Latin America Glutaraldehyde Market Y-o-Y Growth (%) Projections by Country, 2022-2032
Figure 57: Latin America Glutaraldehyde Market Value (US$ Mn) Analysis by Product Type, 2017-2032
Figure 58: Latin America Glutaraldehyde Market Volume (Tons) Analysis by Product Type, 2017-2032
Figure 59: Latin America Glutaraldehyde Market Value Share (%) and BPS Analysis by Product Type, 2022-2032
Figure 60: Latin America Glutaraldehyde Market Y-o-Y Growth (%) Projections by Product Type, 2022-2032
Figure 61: Latin America Glutaraldehyde Market Value (US$ Mn) Analysis by Application, 2017-2032
Figure 62: Latin America Glutaraldehyde Market Volume (Tons) Analysis by Application, 2017-2032
Figure 63: Latin America Glutaraldehyde Market Value Share (%) and BPS Analysis by Application, 2022-2032
Figure 64: Latin America Glutaraldehyde Market Y-o-Y Growth (%) Projections by Application, 2022-2032
Figure 65: Latin America Glutaraldehyde Market Value (US$ Mn) Analysis by End-Use, 2017-2032
Figure 66: Latin America Glutaraldehyde Market Volume (Tons) Analysis by End-Use, 2017-2032
Figure 67: Latin America Glutaraldehyde Market Value Share (%) and BPS Analysis by End-Use, 2022-2032
Figure 68: Latin America Glutaraldehyde Market Y-o-Y Growth (%) Projections by End-Use, 2022-2032
Figure 69: Latin America Glutaraldehyde Market Attractiveness by Product Type, 2022-2032
Figure 70: Latin America Glutaraldehyde Market Attractiveness by Application, 2022-2032
Figure 71: Latin America Glutaraldehyde Market Attractiveness by End-Use, 2022-2032
Figure 72: Latin America Glutaraldehyde Market Attractiveness by Country, 2022-2032
Figure 73: Europe Glutaraldehyde Market Value (US$ Mn) by Product Type, 2022-2032
Figure 74: Europe Glutaraldehyde Market Value (US$ Mn) by Application, 2022-2032
Figure 75: Europe Glutaraldehyde Market Value (US$ Mn) by End-Use, 2022-2032
Figure 76: Europe Glutaraldehyde Market Value (US$ Mn) by Country, 2022-2032
Figure 77: Europe Glutaraldehyde Market Value (US$ Mn) Analysis by Country, 2017-2032
Figure 78: Europe Glutaraldehyde Market Volume (Tons) Analysis by Country, 2017-2032
Figure 79: Europe Glutaraldehyde Market Value Share (%) and BPS Analysis by Country, 2022-2032
Figure 80: Europe Glutaraldehyde Market Y-o-Y Growth (%) Projections by Country, 2022-2032
Figure 81: Europe Glutaraldehyde Market Value (US$ Mn) Analysis by Product Type, 2017-2032
Figure 82: Europe Glutaraldehyde Market Volume (Tons) Analysis by Product Type, 2017-2032
Figure 83: Europe Glutaraldehyde Market Value Share (%) and BPS Analysis by Product Type, 2022-2032
Figure 84: Europe Glutaraldehyde Market Y-o-Y Growth (%) Projections by Product Type, 2022-2032
Figure 85: Europe Glutaraldehyde Market Value (US$ Mn) Analysis by Application, 2017-2032
Figure 86: Europe Glutaraldehyde Market Volume (Tons) Analysis by Application, 2017-2032
Figure 87: Europe Glutaraldehyde Market Value Share (%) and BPS Analysis by Application, 2022-2032
Figure 88: Europe Glutaraldehyde Market Y-o-Y Growth (%) Projections by Application, 2022-2032
Figure 89: Europe Glutaraldehyde Market Value (US$ Mn) Analysis by End-Use, 2017-2032
Figure 90: Europe Glutaraldehyde Market Volume (Tons) Analysis by End-Use, 2017-2032
Figure 91: Europe Glutaraldehyde Market Value Share (%) and BPS Analysis by End-Use, 2022-2032
Figure 92: Europe Glutaraldehyde Market Y-o-Y Growth (%) Projections by End-Use, 2022-2032
Figure 93: Europe Glutaraldehyde Market Attractiveness by Product Type, 2022-2032
Figure 94: Europe Glutaraldehyde Market Attractiveness by Application, 2022-2032
Figure 95: Europe Glutaraldehyde Market Attractiveness by End-Use, 2022-2032
Figure 96: Europe Glutaraldehyde Market Attractiveness by Country, 2022-2032
Figure 97: East Asia Glutaraldehyde Market Value (US$ Mn) by Product Type, 2022-2032
Figure 98: East Asia Glutaraldehyde Market Value (US$ Mn) by Application, 2022-2032
Figure 99: East Asia Glutaraldehyde Market Value (US$ Mn) by End-Use, 2022-2032
Figure 100: East Asia Glutaraldehyde Market Value (US$ Mn) by Country, 2022-2032
Figure 101: East Asia Glutaraldehyde Market Value (US$ Mn) Analysis by Country, 2017-2032
Figure 102: East Asia Glutaraldehyde Market Volume (Tons) Analysis by Country, 2017-2032
Figure 103: East Asia Glutaraldehyde Market Value Share (%) and BPS Analysis by Country, 2022-2032
Figure 104: East Asia Glutaraldehyde Market Y-o-Y Growth (%) Projections by Country, 2022-2032
Figure 105: East Asia Glutaraldehyde Market Value (US$ Mn) Analysis by Product Type, 2017-2032
Figure 106: East Asia Glutaraldehyde Market Volume (Tons) Analysis by Product Type, 2017-2032
Figure 107: East Asia Glutaraldehyde Market Value Share (%) and BPS Analysis by Product Type, 2022-2032
Figure 108: East Asia Glutaraldehyde Market Y-o-Y Growth (%) Projections by Product Type, 2022-2032
Figure 109: East Asia Glutaraldehyde Market Value (US$ Mn) Analysis by Application, 2017-2032
Figure 110: East Asia Glutaraldehyde Market Volume (Tons) Analysis by Application, 2017-2032
Figure 111: East Asia Glutaraldehyde Market Value Share (%) and BPS Analysis by Application, 2022-2032
Figure 112: East Asia Glutaraldehyde Market Y-o-Y Growth (%) Projections by Application, 2022-2032
Figure 113: East Asia Glutaraldehyde Market Value (US$ Mn) Analysis by End-Use, 2017-2032
Figure 114: East Asia Glutaraldehyde Market Volume (Tons) Analysis by End-Use, 2017-2032
Figure 115: East Asia Glutaraldehyde Market Value Share (%) and BPS Analysis by End-Use, 2022-2032
Figure 116: East Asia Glutaraldehyde Market Y-o-Y Growth (%) Projections by End-Use, 2022-2032
Figure 117: East Asia Glutaraldehyde Market Attractiveness by Product Type, 2022-2032
Figure 118: East Asia Glutaraldehyde Market Attractiveness by Application, 2022-2032
Figure 119: East Asia Glutaraldehyde Market Attractiveness by End-Use, 2022-2032
Figure 120: East Asia Glutaraldehyde Market Attractiveness by Country, 2022-2032
Figure 121: South Asia & Pacific Glutaraldehyde Market Value (US$ Mn) by Product Type, 2022-2032
Figure 122: South Asia & Pacific Glutaraldehyde Market Value (US$ Mn) by Application, 2022-2032
Figure 123: South Asia & Pacific Glutaraldehyde Market Value (US$ Mn) by End-Use, 2022-2032
Figure 124: South Asia & Pacific Glutaraldehyde Market Value (US$ Mn) by Country, 2022-2032
Figure 125: South Asia & Pacific Glutaraldehyde Market Value (US$ Mn) Analysis by Country, 2017-2032
Figure 126: South Asia & Pacific Glutaraldehyde Market Volume (Tons) Analysis by Country, 2017-2032
Figure 127: South Asia & Pacific Glutaraldehyde Market Value Share (%) and BPS Analysis by Country, 2022-2032
Figure 128: South Asia & Pacific Glutaraldehyde Market Y-o-Y Growth (%) Projections by Country, 2022-2032
Figure 129: South Asia & Pacific Glutaraldehyde Market Value (US$ Mn) Analysis by Product Type, 2017-2032
Figure 130: South Asia & Pacific Glutaraldehyde Market Volume (Tons) Analysis by Product Type, 2017-2032
Figure 131: South Asia & Pacific Glutaraldehyde Market Value Share (%) and BPS Analysis by Product Type, 2022-2032
Figure 132: South Asia & Pacific Glutaraldehyde Market Y-o-Y Growth (%) Projections by Product Type, 2022-2032
Figure 133: South Asia & Pacific Glutaraldehyde Market Value (US$ Mn) Analysis by Application, 2017-2032
Figure 134: South Asia & Pacific Glutaraldehyde Market Volume (Tons) Analysis by Application, 2017-2032
Figure 135: South Asia & Pacific Glutaraldehyde Market Value Share (%) and BPS Analysis by Application, 2022-2032
Figure 136: South Asia & Pacific Glutaraldehyde Market Y-o-Y Growth (%) Projections by Application, 2022-2032
Figure 137: South Asia & Pacific Glutaraldehyde Market Value (US$ Mn) Analysis by End-Use, 2017-2032
Figure 138: South Asia & Pacific Glutaraldehyde Market Volume (Tons) Analysis by End-Use, 2017-2032
Figure 139: South Asia & Pacific Glutaraldehyde Market Value Share (%) and BPS Analysis by End-Use, 2022-2032
Figure 140: South Asia & Pacific Glutaraldehyde Market Y-o-Y Growth (%) Projections by End-Use, 2022-2032
Figure 141: South Asia & Pacific Glutaraldehyde Market Attractiveness by Product Type, 2022-2032
Figure 142: South Asia & Pacific Glutaraldehyde Market Attractiveness by Application, 2022-2032
Figure 143: South Asia & Pacific Glutaraldehyde Market Attractiveness by End-Use, 2022-2032
Figure 144: South Asia & Pacific Glutaraldehyde Market Attractiveness by Country, 2022-2032
Figure 145: MEA Glutaraldehyde Market Value (US$ Mn) by Product Type, 2022-2032
Figure 146: MEA Glutaraldehyde Market Value (US$ Mn) by Application, 2022-2032
Figure 147: MEA Glutaraldehyde Market Value (US$ Mn) by End-Use, 2022-2032
Figure 148: MEA Glutaraldehyde Market Value (US$ Mn) by Country, 2022-2032
Figure 149: MEA Glutaraldehyde Market Value (US$ Mn) Analysis by Country, 2017-2032
Figure 150: MEA Glutaraldehyde Market Volume (Tons) Analysis by Country, 2017-2032
Figure 151: MEA Glutaraldehyde Market Value Share (%) and BPS Analysis by Country, 2022-2032
Figure 152: MEA Glutaraldehyde Market Y-o-Y Growth (%) Projections by Country, 2022-2032
Figure 153: MEA Glutaraldehyde Market Value (US$ Mn) Analysis by Product Type, 2017-2032
Figure 154: MEA Glutaraldehyde Market Volume (Tons) Analysis by Product Type, 2017-2032
Figure 155: MEA Glutaraldehyde Market Value Share (%) and BPS Analysis by Product Type, 2022-2032
Figure 156: MEA Glutaraldehyde Market Y-o-Y Growth (%) Projections by Product Type, 2022-2032
Figure 157: MEA Glutaraldehyde Market Value (US$ Mn) Analysis by Application, 2017-2032
Figure 158: MEA Glutaraldehyde Market Volume (Tons) Analysis by Application, 2017-2032
Figure 159: MEA Glutaraldehyde Market Value Share (%) and BPS Analysis by Application, 2022-2032
Figure 160: MEA Glutaraldehyde Market Y-o-Y Growth (%) Projections by Application, 2022-2032
Figure 161: MEA Glutaraldehyde Market Value (US$ Mn) Analysis by End-Use, 2017-2032
Figure 162: MEA Glutaraldehyde Market Volume (Tons) Analysis by End-Use, 2017-2032
Figure 163: MEA Glutaraldehyde Market Value Share (%) and BPS Analysis by End-Use, 2022-2032
Figure 164: MEA Glutaraldehyde Market Y-o-Y Growth (%) Projections by End-Use, 2022-2032
Figure 165: MEA Glutaraldehyde Market Attractiveness by Product Type, 2022-2032
Figure 166: MEA Glutaraldehyde Market Attractiveness by Application, 2022-2032
Figure 167: MEA Glutaraldehyde Market Attractiveness by End-Use, 2022-2032
Figure 168: MEA Glutaraldehyde Market Attractiveness by Country, 2022-2032


Full Research Suite comprises of:
Market outlook & trends analysis
Interviews & case studies
Strategic recommendations
Vendor profiles & capabilities analysis
5-year forecasts
8 regions and 60+ country-level data splits
Market segment data splits
12 months of continuous data updates
DELIVERED AS:
PDF EXCEL ONLINE

Thank you!
You will receive an email from our Business Development Manager. Please be sure to check your SPAM/JUNK folder too.
Chat With
MaRIA