Graphite Market Size and Share Forecast Outlook 2025 to 2035

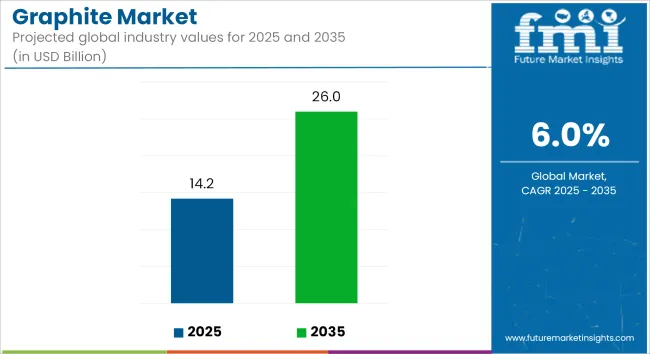
The global graphite market is estimated to report a value of USD 14.2 billion in 2025 and further reach USD 26 billion by 2035, achieving a CAGR of 6.0% during the forecast period. Graphite demand is increasingly being shaped by its role in electric vehicle batteries and energy storage systems, as well as longstanding industrial uses such as lubricants and refractories.
Quick Stats for Graphite Market

  • Industry Value (2025): USD 14.2 billion
  • Forecast Value (2035): USD 26.0 billion
  • Forecast CAGR: 6.0%
  • Leading Segment in 2025: Medium Purity Graphite (43% share)
  • Key Growth Region: North America and Brazil (due to synthetic and natural battery-grade graphite capacity expansion)
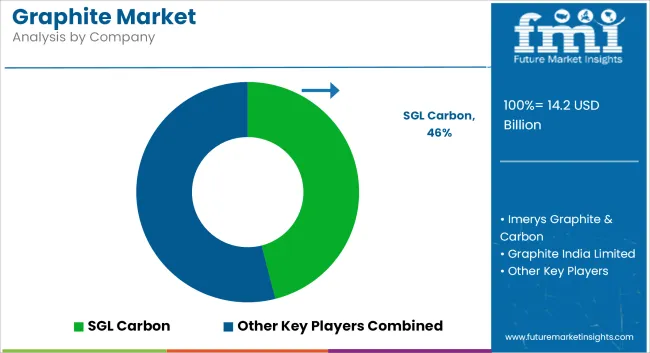
  • Top Key Players: SGL Carbon, Imerys Graphite & Carbon, Graphite India, Syrah Resources, Northern Graphite, Titan Mining, Graphcoa

Recent strategic investments have targeted synthetic graphite capacity in North America. In early 2025, Vianode secured a USD 300 million loan guarantee from Germany’s Euler Hermes to support construction of a North American synthetic graphite plant targeting 70,000 tpa output by 2027. The guarantee was described in a company statement as “an important step in establishing overall funding, which will provide local supply of anode graphite.” This marks the first major project aimed at reducing dependency on Asia, where more than 95% of battery‑grade graphite production is currently concentrated.

In the same year, NOVONIX announced a second synthetic graphite plant in Chattanooga, Tennessee, planned to support a capacity of 31,500 tpa by 2028. NOVONIX confirmed that construction is being supported by a conditional USD 754.8 million Department of Energy loan guarantee. CEO Chris Burns was quoted as saying, “We are thrilled to be announcing this next step in our further expansion in Chattanooga.”

Commercial partnerships have reinforced this shift. In January 2025, General Motors signed a multi‑year supply agreement with Vianode for synthetic graphite beginning in 2027. GM Senior Vice President Jeff Morrison was quoted in the agreement announcement stating that it will “advance our battery technology and drive greater value to our customers.”

These developments signal growing momentum in the graphite sector. Investments in synthetic graphite are being aligned with EV battery demand. Government-backed financing is being used to support domestic supply chain resilience. Off-take agreements with automakers are being finalized to secure feedstock for large-scale battery production. Technological progress is being focused on ensuring purer and more consistent graphite output.

Over the next decade, growth in graphite consumption is being driven by continued industrial demand in steel, refractories, and lubricants, and accelerating uptake of battery-grade material. Ongoing plant expansions, financing commitments, and supply agreements demonstrate that the graphite market is being positioned to support clean energy transitions and industrial modernization.

Analyzing Graphite Market by Top Investing Segments

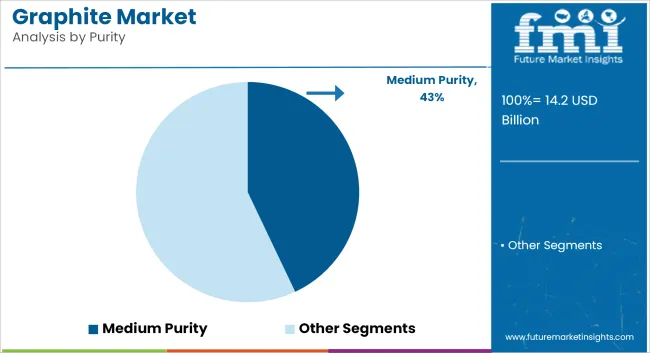
Medium purity graphite is projected to lead product-level demand, supported by stable consumption in refractories, lubricants, and structural applications.

Medium purity graphite is estimated to account for approximately 43% of the global graphite market share in 2025 and is projected to grow at a CAGR of 5.5% through 2035. This grade, typically containing carbon content between 85% and 95%, is widely used in steelmaking, foundries, brake linings, and thermal management products due to its balance between cost and performance. Demand remains strong across Asia-Pacific and the Middle East, where infrastructure growth and industrial activity are driving refractories and casting operations.

Manufacturers are focusing on process consistency, particle size control, and customized blending to meet specifications across metallurgy, lubricants, and battery casings. As industries seek thermally conductive and chemically stable materials at scale, medium-purity graphite continues to offer a commercially viable solution.
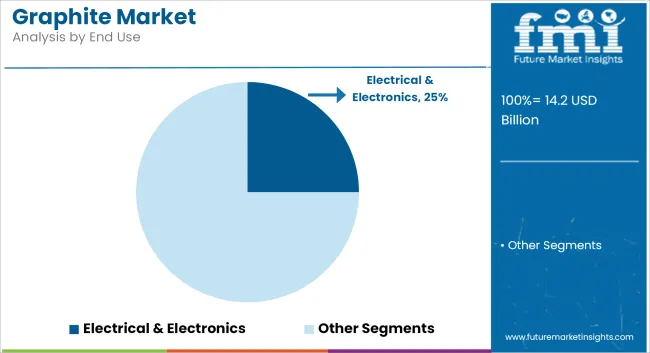
The electrical and electronics sector is expected to lead end-use demand with the increasing use of graphite in heat sinks, electrodes, and energy storage systems.

The electrical and electronics segment is projected to hold approximately 25% of the global graphite market share in 2025 and is expected to grow at a CAGR of 4.9% through 2035. Graphite is extensively used in conductive pastes, semiconductors, batteries, and thermal interface materials due to its high electrical conductivity and thermal dissipation capabilities. Synthetic graphite, particularly in anode materials for lithium-ion batteries and fuel cells, continues to see growing adoption in consumer electronics and electric vehicle components.

The shift toward 5G infrastructure, miniaturization of devices, and electrification of mobility is creating a sustained need for high-performance graphite solutions. With manufacturers seeking scalable and cost-efficient alternatives to metal-based components, graphite's role in power electronics, energy conversion, and circuit protection remains foundational to the sector’s growth.
Challenges

Supply Chain Disruptions and Dependence on China

The major obstacle faced by the graphite market is the global supply chain dependency on China. Most countries are still investing in local graphite production, while China by far remains the biggest supplier, and thus holds a large part of the market share.

The shortage of raw materials, geopolitical tensions, and recent regulations on cheap graphite products coming from China can directly impact the global supply chain and thus can create price instability. Furthermore, a reliable supply of high-purity graphite for advanced applications continues to be an important issue for producers across manufacturers globally. In an effort to diminish the exposure, firms are undertaking such measures as freshwater mining initiatives, standalone synthetic graphite, or sub process graphite recycling.

High Processing Costs for Battery-Grade Graphite

The cost of processing and purifying natural graphite for battery-making processes is quite high as it includes the use of complicated and costly thermal and chemical purification methods. Moving towards environmentally friendly processing methods, and when adhering to such strict purity norms for EV battery manufacture, overall production costs are further increased.

Moreover, making synthetic anode graphite energy-efficient is an expensive process and raises environmental issues as well. The only way to overcome these issues is through developing more cost-efficient processing technologies and creating structured synthetic graphite along with effective disability recycling.

Opportunities

Expanding Demand for Graphite in Lithium-Ion Battery Production

The surge in sales of electric vehicles (EVs) worldwide brings with it the inevitable climb in demand for high-purity graphite for lithium-ion battery anodes. Governments across the globe are backing local battery manufacturing, promoting decentralized energy storage, and supporting a higher share of renewables in the energy mix; all these measures create an enormous potential market for graphite manufacturers. At the same time, solid-state battery technologies and hybrid systems mandate a special line of R&D in the form of high-performance graphite for storage application.

Technological Advancements in Graphene and Composite Materials

The advent of graphene-based materials is making a significant impact in a range of industries such as electronics, aerospace, and advanced composites. Notably, graphene provides not only low weight and high conductivity but also thermal stability, which creates a key material for high-performance applications like wearable electronics, supercapacitors, and flexible displays. As graphene manufacturing becomes more scalable and cost-effective, its adoption in thermal management solutions, sensors, and high-strength coatings is expected to expand, opening new revenue streams for graphite producers.
Country-wise Insights

United States

The United States graphite market is in an active stage of development, primarily driven by the high demand from electric vehicle (EV) battery production, the growth in energy storage solutions, and also the expansion of aerospace and defense industries with more and more applications.

The Inflation Reduction Act (IRA) and federal incentives for local battery production are thereby leading to an increase in investments in the production of both natural and synthetic graphite, thus supporting the country's strategic initiative to achieve independence from foreign veins in the EV supply chain.

With the intense growth of lithium-ion batteries, its demand for graphite is growing due to its primary anode material use which is critical. Moreover, the transformation in the format of carbon in the aerospace sector is highly responsible for the high-purity graphite materials demand. The implementation of nuclear energy and fuel cell technologies is also achieving the target of top-grade graphite for high-performance thermal management and structural applications.

  • Domestic Electric Vehicle Battery Production Expansion & Federal Incentives: More demand for natural and synthetic graphite in lithium-ion batteries.
  • Miscellaneous High-Purity Graphite Uses in Aerospace & Defense: Displace the growth in lightweight, carbon-heat-resistant composites.
  • Fuel Cells Development & Atmospheric Energy Storage Options: Increased adoption of graphite in energy storage.
  • Government Policies Support Critical Minerals Independence: Investments in the domestic processing and mining of the graphite.
  • Use of Graphite in the Field of Nuclear Energy Grows: Less amount of non-reusable resources is lost to waste due to the increase of nuclear reactor parts and heat-resistant coatings.
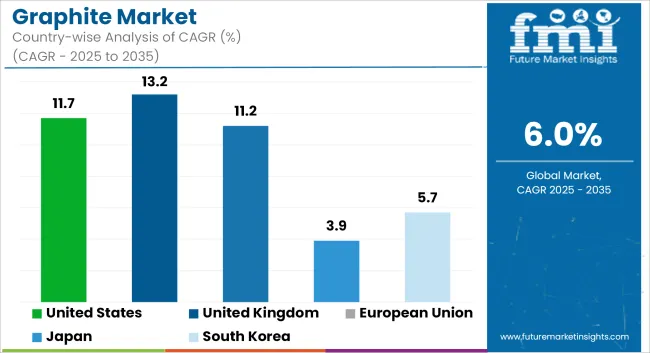
Country CAGR (2025 to 2035)
United States 11.7%

United Kingdom

The United Kingdom graphite market is soaring due to the rise of EV battery manufacturing, increasing use of environmentally friendly technologies, and a robust quest for high-performance graphite in the various industrial sectors. The UK's commitment to achieving net-zero emissions by 2050 has led to a surge in investments in battery materials and alternative energy storage solutions that are responsible for higher demand for graphite anodes in EV batteries.

At the same time, cutting-edge companies, such as semiconductor manufacturers, the aerospace industry, and 3D printing, are elevating their use of high-purity graphite, for instance, in thermal management and structural applications. The advancement of the hydrogen fuel cell technology sector is equally a factor that causes the increasing consumption of graphite in the parts of the fuel cells.

With an emphasis on sustainability and security of critical minerals, the UK is turning into a country with domestic graphite refining and synthetic graphite production, which will eliminate the reliance on foreign imports.

  • Increasing outlay for NEV battery production and developing of the supply chain that is needed: More demand for graphite anodes in lithium-ion batteries.
  • Success of Hydrogen Fuel Cells Technology and Storing Energy: Use of more graphite bipolar plates in fuel cells.
  • Expansion of Aerospace and Semiconductor Sectors: Adoption of a greater quantity of high-purity graphite in thermally and structurally
  • UK Government push towards sustainable and circular economy solutions: Rise in recycling and synthetic graphite manufacturing.
  • Government support for the critical mineral security and graphite independence: Increased focus on domestic refining and supply chain development.
Country CAGR (2025 to 2035)
United Kingdom 13.2%

European Union

The European Union graphite market experiences a steady growth trajectory, fueled by the enormous demand surge from the electric vehicle (EV) segment, the transition to green energy, and the increasing need for essential materials in high-tech industries. The EU’s Critical Raw Materials Act, by promoting domestic investment in graphite sourcing and refining, is cutting the reliance on Chinese imports.

The need for battery-grade graphite is soaring predominantly in Germany, France, and Sweden, where gigafactories are built amid the fierce EV transition across Europe. Wind and solar power storage are also the supportive factors of graphite demand in next-generation energy storage technology applications. Aerospace, metallurgy, and additive manufacturing as well, are observing the use of high-purity graphite in heat-resistant and structural applications, which adds significantly to the market development.

  • EU Critical Raw Materials Act Drives Domestic Graphite Sourcing and Refining: European graphite mines and processing plants see increased investments.
  • Increase in Gigafactories& EV Battery Production: Greater need for graphite anodes used in lithium-ion batteries production.
  • Green Energy Storage & Hydrogen Fuel Cell Technologies are on the rise: Energy storage systems and fuel cells will have a more significant proportion of graphite in their constructions.
  • Aerospace & High-Tech Industries are Drivers for Development of High-Purity Graphite: Industrial applications witness more and more use of graphite composites.
  • Government Support for Environmental and Circular Economy Policy Solutions: There is a growing trend in investment in the recycling and synthetic graphite production sector.
Country CAGR (2025 to 2035)
European Union 11.2%

Japan

The developing graphite market in Japan is characterized by a moderate growth pace which is a result of the advancements in battery technologies, semiconductor applications, and fuel cell manufacturing. The extremely advanced EV and hybrid vehicle business in Japan is the one that causes the increase of demand for battery-grade graphite as lithium-ion anodes.

The semiconductor sector, which has made Japan the leading country, is the one that increases the use of high-purity graphite in thermal management solutions, such as graphene heat spreaders in electronic devices. The rise of hydrogen fuel cells vehicles (FCVs) additionally assists to increasing the need for graphite for bipolar plates and electrode applications.

The transformation of the energy source from conventional to advanced nuclear, and the added demand from high-temperature industrial processes is responsible for further utilization of specialty graphite materials.

  • The Battery Industry of EV & Hybrid of Japan is growing: More anodes of graphite ion batteries.
  • The strong semiconductor industry, which is responsible for high-purity graphite applications: The use in heat dissipation and electronic shielding is increased.
  • The development of hydrogen fuel cell vehicles: The components based on graphite are more and more asked for.
  • The material adopted for high-temperature industrial uses and nuclear-grade is graphite: The nuclear reactor parts and heat-resistant structures have more usage.
  • The synthetic and recycled graphite manufacturing got technological advancement: There has been a growth in domestic refining and processing capacity.
Country CAGR (2025 to 2035)
Japan 3.9%

South Korea

The South Korea graphite market is being pushed by the climbing EV battery production, the advanced electronics manufacturing, and the investments in the clean energy technologies. Apart from being the lithium-ion battery manufacturer, the South Korea has a role of high demand for battery-grade graphite thanks to the main companies: LG Energy Solution and Samsung SDI.

Simultaneously with the South Korea investment in hydrogen fuel cell infrastructure, the graphite used in fuel cell stacks is also increasing. The country dominance in the semiconductor industry is the reason behind the demand for ultra-high-purity graphite components, which are used in chip fabrication and thermal management solutions. A surge in green manufacturing and energy efficiency programs is facilitating the move towards the use of synthetic and low-carbon graphite products.

  • Growth in EV Battery Production by the Leading South Korean Companies: Adoption of graphite anodes in lithium-ion batteries has been greatly benefiting.
  • Development of Semiconductor Manufacturing & Thermal Management Solutions: The use of high-purity graphite in chip fabrication has increased.
  • Funding in Hydrogen Fuel Cell Infrastructure & Clean Energy: The graphitic materials are the fuel cell components that will sharply raise.
  • Progress on Green & Recycled Graphite Processing: More attention is being directed to the refining processes that prioritize environmental-friendliness.
  • Acquisition of High-Performance Graphite for Aerospace & Industrial Applications: More regular use in thermal-resists coatings and advanced composites.
Country CAGR (2025 to 2035)
South Korea 5.7%

Competitive Outlook

The graphite market is experiencing increased competition as industries invest in localizing production and expanding capacity to meet the rising demand for battery-grade materials, driven by the shift toward electric vehicles (EVs) and energy storage. Key players are strategically opening processing facilities in regions like North America and Brazil, targeting high-purity natural graphite production for lithium-ion batteries. These investments are aimed at reducing dependency on traditional graphite supply hubs in Asia, aligning with global efforts to secure critical mineral supply chains.
  • In April 2025, Titan Mining Corporation was reported to have launched a processing facility for natural flake graphite production in Upstate New York, marking a strategic entry into U.S.-based critical mineral supply chains. The facility was designed to process locally sourced graphite and produce battery-grade material suitable for use in lithium-ion anodes. It was stated that this initiative supports U.S. efforts to onshore key components of the battery and clean energy industries. The launch was aligned with Titan’s diversification strategy into energy transition materials.
  • In April 2024, Graphcoa was reported to have commissioned a new graphite processing plant in Brazil to expand production capacity for high-purity natural flake graphite. The project was supported by Appian Capital Advisory and was intended to serve battery manufacturers and energy storage developers across the Americas and Europe. It was stated that the plant aligns with Brazil’s growing role in the global energy transition and critical minerals supply chain. The facility was positioned to enhance Graphcoa’s ability to deliver low-impurity graphite for lithium-ion applications.

Companies

  • SGL Carbon
  • Imerys Graphite & Carbon
  • Graphite India Limited
  • AMG
  • Syrah Resources Limited
  • Northern Graphite Corporation
  • Qingdao Tianshengda Graphite Co., Ltd.
  • Lomiko Metals
  • Focus Graphite Inc.
  • Volt Resources

Key Segments

By Product Type:

Natural, Synthetic

By Purity:

High Purity, Medium Purity, Low Purity

By End Use:

Metallurgy, Electrical & Electronics, Automotive & Transportation, Energy Generation, Others

By Application:

Refractories, Lubricant, Foundry Facing, Batteries, Fire Retardant, Others

By Region:

North America, Latin America, Eastern Europe, Western Europe, East Asia, South Asia and Pacific, Middle East and Africa

Table of Content

  1. Executive Summary
  2. Industry Introduction, including Taxonomy and Market Definition
  3. Market Trends and Success Factors, including Macro-economic Factors, Market Dynamics, and Recent Industry Developments
  4. Global Market Demand Analysis 2020 to 2024 and Forecast 2025 to 2035, including Historical Analysis and Future Projections
  5. Pricing Analysis
  6. Global Market Analysis 2020 to 2024 and Forecast 2025 to 2035
    • Product Type
    • Purity
    • End Use
    • Application
  7. Global Market Analysis 2020 to 2024 and Forecast 2025 to 2035, By Product Type
    • Natural
    • Synthetic
    • Emulsion
    • Polymer
  8. Global Market Analysis 2020 to 2024 and Forecast 2025 to 2035, By Purity
    • High Purity
    • Medium Purity
    • Low Purity
    • General Cargo Ships
  9. Global Market Analysis 2020 to 2024 and Forecast 2025 to 2035, By End Use
    • Metallurgy
    • Electrical & Electronics
    • Automotive & Transportation
    • Energy Generation
    • Others
  10. Global Market Analysis 2020 to 2024 and Forecast 2025 to 2035, By Application
    • Refractories
    • Lubricant
    • Foundry Facing
    • Batteries
    • Fire Retardant
    • Others
  11. Global Market Analysis 2020 to 2024 and Forecast 2025 to 2035, By Region
    • North America
    • Latin America
    • Western Europe
    • South Asia
    • East Asia
    • Eastern Europe
    • Middle East & Africa
  12. North America Sales Analysis 2020 to 2024 and Forecast 2025 to 2035, by Key Segments and Countries
  13. Latin America Sales Analysis 2020 to 2024 and Forecast 2025 to 2035, by Key Segments and Countries
  14. Western Europe Sales Analysis 2020 to 2024 and Forecast 2025 to 2035, by Key Segments and Countries
  15. South Asia Sales Analysis 2020 to 2024 and Forecast 2025 to 2035, by Key Segments and Countries
  16. East Asia Sales Analysis 2020 to 2024 and Forecast 2025 to 2035, by Key Segments and Countries
  17. Eastern Europe Sales Analysis 2020 to 2024 and Forecast 2025 to 2035, by Key Segments and Countries
  18. Middle East & Africa Sales Analysis 2020 to 2024 and Forecast 2025 to 2035, by Key Segments and Countries
  19. Sales Forecast 2025 to 2035 by Product Type, Purity, End Use, and Application for 30 Countries
  20. Competition Outlook, including Market Structure Analysis, Company Share Analysis by Key Players, and Competition Dashboard
  21. Company Profile
    • EcoGraf Limited
    • Focus Graphite
    • Graphex Group
    • Hunan Zhongke Shinzoom Co., Ltd.
    • International Ltd
    • Lomiko Metals Inc.
    • Northern Corporation
    • Nouveau Monde Graphite
    • Qingdao Tianshengda Co., Ltd.
    • Triton Minerals Limited

List of Tables

  • Table 1: Global Market Value (USD Million) Forecast by Region, 2020 to 2035
  • Table 2: Global Market Volume (Tons) Forecast by Region, 2020 to 2035
  • Table 3: Global Market Value (USD Million) Forecast by Product Type, 2020 to 2035
  • Table 4: Global Market Volume (Tons) Forecast by Product Type, 2020 to 2035
  • Table 5: Global Market Value (USD Million) Forecast by Application, 2020 to 2035
  • Table 6: Global Market Volume (Tons) Forecast by Application, 2020 to 2035
  • Table 7: North America Market Value (USD Million) Forecast by Country, 2020 to 2035
  • Table 8: North America Market Volume (Tons) Forecast by Country, 2020 to 2035
  • Table 9: North America Market Value (USD Million) Forecast by Product Type, 2020 to 2035
  • Table 10: North America Market Volume (Tons) Forecast by Product Type, 2020 to 2035
  • Table 11: North America Market Value (USD Million) Forecast by Application, 2020 to 2035
  • Table 12: North America Market Volume (Tons) Forecast by Application, 2020 to 2035
  • Table 13: Latin America Market Value (USD Million) Forecast by Country, 2020 to 2035
  • Table 14: Latin America Market Volume (Tons) Forecast by Country, 2020 to 2035
  • Table 15: Latin America Market Value (USD Million) Forecast by Product Type, 2020 to 2035
  • Table 16: Latin America Market Volume (Tons) Forecast by Product Type, 2020 to 2035
  • Table 17: Latin America Market Value (USD Million) Forecast by Application, 2020 to 2035
  • Table 18: Latin America Market Volume (Tons) Forecast by Application, 2020 to 2035
  • Table 19: Western Europe Market Value (USD Million) Forecast by Country, 2020 to 2035
  • Table 20: Western Europe Market Volume (Tons) Forecast by Country, 2020 to 2035
  • Table 21: Western Europe Market Value (USD Million) Forecast by Product Type, 2020 to 2035
  • Table 22: Western Europe Market Volume (Tons) Forecast by Product Type, 2020 to 2035
  • Table 23: Western Europe Market Value (USD Million) Forecast by Application, 2020 to 2035
  • Table 24: Western Europe Market Volume (Tons) Forecast by Application, 2020 to 2035
  • Table 25: Eastern Europe Market Value (USD Million) Forecast by Country, 2020 to 2035
  • Table 26: Eastern Europe Market Volume (Tons) Forecast by Country, 2020 to 2035
  • Table 27: Eastern Europe Market Value (USD Million) Forecast by Product Type, 2020 to 2035
  • Table 28: Eastern Europe Market Volume (Tons) Forecast by Product Type, 2020 to 2035
  • Table 29: Eastern Europe Market Value (USD Million) Forecast by Application, 2020 to 2035
  • Table 30: Eastern Europe Market Volume (Tons) Forecast by Application, 2020 to 2035
  • Table 31: South Asia and Pacific Market Value (USD Million) Forecast by Country, 2020 to 2035
  • Table 32: South Asia and Pacific Market Volume (Tons) Forecast by Country, 2020 to 2035
  • Table 33: South Asia and Pacific Market Value (USD Million) Forecast by Product Type, 2020 to 2035
  • Table 34: South Asia and Pacific Market Volume (Tons) Forecast by Product Type, 2020 to 2035
  • Table 35: South Asia and Pacific Market Value (USD Million) Forecast by Application, 2020 to 2035
  • Table 36: South Asia and Pacific Market Volume (Tons) Forecast by Application, 2020 to 2035
  • Table 37: East Asia Market Value (USD Million) Forecast by Country, 2020 to 2035
  • Table 38: East Asia Market Volume (Tons) Forecast by Country, 2020 to 2035
  • Table 39: East Asia Market Value (USD Million) Forecast by Product Type, 2020 to 2035
  • Table 40: East Asia Market Volume (Tons) Forecast by Product Type, 2020 to 2035
  • Table 41: East Asia Market Value (USD Million) Forecast by Application, 2020 to 2035
  • Table 42: East Asia Market Volume (Tons) Forecast by Application, 2020 to 2035
  • Table 43: Middle East and Africa Market Value (USD Million) Forecast by Country, 2020 to 2035
  • Table 44: Middle East and Africa Market Volume (Tons) Forecast by Country, 2020 to 2035
  • Table 45: Middle East and Africa Market Value (USD Million) Forecast by Product Type, 2020 to 2035
  • Table 46: Middle East and Africa Market Volume (Tons) Forecast by Product Type, 2020 to 2035
  • Table 47: Middle East and Africa Market Value (USD Million) Forecast by Application, 2020 to 2035
  • Table 48: Middle East and Africa Market Volume (Tons) Forecast by Application, 2020 to 2035

List of Figures

  • Figure 1: Global Market Value (USD Million) by Product Type, 2025 to 2035
  • Figure 2: Global Market Value (USD Million) by Application, 2025 to 2035
  • Figure 3: Global Market Value (USD Million) by Region, 2025 to 2035
  • Figure 4: Global Market Value (USD Million) Analysis by Region, 2020 to 2035
  • Figure 5: Global Market Volume (Tons) Analysis by Region, 2020 to 2035
  • Figure 6: Global Market Value Share (%) and BPS Analysis by Region, 2025 to 2035
  • Figure 7: Global Market Y-o-Y Growth (%) Projections by Region, 2025 to 2035
  • Figure 8: Global Market Value (USD Million) Analysis by Product Type, 2020 to 2035
  • Figure 9: Global Market Volume (Tons) Analysis by Product Type, 2020 to 2035
  • Figure 10: Global Market Value Share (%) and BPS Analysis by Product Type, 2025 to 2035
  • Figure 11: Global Market Y-o-Y Growth (%) Projections by Product Type, 2025 to 2035
  • Figure 12: Global Market Value (USD Million) Analysis by Application, 2020 to 2035
  • Figure 13: Global Market Volume (Tons) Analysis by Application, 2020 to 2035
  • Figure 14: Global Market Value Share (%) and BPS Analysis by Application, 2025 to 2035
  • Figure 15: Global Market Y-o-Y Growth (%) Projections by Application, 2025 to 2035
  • Figure 16: Global Market Attractiveness by Product Type, 2025 to 2035
  • Figure 17: Global Market Attractiveness by Application, 2025 to 2035
  • Figure 18: Global Market Attractiveness by Region, 2025 to 2035
  • Figure 19: North America Market Value (USD Million) by Product Type, 2025 to 2035
  • Figure 20: North America Market Value (USD Million) by Application, 2025 to 2035
  • Figure 21: North America Market Value (USD Million) by Country, 2025 to 2035
  • Figure 22: North America Market Value (USD Million) Analysis by Country, 2020 to 2035
  • Figure 23: North America Market Volume (Tons) Analysis by Country, 2020 to 2035
  • Figure 24: North America Market Value Share (%) and BPS Analysis by Country, 2025 to 2035
  • Figure 25: North America Market Y-o-Y Growth (%) Projections by Country, 2025 to 2035
  • Figure 26: North America Market Value (USD Million) Analysis by Product Type, 2020 to 2035
  • Figure 27: North America Market Volume (Tons) Analysis by Product Type, 2020 to 2035
  • Figure 28: North America Market Value Share (%) and BPS Analysis by Product Type, 2025 to 2035
  • Figure 29: North America Market Y-o-Y Growth (%) Projections by Product Type, 2025 to 2035
  • Figure 30: North America Market Value (USD Million) Analysis by Application, 2020 to 2035
  • Figure 31: North America Market Volume (Tons) Analysis by Application, 2020 to 2035
  • Figure 32: North America Market Value Share (%) and BPS Analysis by Application, 2025 to 2035
  • Figure 33: North America Market Y-o-Y Growth (%) Projections by Application, 2025 to 2035
  • Figure 34: North America Market Attractiveness by Product Type, 2025 to 2035
  • Figure 35: North America Market Attractiveness by Application, 2025 to 2035
  • Figure 36: North America Market Attractiveness by Country, 2025 to 2035
  • Figure 37: Latin America Market Value (USD Million) by Product Type, 2025 to 2035
  • Figure 38: Latin America Market Value (USD Million) by Application, 2025 to 2035
  • Figure 39: Latin America Market Value (USD Million) by Country, 2025 to 2035
  • Figure 40: Latin America Market Value (USD Million) Analysis by Country, 2020 to 2035
  • Figure 41: Latin America Market Volume (Tons) Analysis by Country, 2020 to 2035
  • Figure 42: Latin America Market Value Share (%) and BPS Analysis by Country, 2025 to 2035
  • Figure 43: Latin America Market Y-o-Y Growth (%) Projections by Country, 2025 to 2035
  • Figure 44: Latin America Market Value (USD Million) Analysis by Product Type, 2020 to 2035
  • Figure 45: Latin America Market Volume (Tons) Analysis by Product Type, 2020 to 2035
  • Figure 46: Latin America Market Value Share (%) and BPS Analysis by Product Type, 2025 to 2035
  • Figure 47: Latin America Market Y-o-Y Growth (%) Projections by Product Type, 2025 to 2035
  • Figure 48: Latin America Market Value (USD Million) Analysis by Application, 2020 to 2035
  • Figure 49: Latin America Market Volume (Tons) Analysis by Application, 2020 to 2035
  • Figure 50: Latin America Market Value Share (%) and BPS Analysis by Application, 2025 to 2035
  • Figure 51: Latin America Market Y-o-Y Growth (%) Projections by Application, 2025 to 2035
  • Figure 52: Latin America Market Attractiveness by Product Type, 2025 to 2035
  • Figure 53: Latin America Market Attractiveness by Application, 2025 to 2035
  • Figure 54: Latin America Market Attractiveness by Country, 2025 to 2035
  • Figure 55: Western Europe Market Value (USD Million) by Product Type, 2025 to 2035
  • Figure 56: Western Europe Market Value (USD Million) by Application, 2025 to 2035
  • Figure 57: Western Europe Market Value (USD Million) by Country, 2025 to 2035
  • Figure 58: Western Europe Market Value (USD Million) Analysis by Country, 2020 to 2035
  • Figure 59: Western Europe Market Volume (Tons) Analysis by Country, 2020 to 2035
  • Figure 60: Western Europe Market Value Share (%) and BPS Analysis by Country, 2025 to 2035
  • Figure 61: Western Europe Market Y-o-Y Growth (%) Projections by Country, 2025 to 2035
  • Figure 62: Western Europe Market Value (USD Million) Analysis by Product Type, 2020 to 2035
  • Figure 63: Western Europe Market Volume (Tons) Analysis by Product Type, 2020 to 2035
  • Figure 64: Western Europe Market Value Share (%) and BPS Analysis by Product Type, 2025 to 2035
  • Figure 65: Western Europe Market Y-o-Y Growth (%) Projections by Product Type, 2025 to 2035
  • Figure 66: Western Europe Market Value (USD Million) Analysis by Application, 2020 to 2035
  • Figure 67: Western Europe Market Volume (Tons) Analysis by Application, 2020 to 2035
  • Figure 68: Western Europe Market Value Share (%) and BPS Analysis by Application, 2025 to 2035
  • Figure 69: Western Europe Market Y-o-Y Growth (%) Projections by Application, 2025 to 2035
  • Figure 70: Western Europe Market Attractiveness by Product Type, 2025 to 2035
  • Figure 71: Western Europe Market Attractiveness by Application, 2025 to 2035
  • Figure 72: Western Europe Market Attractiveness by Country, 2025 to 2035
  • Figure 73: Eastern Europe Market Value (USD Million) by Product Type, 2025 to 2035
  • Figure 74: Eastern Europe Market Value (USD Million) by Application, 2025 to 2035
  • Figure 75: Eastern Europe Market Value (USD Million) by Country, 2025 to 2035
  • Figure 76: Eastern Europe Market Value (USD Million) Analysis by Country, 2020 to 2035
  • Figure 77: Eastern Europe Market Volume (Tons) Analysis by Country, 2020 to 2035
  • Figure 78: Eastern Europe Market Value Share (%) and BPS Analysis by Country, 2025 to 2035
  • Figure 79: Eastern Europe Market Y-o-Y Growth (%) Projections by Country, 2025 to 2035
  • Figure 80: Eastern Europe Market Value (USD Million) Analysis by Product Type, 2020 to 2035
  • Figure 81: Eastern Europe Market Volume (Tons) Analysis by Product Type, 2020 to 2035
  • Figure 82: Eastern Europe Market Value Share (%) and BPS Analysis by Product Type, 2025 to 2035
  • Figure 83: Eastern Europe Market Y-o-Y Growth (%) Projections by Product Type, 2025 to 2035
  • Figure 84: Eastern Europe Market Value (USD Million) Analysis by Application, 2020 to 2035
  • Figure 85: Eastern Europe Market Volume (Tons) Analysis by Application, 2020 to 2035
  • Figure 86: Eastern Europe Market Value Share (%) and BPS Analysis by Application, 2025 to 2035
  • Figure 87: Eastern Europe Market Y-o-Y Growth (%) Projections by Application, 2025 to 2035
  • Figure 88: Eastern Europe Market Attractiveness by Product Type, 2025 to 2035
  • Figure 89: Eastern Europe Market Attractiveness by Application, 2025 to 2035
  • Figure 90: Eastern Europe Market Attractiveness by Country, 2025 to 2035
  • Figure 91: South Asia and Pacific Market Value (USD Million) by Product Type, 2025 to 2035
  • Figure 92: South Asia and Pacific Market Value (USD Million) by Application, 2025 to 2035
  • Figure 93: South Asia and Pacific Market Value (USD Million) by Country, 2025 to 2035
  • Figure 94: South Asia and Pacific Market Value (USD Million) Analysis by Country, 2020 to 2035
  • Figure 95: South Asia and Pacific Market Volume (Tons) Analysis by Country, 2020 to 2035
  • Figure 96: South Asia and Pacific Market Value Share (%) and BPS Analysis by Country, 2025 to 2035
  • Figure 97: South Asia and Pacific Market Y-o-Y Growth (%) Projections by Country, 2025 to 2035
  • Figure 98: South Asia and Pacific Market Value (USD Million) Analysis by Product Type, 2020 to 2035
  • Figure 99: South Asia and Pacific Market Volume (Tons) Analysis by Product Type, 2020 to 2035
  • Figure 100: South Asia and Pacific Market Value Share (%) and BPS Analysis by Product Type, 2025 to 2035
  • Figure 101: South Asia and Pacific Market Y-o-Y Growth (%) Projections by Product Type, 2025 to 2035
  • Figure 102: South Asia and Pacific Market Value (USD Million) Analysis by Application, 2020 to 2035
  • Figure 103: South Asia and Pacific Market Volume (Tons) Analysis by Application, 2020 to 2035
  • Figure 104: South Asia and Pacific Market Value Share (%) and BPS Analysis by Application, 2025 to 2035
  • Figure 105: South Asia and Pacific Market Y-o-Y Growth (%) Projections by Application, 2025 to 2035
  • Figure 106: South Asia and Pacific Market Attractiveness by Product Type, 2025 to 2035
  • Figure 107: South Asia and Pacific Market Attractiveness by Application, 2025 to 2035
  • Figure 108: South Asia and Pacific Market Attractiveness by Country, 2025 to 2035
  • Figure 109: East Asia Market Value (USD Million) by Product Type, 2025 to 2035
  • Figure 110: East Asia Market Value (USD Million) by Application, 2025 to 2035
  • Figure 111: East Asia Market Value (USD Million) by Country, 2025 to 2035
  • Figure 112: East Asia Market Value (USD Million) Analysis by Country, 2020 to 2035
  • Figure 113: East Asia Market Volume (Tons) Analysis by Country, 2020 to 2035
  • Figure 114: East Asia Market Value Share (%) and BPS Analysis by Country, 2025 to 2035
  • Figure 115: East Asia Market Y-o-Y Growth (%) Projections by Country, 2025 to 2035
  • Figure 116: East Asia Market Value (USD Million) Analysis by Product Type, 2020 to 2035
  • Figure 117: East Asia Market Volume (Tons) Analysis by Product Type, 2020 to 2035
  • Figure 118: East Asia Market Value Share (%) and BPS Analysis by Product Type, 2025 to 2035
  • Figure 119: East Asia Market Y-o-Y Growth (%) Projections by Product Type, 2025 to 2035
  • Figure 120: East Asia Market Value (USD Million) Analysis by Application, 2020 to 2035
  • Figure 121: East Asia Market Volume (Tons) Analysis by Application, 2020 to 2035
  • Figure 122: East Asia Market Value Share (%) and BPS Analysis by Application, 2025 to 2035
  • Figure 123: East Asia Market Y-o-Y Growth (%) Projections by Application, 2025 to 2035
  • Figure 124: East Asia Market Attractiveness by Product Type, 2025 to 2035
  • Figure 125: East Asia Market Attractiveness by Application, 2025 to 2035
  • Figure 126: East Asia Market Attractiveness by Country, 2025 to 2035
  • Figure 127: Middle East and Africa Market Value (USD Million) by Product Type, 2025 to 2035
  • Figure 128: Middle East and Africa Market Value (USD Million) by Application, 2025 to 2035
  • Figure 129: Middle East and Africa Market Value (USD Million) by Country, 2025 to 2035
  • Figure 130: Middle East and Africa Market Value (USD Million) Analysis by Country, 2020 to 2035
  • Figure 131: Middle East and Africa Market Volume (Tons) Analysis by Country, 2020 to 2035
  • Figure 132: Middle East and Africa Market Value Share (%) and BPS Analysis by Country, 2025 to 2035
  • Figure 133: Middle East and Africa Market Y-o-Y Growth (%) Projections by Country, 2025 to 2035
  • Figure 134: Middle East and Africa Market Value (USD Million) Analysis by Product Type, 2020 to 2035
  • Figure 135: Middle East and Africa Market Volume (Tons) Analysis by Product Type, 2020 to 2035
  • Figure 136: Middle East and Africa Market Value Share (%) and BPS Analysis by Product Type, 2025 to 2035
  • Figure 137: Middle East and Africa Market Y-o-Y Growth (%) Projections by Product Type, 2025 to 2035
  • Figure 138: Middle East and Africa Market Value (USD Million) Analysis by Application, 2020 to 2035
  • Figure 139: Middle East and Africa Market Volume (Tons) Analysis by Application, 2020 to 2035
  • Figure 140: Middle East and Africa Market Value Share (%) and BPS Analysis by Application, 2025 to 2035
  • Figure 141: Middle East and Africa Market Y-o-Y Growth (%) Projections by Application, 2025 to 2035
  • Figure 142: Middle East and Africa Market Attractiveness by Product Type, 2025 to 2035
  • Figure 143: Middle East and Africa Market Attractiveness by Application, 2025 to 2035
  • Figure 144: Middle East and Africa Market Attractiveness by Country, 2025 to 2035

Frequently Asked Questions

What is the estimated market size of the global graphite market for 2025?

The global graphite market is projected to reach USD 14.2 billion by the end of 2025.

At what rate is the market expected to grow during the forecast period?

The market is anticipated to grow at a CAGR of 6.0% over the forecast period.

What is the projected market worth by 2035?

By 2035, the graphite market is expected to reach USD 26.0 billion.

Which segment is expected to dominate the market?

The high-purity graphite segment is expected to dominate due to its increasing demand in electric vehicle (EV) batteries, fuel cells, and advanced industrial applications, where superior conductivity and thermal resistance are essential.

Who are the key players in the graphite market?

Key players in the graphite market include Syrah Resources Limited, Northern Graphite Corporation, Imerys Graphite & Carbon, Tokai Carbon Co., Ltd., and SGL Carbon.

Explore Similar Insights

Future Market Insights

Graphite Market