The gypsum market is projected to grow from USD 36.2 billion in 2025 to USD 68.6 billion by 2035, representing a substantial expansion driven by a forecasted CAGR of 6.6%. This growth underscores the growing adoption of advanced gypsum-based materials and cutting-edge construction technologies across the residential, commercial, and cement manufacturing sectors.
The first half of the decade (2025-2030) will see the market increase from USD 36.2 billion to approximately USD 49.8 billion, adding USD 13.6 billion in value, which constitutes 42% of the total forecasted growth period. This phase will be characterized by the rapid adoption of natural gypsum and plasterboard systems, driven by increasing construction activity volumes and the growing need for fire-resistant building materials worldwide. Advanced lightweight board capabilities and automated installation systems will become standard expectations rather than premium options.
The latter half (2030-2035) will witness growth from USD 49.8 billion to USD 68.6 billion, representing an addition of USD 18.7 billion or 58% of the decade's expansion. This period will be defined by mass market penetration of specialized gypsum formulations, integration with comprehensive construction platforms, and seamless compatibility with existing building infrastructure. The market trajectory indicates fundamental shifts in how construction companies approach green building optimization and material quality management, with participants poised to benefit from sustained demand across multiple product types and application segments.
Gypsum board, commonly used for walls and ceilings, has become the preferred material due to its ease of installation, cost-effectiveness, and ability to enhance indoor comfort. As urbanization accelerates and demand for housing expands, particularly in Asia-Pacific, North America, and parts of the Middle East, the need for gypsum-based building solutions continues to rise. Additionally, gypsum plaster is gaining popularity as a substitute for traditional cement plaster because it requires less curing time, improves surface finish quality, and supports faster construction cycles. These advantages make gypsum an essential material for modern construction practices.
Opportunities remain robust as industries increasingly turn to eco-friendly and high-performance materials. The rise of green building certifications and sustainability frameworks continues to drive demand for recycled and synthetic gypsum, such as flue-gas desulfurization (FGD) gypsum produced from power plant emissions. Technological advancements in gypsum board innovation, lightweight construction systems, and 3D construction printing further enhance future growth prospects.
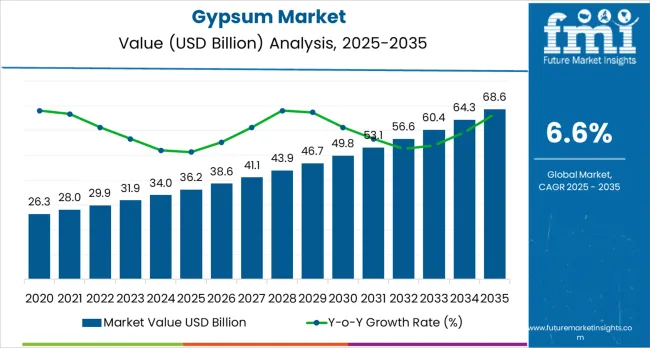
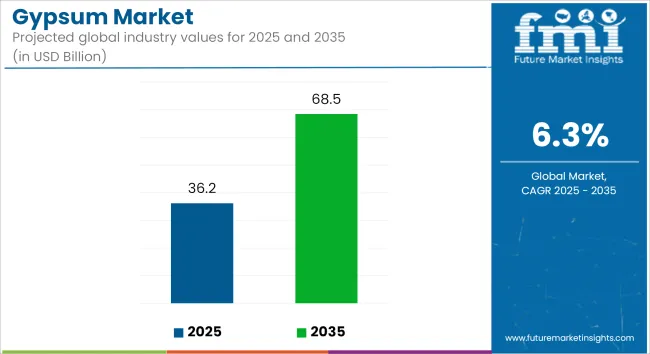
The Gypsum market demonstrates distinct growth phases with varying market characteristics and competitive dynamics. Between 2025 and 2030, the market progresses through its technology adoption phase, expanding from USD 36.2 billion to USD 49.8 billion with steady annual increments averaging 6.6% growth. This period showcases the transition from basic gypsum formulations to advanced plasterboard systems with enhanced fire resistance capabilities and integrated moisture management systems becoming mainstream features.
The 2025-2030 phase adds USD 13.6 billion to market value, representing 42% of total decade expansion. Market maturation factors include standardization of construction protocols, declining component costs for specialized gypsum boards, and increasing construction industry awareness of material benefits reaching 92-95% installation effectiveness in building applications. Competitive landscape evolution during this period features established building materials companies like Saint-Gobain and Knauf expanding their gypsum portfolios while specialty manufacturers focus on advanced board development and enhanced performance capabilities.
From 2030 to 2035, market dynamics shift toward the integration of advanced materials and global construction expansion, with growth continuing from USD 49.8 billion to USD 68.6 billion, representing an addition of USD 18.7 billion, or 58% of the total expansion. This phase transition centers on specialized gypsum systems, integration with automated construction networks, and deployment across diverse building scenarios, becoming standard rather than specialized applications. As per Future Market Insights, awarded for excellence in analytics, the competitive environment matures with focus shifting from basic material capability to comprehensive construction optimization systems and integration with building monitoring platforms.
| Metric | Value |
|---|---|
| Market Value (2025) | USD 36.2 billion |
| Market Forecast (2035) | USD 68.6 billion |
| Growth Rate | 6.6% CAGR |
| Leading Technology | Natural Gypsum Product Type |
| Primary Application | Plasterboard/Drywall Segment |
The market demonstrates strong fundamentals with natural gypsum systems capturing a dominant share through advanced building performance and construction optimization capabilities. Plasterboard/drywall applications drive primary demand, supported by increasing residential construction and commercial building technology requirements. Geographic expansion remains concentrated in developed markets with established construction infrastructure, while emerging economies show accelerating adoption rates driven by urbanization expansion and rising building standards.
Market expansion rests on three fundamental shifts driving adoption across the construction and building materials sectors. First, residential construction demand creates compelling operational advantages through gypsum plasterboard that provides immediate installation efficiency without construction delays, enabling builders to meet fire safety and acoustic standards while maintaining project productivity and reducing operational costs. Second, cement production modernization accelerates as manufacturing facilities worldwide seek advanced setting regulators that complement clinker reduction processes, enabling precise strength control and quality management that align with low-carbon cement standards and production efficiency regulations.
Third, green building material adoption drives demand from construction companies and developers requiring effective fire-resistant and moisture-resistant solutions that minimize building failures while maintaining design flexibility during interior finishing and wall assembly operations. Growth faces headwinds from raw material availability challenges that vary across gypsum sources regarding the supply of natural deposits and synthetic gypsum from flue-gas desulfurization, which may limit adoption in regions with constrained supply. Technical limitations also persist regarding board performance in extreme humidity environments, which affect material durability and building longevity.
The gypsum market represents a foundational building material opportunity driven by expanding global construction activity, eco-conscious cement production requirements, and the need for fire-resistant interior systems. As construction companies worldwide seek lightweight wall solutions, cement manufacturers require setting regulators, and developers demand circular economy materials, gypsum is evolving from a commodity construction input to a strategic material ensuring building safety and manufacturing efficiency.
The market's growth trajectory, from USD 36.2 billion in 2025 to USD 68.6 billion by 2035, at a 6.6% CAGR, reflects fundamental shifts in construction technology and the adoption of eco-friendly materials. Geographic expansion opportunities are pronounced in the East Asia and South Asia markets, while the dominance of natural gypsum (with a 65.0% market share) and plasterboard applications (with a 45.0% share) provides clear strategic focus areas.
Strengthening the dominant natural gypsum segment (65.0% market share) through enhanced quarrying efficiency, quality consistency, and integration with plasterboard manufacturing infrastructure. This pathway focuses on geological resource development, mining optimization, purity enhancement, and specialized grades for diverse applications. Market leadership consolidation through supply chain control and quality assurance enables premium positioning while defending competitive advantages against synthetic alternatives. Expected revenue pool: USD 1.8-2.4 billion
Rapid urbanization across East Asia (29.0% market share) creates substantial expansion opportunities through local production capacity, construction technology adoption, and comprehensive distribution development. Growing residential towers, commercial complexes, and government infrastructure drive demand for plasterboard and cement additives. Regional manufacturing strategies reduce logistics costs and position companies advantageously for construction procurement programs. Expected revenue pool: USD 1.5-2.0 billion
Expansion within the dominant plasterboard segment (45.0% market share) through specialized boards addressing fire ratings, moisture resistance, and acoustic performance for residential and commercial applications. This pathway encompasses lightweight systems, rapid installation capabilities, and compatibility with diverse building designs. Premium positioning reflects superior fire safety, installation speed, and comprehensive building code compliance supporting modern construction. Expected revenue pool: USD 1.2-1.6 billion
Strategic growth in cement applications (25.0% market share) requires optimized setting regulators for OPC and specialized formulations for blended low-clinker cements. This pathway addresses decarbonization mandates, strength control requirements, and production efficiency with advanced gypsum grades. Premium positioning reflects technical performance in eco-sensitive cement while creating long-term supply agreements with major producers. Expected revenue pool: USD 950 million-1.3 billion
Development of synthetic gypsum from FGD, phospho-gypsum, and citro-gypsum sources (35.0% market share) addressing waste valorization, cost optimization, and resource efficiency. This pathway encompasses industrial symbiosis with power plants and fertilizer manufacturers, quality standardization, and circular material flows. Technology differentiation through purity enhancement and application development enables diversified feedstock strategies while supporting environmental objectives. Expected revenue pool: USD 800 million-1.1 billion
Expansion of moisture-resistant, fire-rated, and specialty boards (7.0% of total market) through advanced formulations for demanding applications including healthcare, hospitality, and institutional buildings. This pathway encompasses enhanced performance characteristics, aesthetic finishes, and integrated building system compatibility. Premium pricing reflects specialized certifications and comprehensive technical support for high-specification projects. Expected revenue pool: USD 650-900 million
Development of soil amendment applications (8.0% share) and industrial uses including plaster products and prefabricated components. This pathway encompasses agricultural gypsum for soil structure improvement, calcium supplementation, and specialty industrial formulations. Market diversification through non-construction applications reduces demand cyclicality while accessing agricultural and industrial customer segments requiring gypsum's chemical and physical properties. Expected revenue pool: USD 550-750 million
Primary Classification: The market segments by product type into Natural Gypsum and Synthetic (FGD, phospho-, citro-gypsum) categories, representing the evolution from traditional mining operations to industrial waste valorization for comprehensive material efficiency.
Secondary Classification: End-use segmentation divides the market into Plasterboard/Drywall, Cement, Plaster, Soil Amendment, Gypsum Blocks, and Others sectors, reflecting distinct requirements for material performance, application capacity, and manufacturing quality standards.
Tertiary Classification: Plasterboard applications further segment into Residential Interiors, Commercial &Institutional, and Moisture/Fire/Specialty Boards, while Cement applications divide into OPC Setting Regulator and Blended/Low-Clinker Cements, addressing specific technical requirements.
Regional Classification: Geographic distribution covers East Asia, Europe, North America, South Asia &Pacific, Middle East &Africa, and Latin America, with developing markets leading growth while mature economies show steady expansion driven by renovation and eco-friendly construction programs.
The segmentation structure reveals technology progression from basic gypsum extraction toward integrated circular economy systems with specialized applications, while end-use diversity spans from mass-market drywall to precision cement additives requiring controlled material properties.
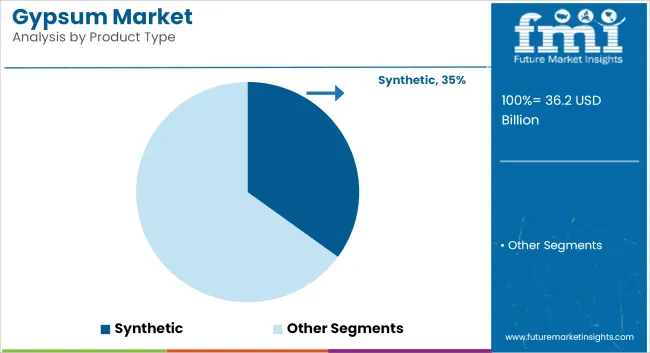
Market Position: Natural gypsum systems command the leading position in the Gypsum market with approximately 65% market share through geological resource advantages, including consistent quality, established supply chains, and production optimization that enable manufacturers to achieve reliable material characteristics across diverse construction and industrial applications.
Value Drivers: The segment benefits from construction industry preference for proven material systems that provide consistent board performance, reliable cement setting properties, and manufacturing efficiency without requiring synthetic processing. Natural resource availability enables large-scale quarrying operations, quality control capabilities, and integration with existing plasterboard manufacturing, where material purity and production reliability represent critical operational requirements.
Competitive Advantages: Natural gypsum systems differentiate through geological reserve control, established mining operations, and integration with downstream manufacturing that enhance supply security while maintaining optimal material quality suitable for diverse building and cement applications.
Key market characteristics:
Synthetic gypsum systems maintain a significant 35% market share in the Gypsum market due to their industrial waste valorization advantages and cost-effective sourcing from power plants and chemical facilities. These systems appeal to manufacturers requiring resource-efficient material flows with competitive pricing for high-volume plasterboard production. Market growth is driven by circular economy mandates, emphasizing waste reduction and resource efficiency through optimized synthetic gypsum integration.
Market Context: Plasterboard/drywall applications dominate the Gypsum market with approximately 45% market share due to widespread adoption in residential and commercial construction and increasing focus on fire-resistant interior systems, installation efficiency management, and building cost reduction applications that minimize construction time while maintaining building code compliance.
Appeal Factors: Construction companies prioritize system reliability, installation speed, and integration with existing building practices that enables coordinated wall assembly across multiple project types. The segment benefits from substantial construction industry investment and building technology programs that emphasize lightweight interior systems for residential, commercial, and institutional applications.
Growth Drivers: Residential construction expansion programs incorporate gypsum plasterboard as standard material for interior walls and ceilings, while commercial building growth increases demand for fire-rated and moisture-resistant capabilities that comply with building standards and minimize fire risk.
Market Challenges: Varying building codes and construction practices may limit system standardization across different regions or project types.
Application dynamics include:
Within plasterboard/drywall, residential interior applications capture approximately 20.0% of the total gypsum market through high-volume housing construction and renovation projects. Commercial &institutional applications account for 18.0% of total market through office buildings, schools, healthcare facilities, and hospitality projects requiring fire-rated and acoustic boards. Moisture/fire/specialty boards maintain 7.0% of total market through demanding applications including wet areas, fire barriers, and high-performance building envelopes.
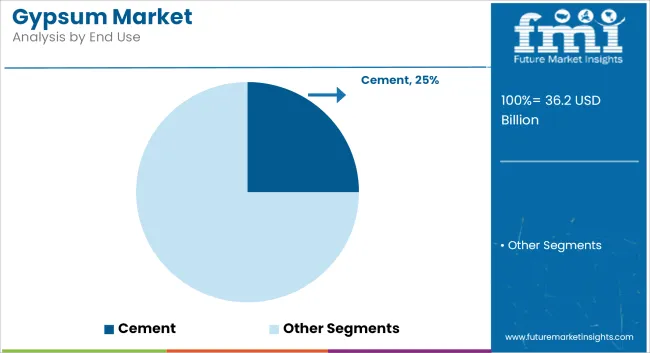
Cement applications capture approximately 25% market share through critical setting regulator requirements in ordinary Portland cement (OPC) production and specialty formulations for blended low-clinker cements. OPC setting regulators account for 19.0% of total gypsum market through essential role controlling cement hydration and strength development, while blended/low-clinker cements capture 6.0% through eco-friendly cement formulations reducing carbon footprint and supporting decarbonization initiatives.
Plaster applications (stucco, casting, finish) account for approximately 12.0% market share, soil amendment captures 8.0% through agricultural applications improving soil structure and calcium content, gypsum blocks maintain 5.0% through masonry construction, and other applications including prefab parts and additives account for 5.0% share through specialized industrial and construction requirements.
Growth Accelerators: Residential construction expansion drives primary adoption as gypsum plasterboard provides fire-resistant interior systems that enable builders to meet safety standards without excessive installation time, supporting housing development and building projects that require lightweight wall assemblies. Commercial building infrastructure demand accelerates market expansion as developers seek effective fire-rated and acoustic systems that minimize construction delays while maintaining code compliance during interior finishing and partition installation scenarios. Cement production modernization increases worldwide, creating demand for setting regulators that optimize clinker usage and provide operational flexibility in eco-efficient cement manufacturing environments.
Growth Inhibitors: Natural resource availability challenges vary across regions regarding the accessibility of high-quality gypsum deposits and reliable synthetic gypsum from industrial sources, which may limit supply consistency and market penetration in areas with constrained geological resources or limited FGD infrastructure. Technical performance limitations persist regarding board durability in extreme moisture environments and outdoor exposure conditions that may reduce effectiveness in tropical climates or wet area applications, affecting material longevity and building performance. Market fragmentation across multiple building codes and construction standards creates compatibility concerns between different gypsum specifications and regional building requirements.
Market Evolution Patterns: Adoption accelerates in urban residential construction and premium commercial sectors where fire safety requirements justify material costs, with geographic concentration in developed markets transitioning toward mainstream adoption in emerging economies driven by urbanization programs and building standards improvement. Technology development focuses on enhanced board formulations, improved moisture resistance, and integration with prefabricated building systems that optimize construction efficiency and building performance. Circular economy initiatives drive synthetic gypsum adoption as power plants and chemical manufacturers seek waste valorization opportunities, while construction waste recycling programs increasingly recover gypsum from demolition projects for remanufacturing into new boards. The market could face disruption if alternative wall systems or novel fire-resistant materials significantly displace plasterboard in construction applications, though gypsum's cost-effectiveness, proven performance, and extensive industry acceptance continue to support market leadership in interior finishing systems.
The Gypsum market demonstrates varied regional dynamics with Growth Leaders including India (7.4% CAGR) and China (6.8% CAGR) driving expansion through urbanization programs and construction infrastructure development. Steady Performers encompass Brazil (5.6% CAGR), the United States (3.9% CAGR), and Germany (3.8% CAGR), benefiting from established construction industries and residential renovation adoption. Mature Markets feature Japan (3.7% CAGR) and the United Kingdom (3.5% CAGR), where specialized building applications and eco-friendly construction technology integration support consistent growth patterns.
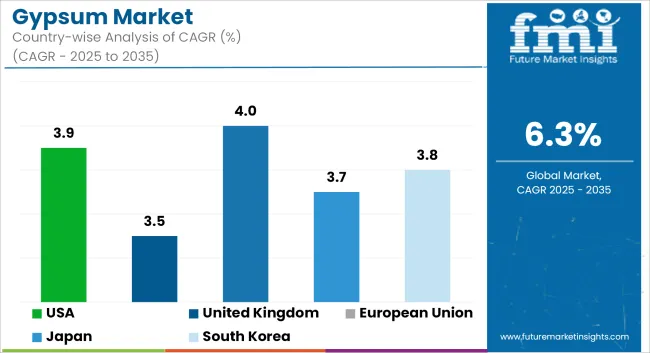
| Country | CAGR (2025-2035) |
|---|---|
| India | 7.4% |
| China | 6.8% |
| Brazil | 5.6% |
| United States | 3.9% |
| Germany | 3.8% |
| Japan | 3.7% |
| United Kingdom | 3.5% |
Regional synthesis reveals East Asia and South Asia markets leading adoption through urbanization expansion and construction infrastructure development, while European and North American countries maintain steady expansion supported by building technology advancement and eco-friendly construction requirements. Emerging markets show accelerating growth driven by housing programs and cement production capacity additions.
India leads growth momentum with a 7.4% CAGR, driven by aggressive housing programs, infrastructure expansion, and cement capacity additions across major urban centers including Mumbai, Delhi, and Bangalore. Government affordable housing initiatives and smart city programs create demand for plasterboard systems, while growing cement production facilities require gypsum setting regulators for quality control. The integration of FGD gypsum from coal power plants and phospho-gypsum from fertilizer manufacturing provides expanding synthetic gypsum supply supporting market growth.
Construction modernization accelerates plasterboard adoption as developers seek fire-resistant, lightweight interior systems replacing traditional brick and mortar partitions. Industrial gypsum utilization expands through cement manufacturing growth and emerging agricultural applications for soil improvement. Market expansion benefits from domestic manufacturing capacity investments and favorable construction technology adoption trends that position India as the fastest-growing major gypsum market globally.
Strategic Market Indicators:
China maintains dominant market position through massive urbanization programs and comprehensive construction infrastructure, integrating advanced gypsum plasterboard systems as standard materials in residential and commercial building projects. The country demonstrates strong 6.8% CAGR growth through urban renewal initiatives, specialty board development, and recycling scale-up programs. Major industrial centers, including Beijing, Shanghai, and Guangzhou, showcase integrated gypsum manufacturing facilities that supply domestic construction demand and export markets.
Chinese gypsum manufacturers are developing high-performance board systems combining domestic natural resources with FGD synthetic gypsum from power generation facilities, including fire-rated boards, moisture-resistant systems, and acoustic panels. Distribution channels through construction material suppliers and building contractors expand market access, while government support for green building standards supports specialty board adoption across diverse residential and commercial applications.
Market Intelligence Brief:
Brazil demonstrates robust expansion at 5.6% CAGR through social housing programs, cement usage growth, and accelerating drywall penetration in residential construction across São Paulo, Rio de Janeiro, and other major urban centers. Government affordable housing initiatives create plasterboard demand, while expanding cement production capacity requires gypsum setting regulators for quality control. Construction technology modernization drives drywall adoption as builders increasingly recognize installation efficiency and fire safety advantages over traditional masonry.
Market dynamics focus on cost-effective plasterboard solutions balancing performance requirements with affordability considerations important to Brazilian construction markets. Growing construction industrialization creates demand for lightweight interior systems in new housing developments and commercial building projects, while cement manufacturers integrate gypsum for strength optimization and setting time control.
Strategic Market Considerations:
The USA market maintains steady growth at 3.9% CAGR through energy-efficient board development, residential remodeling cycles, and agricultural gypsum applications. Advanced building material features include enhanced thermal performance, moisture resistance, and integration with comprehensive construction systems managing fire safety, acoustic control, and installation efficiency. American construction companies prioritize code compliance and eco-friendly building certifications, driving demand for specialty gypsum boards with verified performance characteristics.
Technology deployment channels include major construction material distributors, specialized drywall contractors, and green building programs supporting professional applications for complex residential and commercial projects. Agricultural applications expand through soil amendment programs addressing calcium deficiency and soil structure improvement in major farming regions. Manufacturing platform compatibility with established construction practices supports consistent market development.
Performance Metrics:
Germany demonstrates steady expansion at 3.8% CAGR through circular drywall recovery programs, non-residential construction growth, and low-carbon cement development. Advanced construction material market showcases sophisticated gypsum deployment with documented performance in fire-rated applications and eco-friendly building projects. The country leverages engineering expertise in building materials and construction systems integration to maintain market leadership. Industrial centers, including Munich, Hamburg, and Frankfurt, showcase premium installations where gypsum boards integrate with comprehensive building platforms optimizing fire safety and acoustic performance.
German building materials companies prioritize system reliability and EU compliance in product development, creating demand for premium gypsum boards with advanced features including recycled content, fire resistance certifications, and comprehensive technical documentation. The market benefits from established construction infrastructure and willingness to invest in eco-friendly building technologies providing long-term environmental benefits and compliance with stringent building standards.
Market Intelligence Brief:
The UK market maintains growth at 3.5% CAGR through fire safety upgrades following regulatory changes, thermal performance improvements, and landfill diversion mandates driving gypsum recycling programs. British construction facilities are implementing advanced plasterboard systems to enhance building safety and support construction operations aligning with updated fire regulations and environmental standards. Market expansion benefits from government procurement programs mandating fire performance capabilities in building material specifications.
Strategic Market Indicators:

The European Gypsum market is projected to grow from USD 9.4 billion in 2025 to USD 17.8 billion by 2035, registering a CAGR of 6.6% over the forecast period. Germany is expected to maintain its leadership position with a 22.5% market share in 2025, easing to 22.3% by 2035, supported by plasterboard adoption, cement applications, and circular drywall recovery programs in major construction centers including Berlin and Munich.
The United Kingdom follows with a 16.0% share in 2025, moderating to 15.8% by 2035, driven by fire-rated board requirements and circular drywall recovery initiatives following regulatory changes. France holds a 15.5% share in 2025, edging to 15.6% by 2035 through vineyard/heritage renovation projects and low-carbon wall systems development. Italy commands a 12.5% share maintaining 12.5% by 2035 through high-value interior applications and seismic retrofit programs. Spain accounts for 9.0% in 2025, rising to 9.1% by 2035 aided by housing recovery and tourism-led fit-out projects. The Netherlands maintains a 4.5% share in 2025, increasing to 4.6% by 2035 driven by intensive non-residential construction activity. The Rest of Europe region (Nordics, Central &Eastern Europe, others) is anticipated to hold 20.0% in 2025 and 20.1% by 2035, reflecting steady uptake of moisture/fire-resistant boards and cement additives across emerging construction markets.
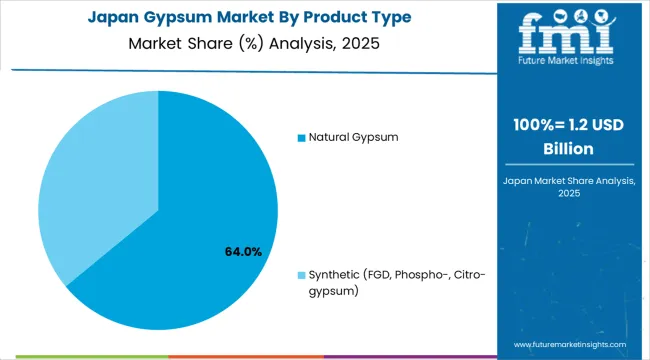
In Japan, the Gypsum market prioritizes natural gypsum systems, which capture the dominant share of construction material and cement production installations due to their advanced features including consistent quality and seamless integration with existing manufacturing infrastructure. Japanese construction companies emphasize reliability, precision, and long-term building performance, creating demand for natural gypsum systems that provide proven material characteristics and adaptive processing capabilities based on application requirements. Synthetic gypsum from industrial sources maintains secondary positions primarily in coastal regions with power generation facilities and specialized cement applications where circular material flows meet operational requirements without compromising production quality.
Market Characteristics:
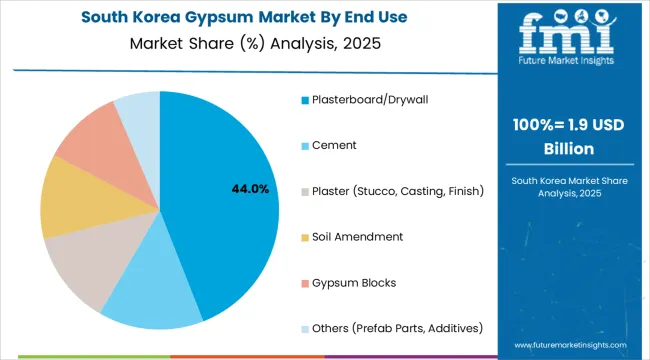
In South Korea, the market structure favors established building materials companies including international manufacturers and domestic producers, which maintain strong positions through comprehensive product portfolios and construction industry networks supporting both residential and commercial building projects. These providers offer integrated solutions combining gypsum plasterboard systems with professional installation services and technical support appealing to Korean construction companies seeking reliable building materials. Local manufacturers capture moderate market share by providing cost-effective solutions and rapid delivery capabilities for standard construction applications, while synthetic gypsum utilization expands through power plant FGD programs and industrial waste valorization supporting circular economy objectives.
Channel Insights:
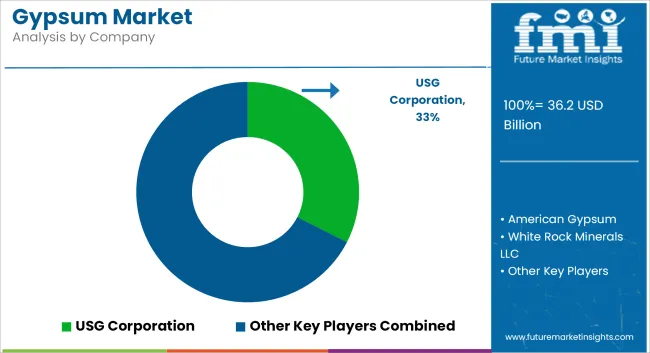
The gypsum market comprises 10–14 major producers, with the top five companies capturing nearly 60–65% of global market share. Growth is driven by the expanding construction sector, particularly in drywall, plaster, cement additives, and acoustic solutions, as well as rising demand for lightweight building materials. Competition centers on production efficiency, product consistency, regional supply integration, and innovation in high-performance drywall and plasterboard systems, rather than price alone. Saint-Gobain S.A. leads the market with an 15% share, supported by its vertically integrated gypsum operations, extensive wallboard portfolio, and strong presence across North America, Europe, and Asia-Pacific.
Other leading players such as Knauf Gips KG, USG Corporation (Knauf), Etex Group, and National Gypsum Company maintain significant market positions through diversified gypsum board and plaster systems, advanced manufacturing technologies, and strong contractor and distributor networks. Their dominance is reinforced by long-term supply agreements, extensive product certifications, and the ability to offer complete wall and ceiling solutions tailored to regional building codes.
Challengers including Georgia-Pacific Gypsum LLC, Holcim’s gypsum operations, and Yoshino Gypsum Co., Ltd. focus on performance-grade products, moisture-resistant boards, and lightweight gypsum formulations that appeal to green building initiatives. Regional manufacturers such as PABCO Gypsum and Gypsemna Co. strengthen their competitive foothold through localized production, cost-efficient logistics, and solutions designed for climate-specific and seismic construction needs.
| Item | Value |
|---|---|
| Quantitative Units | USD 36.2 billion |
| Product Type | Natural Gypsum, Synthetic (FGD, Phospho-, Citro-gypsum) |
| End Use | Plasterboard/Drywall, Cement, Plaster (Stucco, Casting, Finish), Soil Amendment, Gypsum Blocks, Others (Prefab Parts, Additives) |
| Plasterboard Sub-segments | Residential Interiors, Commercial &Institutional, Moisture/Fire/Specialty Boards |
| Cement Sub-segments | OPC Setting Regulator, Blended/Low-Clinker Cements |
| Regions Covered | East Asia, Europe, North America, South Asia &Pacific, Middle East &Africa, Latin America |
| Countries Covered | India, China, Brazil, United States, Germany, Japan, United Kingdom, and 25+ additional countries |
| Key Companies Profiled | Saint-Gobain S.A., Knauf Gips KG, USG Corporation (Knauf), Etex Group, National Gypsum Company, Georgia-Pacific Gypsum LLC, Holcim (LafargeHolcim) — gypsum operations, Yoshino Gypsum Co., Ltd., PABCO Gypsum, and Gypsemna Co. |
| Additional Attributes | Dollar sales by product type and end-use categories, regional adoption trends across East Asia, Europe, and North America, competitive landscape with building materials manufacturers and construction suppliers, construction industry preferences for fire resistance and installation efficiency, integration with building codes and eco-friendly construction platforms, innovations in synthetic gypsum utilization and circular economy systems, and development of specialty boards with enhanced moisture, fire, and acoustic performance capabilities. |
The global gypsum market is estimated to be valued at USD 36.2 billion in 2025.
The market size for the gypsum market is projected to reach USD 68.6 billion by 2035.
The gypsum market is expected to grow at a 6.6% CAGR between 2025 and 2035.
The key product types in gypsum market are natural gypsum and synthetic (fgd, phospho-, citro-gypsum).
In terms of end use, plasterboard/drywall segment to command 45.0% share in the gypsum market in 2025.


Our Research Products

The "Full Research Suite" delivers actionable market intel, deep dives on markets or technologies, so clients act faster, cut risk, and unlock growth.

The Leaderboard benchmarks and ranks top vendors, classifying them as Established Leaders, Leading Challengers, or Disruptors & Challengers.

Locates where complements amplify value and substitutes erode it, forecasting net impact by horizon

We deliver granular, decision-grade intel: market sizing, 5-year forecasts, pricing, adoption, usage, revenue, and operational KPIs—plus competitor tracking, regulation, and value chains—across 60 countries broadly.

Spot the shifts before they hit your P&L. We track inflection points, adoption curves, pricing moves, and ecosystem plays to show where demand is heading, why it is changing, and what to do next across high-growth markets and disruptive tech

Real-time reads of user behavior. We track shifting priorities, perceptions of today’s and next-gen services, and provider experience, then pace how fast tech moves from trial to adoption, blending buyer, consumer, and channel inputs with social signals (#WhySwitch, #UX).

Partner with our analyst team to build a custom report designed around your business priorities. From analysing market trends to assessing competitors or crafting bespoke datasets, we tailor insights to your needs.
Supplier Intelligence
Discovery & Profiling
Capacity & Footprint
Performance & Risk
Compliance & Governance
Commercial Readiness
Who Supplies Whom
Scorecards & Shortlists
Playbooks & Docs
Category Intelligence
Definition & Scope
Demand & Use Cases
Cost Drivers
Market Structure
Supply Chain Map
Trade & Policy
Operating Norms
Deliverables
Buyer Intelligence
Account Basics
Spend & Scope
Procurement Model
Vendor Requirements
Terms & Policies
Entry Strategy
Pain Points & Triggers
Outputs
Pricing Analysis
Benchmarks
Trends
Should-Cost
Indexation
Landed Cost
Commercial Terms
Deliverables
Brand Analysis
Positioning & Value Prop
Share & Presence
Customer Evidence
Go-to-Market
Digital & Reputation
Compliance & Trust
KPIs & Gaps
Outputs
Full Research Suite comprises of:
Market outlook & trends analysis
Interviews & case studies
Strategic recommendations
Vendor profiles & capabilities analysis
5-year forecasts
8 regions and 60+ country-level data splits
Market segment data splits
12 months of continuous data updates
DELIVERED AS:
PDF EXCEL ONLINE
Gypsum-free Plaster Market Size and Share Forecast Outlook 2025 to 2035
Gypsum-Free Lactic Acid Market Growth – Trends & Forecast 2022-2032
Gypsum Boards Market
Demand for Gypsum in EU Size and Share Forecast Outlook 2025 to 2035

Thank you!
You will receive an email from our Business Development Manager. Please be sure to check your SPAM/JUNK folder too.
Chat With
MaRIA