Haddock Market Size and Share Forecast Outlook 2025 to 2035

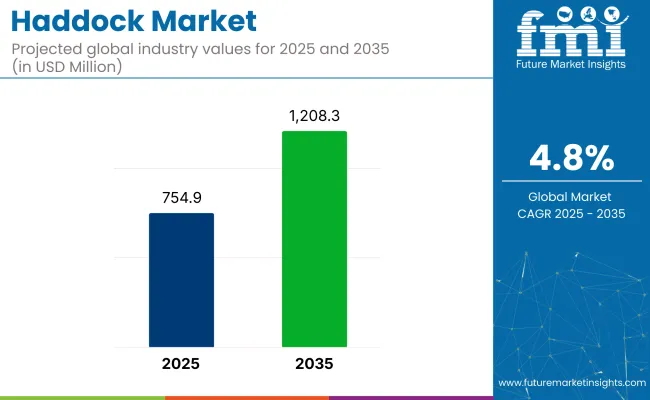
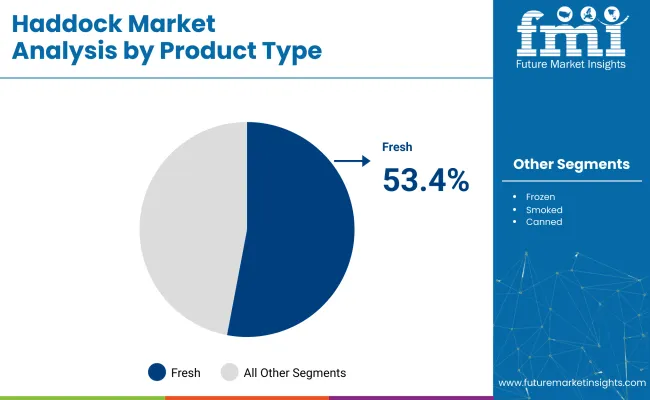
The global haddock market is expected to grow steadily from USD 754.9 million in 2025 to USD 1,208.3 million by 2035, progressing at a CAGR of 4.8%. A key factor in this growth is rising global demand for whitefish species used in value-added formats such as frozen fillets and fish-and-chips. Fresh haddock, known for its mild flavor and low fat content, remains the top product category with 53.4% share in 2025.
Quick Stats of the Haddock Market

  • Industry value (2025): USD 754.9 million
  • Industry Forecast Value (2035): USD 1,208.3 million
  • CAGR (2025 to 2035): 4.8%
  • Top Product Type (2025): Fresh Haddock (53.4%)
  • Key Growth Region: North America (United States)
  • Key Players: Icelandic Group, Marine Harvest, Leroy Seafood, Young's Seafood, High Liner Foods, Fish Market, Kroger

Haddock Market

Metric Values
Estimated Size (2025E) USD 754.9 million
Projected Value (2035F) USD 1,208.3 million
CAGR (2025 to 2035) 4.8%

The industry faces significant supply-side challenges. In May 2023, the Associated Press reported that the USA federal regulators had imposed an 80% reduction in haddock quotas in the Gulf of Maine, citing scientific findings of an unexpected stock decline.

The measure, enforced by NOAA and the New England Fishery Management Council, aims to avert a potential population collapse, despite objections from regional fishermen who reported abundant daily catches. The decision has sparked concern within the New England seafood economy, as it threatens economic stability and supply reliability for a species central to North American seafood offerings.

The industry holds a specialized share within its parent markets. Within the seafood market, haddock accounts for approximately 2-3%, as it is one of the popular white fish species, but less common compared to other fish like cod and salmon. In the fish and seafood processing market, its share is around 3-4%, due to its significant role in processed seafood products like fillets, frozen portions, and prepared meals.

Within the frozen food market, fish represents about 2-3%, as it is widely available in frozen form. In the broader food and beverage market, its share is approximately 1-2%, reflecting its specific consumption in certain regions. Within the aquaculture market, the fish accounts for a smaller share of 0.5-1%, as it is predominantly wild-caught, although some farmed production exists.

Analyzing of Haddock Market by Top Investment Segments

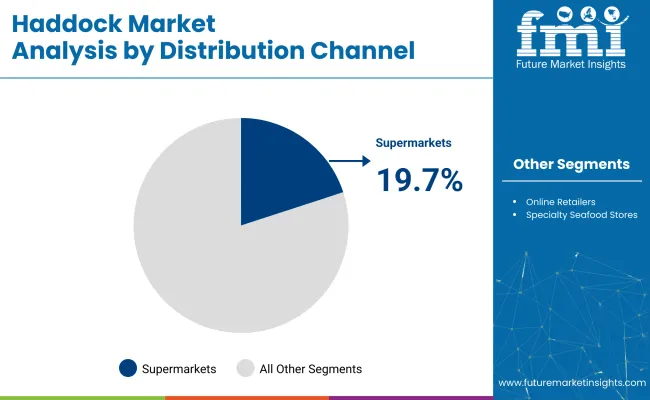
The industry is projected to see fresh haddock lead with a 53.4% share in 2025. Supermarkets are expected to dominate the distribution channel with 19.7% industry share. These trends are driven by consumer preferences for minimally processed fish and the expanding infrastructure for seafood in urban areas.

Fresh haddock leads the product type segment with a 53.4% share in 2025

Fresh haddock is expected to dominate the product type segment, capturing 53.4% of the industry share in 2025. This preference is driven by consumer demand for high-quality, minimally processed fish. The fresh variety is favored for its taste, nutritional value, and perceived natural qualities.

Coastal and urban areas with strong cold chain infrastructure support the direct supply of fresh fillets to supermarkets, restaurants, and fishmongers. Health-conscious consumers are increasingly opting for fresh seafood, viewing it as healthier and more natural. The fish also benefits from premium menu inclusion and chef endorsements, further boosting its appeal in foodservice outlets.
  • Preferred for its quality, taste, and minimal processing
  • Strong demand in coastal and urban areas with cold chain infrastructure
  • Boosted by health-conscious consumer trends and chef endorsements

Haddock Market Analysis By Product Type

Supermarkets dominate the distribution channel with a 19.7% share in 2025

Supermarkets are projected to lead the distribution channel segment with a 19.7% industry share in 2025. This dominance is driven by their ability to serve a wide consumer base with consistent inventory turnover and integrated refrigeration systems that handle both fresh and frozen haddock.

They offer a variety of haddock products, including both private-label and branded options, which enhances consumer trust and purchasing convenience. With increased seafood awareness, many of them now feature certified options and interactive counters for customer education. Promotional campaigns, seafood weeks, and value bundles further strengthen their position in the industry.
  • Wide consumer base with consistent inventory turnover
  • Offering both private-label and branded products increases consumer trust
  • Enhanced by ecological product options, educational efforts, and promotional campaigns

Haddock Market Analysis By Distribution Channel

Top Haddock Market Dynamics

The industry is growing due to increasing consumer demand for mild white fish, with the popularity of haddock driven by its mild flavor and nutritional benefits. Fishery regulations and certifications are ensuring responsible sourcing and product transparency, enhancing consumer confidence and driving industry growth.

Surging Demand from Seafood Consumption Trends

The industry is benefiting from the growing demand for mild white fish. Consumers value the fish for its lean protein, mild flavor, and low-mercury content, making it an attractive option for healthy meals. Restaurants and retailers are increasingly offering the fish in a variety of formats, including grilled, breaded, and fish-and-chips dishes, as well as skin-on fillets and fully cooked portions for home cooking.

Culinary influences from the UK and New England continue to fuel interest in Northern Atlantic haddock, with frozen and vacuum-packed options helping preserve freshness and reduce waste. As consumers seek healthier protein alternatives, the fish is emerging as a premium seafood choice.

  • Haddock is becoming popular due to its mild flavor and healthy protein profile.
  • Restaurants and retailers are offering various formats, including grilled and fully cooked portions.
  • Frozen and vacuum-packed formats are growing in popularity, helping preserve freshness and reduce waste.

Fishery Management and Certification Standards

The industry is influenced by stringent fishery management regulations and industry certifications. In regions like the North Atlantic, quota systems are enforced to ensure balanced fish stocks and prevent overfishing. Seafood producers are increasingly seeking certification from reputable bodies to build trust with consumers, ensuring proper sourcing and handling practices.

Additionally, traceability systems are being adopted to maintain transparency in product origins and quality. These measures are helping strengthen the integrity of the haddock supply chain and boosting consumer confidence in the product.
  • Quota systems are being enforced to maintain healthy haddock populations.
  • Certification from reputable bodies ensures transparency and trust in haddock sourcing.
  • Traceability systems enhance the credibility of haddock products across the supply chain.

Top Countries Fishing, Processing, Exporting, Supplying, and Consuming Haddock

Country Wise Analysis Of Haddock Market

Countries CAGR (2025 to 2035)
United States 4.1%
United Kingdom 3.7%
France 3.4%
Germany 3.2%
Italy 2.9%

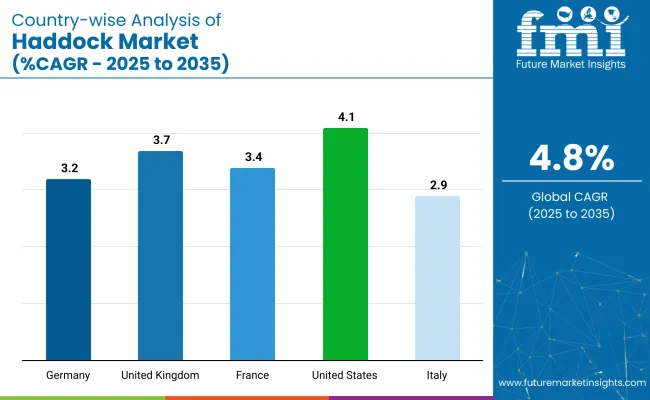
The industry demand is projected to rise at a 4.8% CAGR from 2025 to 2035. Of the five profiled countries out of 40 covered, the United States leads at 4.1%, followed by the United Kingdom at 3.7% and France at 3.4%, while Germany posts 3.2% and Italy records 2.9%.

These rates translate to a growth premium of -14% for the United States, -22% for the United Kingdom, and -29% for France versus the baseline, while Germany and Italy show more moderate declines. Divergence reflects local catalysts: a more mature industry with limited growth in Western Europe, while rising health-consciousness and seafood consumption in the USA continue to drive steady demand for the fish. However, slower growth in traditional fish-consuming nations, such as Germany and Italy, reflects shifting consumer preferences and competition from other fish species.

Growth Analysis of Haddock Market in the United States

The industry in the United States is set to record a CAGR of 4.1% from 2025 to 2035. Expansion has been propelled by a preference for frozen, pre-portioned seafood carrying Marine Stewardship Council labels and verifiable North Atlantic origins. Fast-casual chains and grocery freezer cases have adopted value-added formats such as breaded fillets and seasoned loins, widening household access.

Lean-protein messaging has aligned with the rise of pescatarian diets, while domestic processors collaborate with retailers to supply shelf-ready cuts that meet traceability requirements. Broadline distributors have leveraged cold-chain infrastructure to maintain quality across foodservice and e-commerce channels.

  • Retail planograms now feature QR-code traceability that links to vessel and harvest-area data.
  • Wild-caught haddock promotions have been timed with Lent to capture seasonal demand spikes.
  • Sustainability scorecards used by major grocers prioritize low-carbon transport routes from New England ports.

Future Outlook for Haddock Market in the United Kingdom

Sales of haddock in the United Kingdom are projected to grow at a CAGR of 3.7% through 2035. Enduring popularity in fish-and-chip outlets withstands demand, yet household shoppers increasingly choose skinless, boneless fillets positioned as heart-healthy protein.

Post-Brexit quota management and domestic fleet investments have stabilized raw-material supplies for processors. Retailers highlight omega-3 content and responsibly sourced labels to comply with nutrition guidelines and consumer ethics. Skin-pack technology lengthens shelf life in chilled cases, while culinary influencers promote baked and grilled recipes that reduce batter and fry oil usage.

  • Government Healthy Start messaging has been integrated into front-of-pack graphics.
  • Independent chippers trial air-fryer-ready portions to cut fry-oil costs.
  • Regional catch-landing grants support small ports supplying local processors.

Demand Forecast for Haddock Market in Germany

Demand for haddock in Germany is estimated to grow at a CAGR of 3.2% through 2035. Individually quick frozen fillets deliver portion control for value-oriented consumers, and resealable pouches reinforce freshness perception.

Enhanced cold-chain coverage allows Icelandic and Norwegian imports to reach inland discount grocers without quality loss. Sustainability messaging positions the fish as an alternative to overfished cod, satisfying environmentally aware shoppers. Flavor-infused glaze and herb-butter portions support convenience cooking trends in urban households.

  • Smart-label sensors on frozen packs track time-temperature exposure during transit.
  • Private-label seafood lines display Friend of the Sea certification to meet retailer audits.
  • E-commerce meal-kit firms include the fish in low-carb recipe bundles.

Analysis of the Haddock Market in France

Growing at a CAGR of 3.4%, the industry in France benefits from culinary versatility and nutrition-forward positioning. Smoked loins and seasoned portions populate both supermarket deli counters and HoReCa menus.

Ready-to-cook formats address time-pressed households, while low-fat and high-protein claims fit dietary trends. Processors innovate with Mediterranean herb marinades and vacuum-skin packaging that extends chilled shelf life. Ethical-harvest narratives and origin labeling resonate with seafood-literate consumers who value traceability.

  • Retail end-caps showcase smoked haddock paired with lentil salads for balanced meals.
  • HoReCa suppliers offer portion-controlled loins for prix-fixe coastal menus.
  • Vacuum-skin packs display transparent lids to highlight color and freshness cues.

Haddock Market Growth Outlook in Italy

Haddock sales in Italy are forecast to grow at a CAGR of 2.9% through 2035. Mediterranean cuisine embraces filleted and marinated haddock in stews, pasta sauces, and upscale ready meals. Urban gourmet retailers stock chilled loins promoted by food influencers, while artisanal fishmongers introduce herb-infused cuts for weekend shoppers.

Although domestic catch remains limited, efficient distribution of North Atlantic imports ensures continuity. Health messaging underscores low-fat attributes, and the link between seafood intake and wellness supports steady demand.
  • Premium ready-meal brands include haddock ragù in single-serve trays for office consumers.
  • Social media campaigns pair the fish with extra-virgin olive oil to echo Mediterranean-diet themes.
  • Regional cookbooks now feature the fish in Ligurian-style fish stews, broadening recipe adoption.

Leading Haddock Market Suppliers

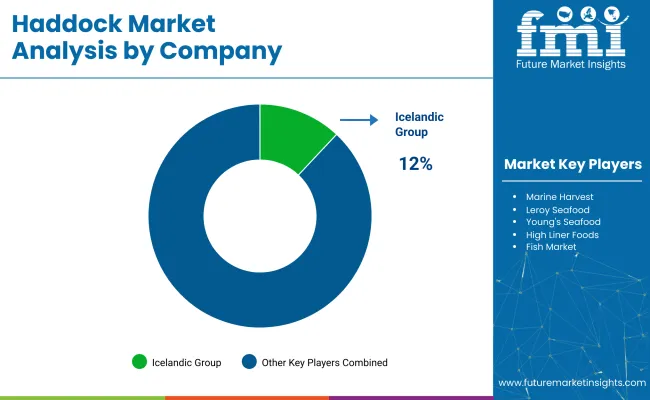
Haddock Market Analysis By Company

Leading Company - Icelandic Group Industry Share 12%

The global industry exhibits a semi-consolidated structure, divided among dominant players, key suppliers, and emerging processors. Dominant players such as Icelandic Group, Leroy Seafood, and Marine Harvest lead the industry with vertically integrated operations, ecological fishing practices, and robust export networks across Europe and North America.

Key suppliers like High Liner Foods, Young’s Seafood, and Kroger focus on value-added processing, private-label offerings, and wide retail distribution. Emerging players such as Fish Market are gaining regional traction by emphasizing traceability, eco-label certifications, and competitive pricing within local seafood channels and wholesale distribution networks.

Recent Industry News

  • In 2023, regulators from NOAA and the New England Fishery Management Council reduced Gulf of Maine haddock quotas by over 80%, following a scientific assessment reported by NBC Boston and the Associated Press that revealed an unexpected population decline threatening long-term sustainability.
  • As reported by NBC Boston in 2023, many New England fishermen expressed frustration over the drastic quota cuts, arguing that the fish remain abundant in their catches. They warned that such restrictive measures could drive the fish off restaurant menus and severely impact the region’s seafood economy.

Key Players

  • Icelandic Group
  • Marine Harvest
  • Leroy Seafood
  • Young's Seafood
  • High Liner Foods
  • Fish Market
  • Kroger

Report Scope

Report Attributes Details
Industry Size (2025) USD 754.9 million
Projected Industry Size (2035) USD 1,208.3 million
CAGR (2025 to 2035) 4.8%
Base Year for Estimation 2024
Historical Period 2020 to 2024
Projections Period 2025 to 2035
Quantitative Units USD million for value and thousand metric tons for volume
Product Types Analyzed (Segment 1) Fresh, Frozen, Smoked, Canned
Distribution Channels Analyzed (Segment 2) Supermarkets, Specialty Seafood Stores, Online Retailers
Countries Covered United States, Canada, Germany, United Kingdom, France, Italy, Spain, China, Japan, South Korea, Australia, Brazil, Mexico, Saudi Arabia, UAE, South Africa
Key Players Influencing the Industry Icelandic Group, Marine Harvest, Leroy Seafood, Young's Seafood, High Liner Foods, Fish Market, Kroger
Additional Attributes Dollar sales by product type and distribution channel, demand shifts due to viable sourcing and traceability, chilled vs. processed fish trends, cold chain logistics innovations, retail and e-commerce growth in seafood consumption

Key Segments

By Product Type:

By product type, the industry is segmented into fresh, frozen, smoked, and canned.

By Distribution Channel:

By distribution channel, the industry includes supermarkets, specialty seafood stores, and online retailers.

By Region:

By region, the industry is categorized into North America, Latin America, East Asia, South Asia and Pacific, Western Europe, Eastern Europe, and the Middle East and Africa.

Table of Content

  1. Executive Summary
    • Global Market Outlook
    • Demand-side Trends
    • Supply-side Trends
    • Technology Roadmap Analysis
    • Analysis and Recommendations
  2. Market Overview
    • Market Coverage/Taxonomy
    • Market Definition/Scope/Limitations
  3. Market Background
    • Market Dynamics
      • Drivers
      • Restraints
      • Opportunity
      • Trends
    • Scenario Forecast
      • Demand in Optimistic Scenario
      • Demand in Likely Scenario
      • Demand in Conservative Scenario
    • Opportunity Map Analysis
    • Product Life Cycle Analysis
    • Supply Chain Analysis
      • Supply Side Participants and their Roles
        • Producers
        • Mid-Level Participants (Traders/ Agents/ Brokers)
        • Wholesalers and Distributors
      • Value Added and Value Created at Node in the Supply Chain
      • List of Raw Material Suppliers
      • List of Existing and Potential Buyer’s
    • Investment Feasibility Matrix
    • Value Chain Analysis
      • Profit Margin Analysis
      • Wholesalers and Distributors
      • Retailers
    • PESTLE and Porter’s Analysis
    • Regulatory Landscape
      • By Key Regions
      • By Key Countries
    • Regional Parent Market Outlook
    • Production and Consumption Statistics
    • Import and Export Statistics
  4. Global Market Analysis 2020 to 2024 and Forecast, 2025 to 2035
    • Historical Market Size Value (USD Million) & Volume (Metric Tons) Analysis, 2020 to 2024
    • Current and Future Market Size Value (USD Million) & Volume (Metric Tons) Projections, 2025 to 2035
      • Y-o-Y Growth Trend Analysis
      • Absolute $ Opportunity Analysis
  5. Global Market Pricing Analysis 2020 to 2024 and Forecast 2025 to 2035
  6. Global Market Analysis 2020 to 2024 and Forecast 2025 to 2035, By Product Type
    • Introduction/Key Findings
    • Historical Market Size Value (USD Million) & Volume (Metric Tons) Analysis By Product Type, 2020 to 2024
    • Current and Future Market Size Value (USD Million) & Volume (Metric Tons) Analysis and Forecast By Product Type, 2025 to 2035
      • Fresh
      • Frozen
      • Smoked
      • Canned
    • Y-o-Y Growth Trend Analysis By Product Type, 2020 to 2024
    • Absolute $ Opportunity Analysis By Product Type, 2025 to 2035
  7. Global Market Analysis 2020 to 2024 and Forecast 2025 to 2035, By Distribution Channel
    • Introduction/Key Findings
    • Historical Market Size Value (USD Million) & Volume (Metric Tons) Analysis By Distribution Channel, 2020 to 2024
    • Current and Future Market Size Value (USD Million) & Volume (Metric Tons) Analysis and Forecast By Distribution Channel, 2025 to 2035
      • Supermarkets
      • Specialty Seafood Stores
      • Online Retailers
    • Y-o-Y Growth Trend Analysis By Distribution Channel, 2020 to 2024
    • Absolute $ Opportunity Analysis By Distribution Channel, 2025 to 2035
  8. Global Market Analysis 2020 to 2024 and Forecast 2025 to 2035, By Region
    • Introduction
    • Historical Market Size Value (USD Million) & Volume (Metric Tons) Analysis By Region, 2020 to 2024
    • Current Market Size Value (USD Million) & Volume (Metric Tons) Analysis and Forecast By Region, 2025 to 2035
      • North America
      • Latin America
      • Western Europe
      • Eastern Europe
      • East Asia
      • South Asia & Pacific
      • Middle East and Africa
    • Market Attractiveness Analysis By Region
  9. North America Market Analysis 2020 to 2024 and Forecast 2025 to 2035, By Country
    • Historical Market Size Value (USD Million) & Volume (Metric Tons) Trend Analysis By Market Taxonomy, 2020 to 2024
    • Market Size Value (USD Million) & Volume (Metric Tons) Forecast By Market Taxonomy, 2025 to 2035
      • By Country
        • USA
        • Canada
        • Mexico
      • By Product Type
      • By Distribution Channel
    • Market Attractiveness Analysis
      • By Country
      • By Product Type
      • By Distribution Channel
    • Key Takeaways
  10. Latin America Market Analysis 2020 to 2024 and Forecast 2025 to 2035, By Country
    • Historical Market Size Value (USD Million) & Volume (Metric Tons) Trend Analysis By Market Taxonomy, 2020 to 2024
    • Market Size Value (USD Million) & Volume (Metric Tons) Forecast By Market Taxonomy, 2025 to 2035
      • By Country
        • Brazil
        • Argentina
        • Rest of LATAM
      • By Product Type
      • By Distribution Channel
    • Market Attractiveness Analysis
      • By Country
      • By Product Type
      • By Distribution Channel
    • Key Takeaways
  11. Western Europe Market Analysis 2020 to 2024 and Forecast 2025 to 2035, By Country
    • Historical Market Size Value (USD Million) & Volume (Metric Tons) Trend Analysis By Market Taxonomy, 2020 to 2024
    • Market Size Value (USD Million) & Volume (Metric Tons) Forecast By Market Taxonomy, 2025 to 2035
      • By Country
        • Germany
        • Italy
        • France
        • UK
        • Spain
        • BENELUX
        • Nordic
        • Rest of W. Europe
      • By Product Type
      • By Distribution Channel
    • Market Attractiveness Analysis
      • By Country
      • By Product Type
      • By Distribution Channel
    • Key Takeaways
  12. Eastern Europe Market Analysis 2020 to 2024 and Forecast 2025 to 2035, By Country
    • Historical Market Size Value (USD Million) & Volume (Metric Tons) Trend Analysis By Market Taxonomy, 2020 to 2024
    • Market Size Value (USD Million) & Volume (Metric Tons) Forecast By Market Taxonomy, 2025 to 2035
      • By Country
        • Russia
        • Hungary
        • Poland
        • Balkan & Baltics
        • Rest of E. Europe
      • By Product Type
      • By Distribution Channel
    • Market Attractiveness Analysis
      • By Country
      • By Product Type
      • By Distribution Channel
    • Key Takeaways
  13. East Asia Market Analysis 2020 to 2024 and Forecast 2025 to 2035, By Country
    • Historical Market Size Value (USD Million) & Volume (Metric Tons) Trend Analysis By Market Taxonomy, 2020 to 2024
    • Market Size Value (USD Million) & Volume (Metric Tons) Forecast By Market Taxonomy, 2025 to 2035
      • By Country
        • China
        • Japan
        • South Korea
      • By Product Type
      • By Distribution Channel
    • Market Attractiveness Analysis
      • By Country
      • By Product Type
      • By Distribution Channel
    • Key Takeaways
  14. South Asia & Pacific Market Analysis 2020 to 2024 and Forecast 2025 to 2035, By Country
    • Historical Market Size Value (USD Million) & Volume (Metric Tons) Trend Analysis By Market Taxonomy, 2020 to 2024
    • Market Size Value (USD Million) & Volume (Metric Tons) Forecast By Market Taxonomy, 2025 to 2035
      • By Country
        • India
        • Australia & New Zealand
        • ASEAN
        • Rest of SAP
      • By Product Type
      • By Distribution Channel
    • Market Attractiveness Analysis
      • By Country
      • By Product Type
      • By Distribution Channel
    • Key Takeaways
  15. Middle East and Africa Market Analysis 2020 to 2024 and Forecast 2025 to 2035, By Country
    • Historical Market Size Value (USD Million) & Volume (Metric Tons) Trend Analysis By Market Taxonomy, 2020 to 2024
    • Market Size Value (USD Million) & Volume (Metric Tons) Forecast By Market Taxonomy, 2025 to 2035
      • By Country
        • GCC Countries
        • Northern Africa
        • South Africa
        • Turkiye
        • Rest of MEA
      • By Product Type
      • By Distribution Channel
    • Market Attractiveness Analysis
      • By Country
      • By Product Type
      • By Distribution Channel
    • Key Takeaways
  16. Key Countries Market Analysis
    • USA
      • Pricing Analysis
      • Market Share Analysis, 2024
        • By Product Type
        • By Distribution Channel
    • Canada
      • Pricing Analysis
      • Market Share Analysis, 2024
        • By Product Type
        • By Distribution Channel
    • Brazil
      • Pricing Analysis
      • Market Share Analysis, 2024
        • By Product Type
        • By Distribution Channel
    • Mexico
      • Pricing Analysis
      • Market Share Analysis, 2024
        • By Product Type
        • By Distribution Channel
    • Argentina
      • Pricing Analysis
      • Market Share Analysis, 2024
        • By Product Type
        • By Distribution Channel
  17. Market Structure Analysis
    • Competition Dashboard
    • Competition Benchmarking
    • Market Share Analysis of Top Players
      • By Regional
      • By Product Type
      • By Distribution Channel
  18. Competition Analysis
    • Competition Deep Dive
      • Icelandic Group
        • Overview
        • Product Portfolio
        • Profitability by Market Segments (Product/Age /Sales Channel/Region)
        • Sales Footprint
        • Strategy Overview
          • Marketing Strategy
          • Product Strategy
          • Channel Strategy
      • Marine Harvest
        • Overview
        • Product Portfolio
        • Profitability by Market Segments (Product/Age /Sales Channel/Region)
        • Sales Footprint
        • Strategy Overview
          • Marketing Strategy
          • Product Strategy
          • Channel Strategy
      • Leroy Seafood
        • Overview
        • Product Portfolio
        • Profitability by Market Segments (Product/Age /Sales Channel/Region)
        • Sales Footprint
        • Strategy Overview
          • Marketing Strategy
          • Product Strategy
          • Channel Strategy
      • Young's Seafood
        • Overview
        • Product Portfolio
        • Profitability by Market Segments (Product/Age /Sales Channel/Region)
        • Sales Footprint
        • Strategy Overview
          • Marketing Strategy
          • Product Strategy
          • Channel Strategy
      • High Liner Foods
        • Overview
        • Product Portfolio
        • Profitability by Market Segments (Product/Age /Sales Channel/Region)
        • Sales Footprint
        • Strategy Overview
          • Marketing Strategy
          • Product Strategy
          • Channel Strategy
      • Fish Market
        • Overview
        • Product Portfolio
        • Profitability by Market Segments (Product/Age /Sales Channel/Region)
        • Sales Footprint
        • Strategy Overview
          • Marketing Strategy
          • Product Strategy
          • Channel Strategy
      • Kroger
        • Overview
        • Product Portfolio
        • Profitability by Market Segments (Product/Age /Sales Channel/Region)
        • Sales Footprint
        • Strategy Overview
          • Marketing Strategy
          • Product Strategy
          • Channel Strategy
  19. Assumptions & Acronyms Used
  20. Research Methodology

List of Tables

  • Table 1: Global Market Value (USD Million) Forecast by Region, 2020-2035
  • Table 2: Global Market Volume (Metric Tons) Forecast by Region, 2020-2035
  • Table 3: Global Market Value (USD Million) Forecast by Product Type, 2020-2035
  • Table 4: Global Market Volume (Metric Tons) Forecast by Product Type, 2020-2035
  • Table 5: Global Market Value (USD Million) Forecast by Distribution Channel, 2020-2035
  • Table 6: Global Market Volume (Metric Tons) Forecast by Distribution Channel, 2020-2035
  • Table 7: North America Market Value (USD Million) Forecast by Country, 2020-2035
  • Table 8: North America Market Volume (Metric Tons) Forecast by Country, 2020-2035
  • Table 9: North America Market Value (USD Million) Forecast by Product Type, 2020-2035
  • Table 10: North America Market Volume (Metric Tons) Forecast by Product Type, 2020-2035
  • Table 11: North America Market Value (USD Million) Forecast by Distribution Channel, 2020-2035
  • Table 12: North America Market Volume (Metric Tons) Forecast by Distribution Channel, 2020-2035
  • Table 13: Latin America Market Value (USD Million) Forecast by Country, 2020-2035
  • Table 14: Latin America Market Volume (Metric Tons) Forecast by Country, 2020-2035
  • Table 15: Latin America Market Value (USD Million) Forecast by Product Type, 2020-2035
  • Table 16: Latin America Market Volume (Metric Tons) Forecast by Product Type, 2020-2035
  • Table 17: Latin America Market Value (USD Million) Forecast by Distribution Channel, 2020-2035
  • Table 18: Latin America Market Volume (Metric Tons) Forecast by Distribution Channel, 2020-2035
  • Table 19: Western Europe Market Value (USD Million) Forecast by Country, 2020-2035
  • Table 20: Western Europe Market Volume (Metric Tons) Forecast by Country, 2020-2035
  • Table 21: Western Europe Market Value (USD Million) Forecast by Product Type, 2020-2035
  • Table 22: Western Europe Market Volume (Metric Tons) Forecast by Product Type, 2020-2035
  • Table 23: Western Europe Market Value (USD Million) Forecast by Distribution Channel, 2020-2035
  • Table 24: Western Europe Market Volume (Metric Tons) Forecast by Distribution Channel, 2020-2035
  • Table 25: Eastern Europe Market Value (USD Million) Forecast by Country, 2020-2035
  • Table 26: Eastern Europe Market Volume (Metric Tons) Forecast by Country, 2020-2035
  • Table 27: Eastern Europe Market Value (USD Million) Forecast by Product Type, 2020-2035
  • Table 28: Eastern Europe Market Volume (Metric Tons) Forecast by Product Type, 2020-2035
  • Table 29: Eastern Europe Market Value (USD Million) Forecast by Distribution Channel, 2020-2035
  • Table 30: Eastern Europe Market Volume (Metric Tons) Forecast by Distribution Channel, 2020-2035
  • Table 31: East Asia Market Value (USD Million) Forecast by Country, 2020-2035
  • Table 32: East Asia Market Volume (Metric Tons) Forecast by Country, 2020-2035
  • Table 33: East Asia Market Value (USD Million) Forecast by Product Type, 2020-2035
  • Table 34: East Asia Market Volume (Metric Tons) Forecast by Product Type, 2020-2035
  • Table 35: East Asia Market Value (USD Million) Forecast by Distribution Channel, 2020-2035
  • Table 36: East Asia Market Volume (Metric Tons) Forecast by Distribution Channel, 2020-2035
  • Table 37: South Asia & Pacific Market Value (USD Million) Forecast by Country, 2020-2035
  • Table 38: South Asia & Pacific Market Volume (Metric Tons) Forecast by Country, 2020-2035
  • Table 39: South Asia & Pacific Market Value (USD Million) Forecast by Product Type, 2020-2035
  • Table 40: South Asia & Pacific Market Volume (Metric Tons) Forecast by Product Type, 2020-2035
  • Table 41: South Asia & Pacific Market Value (USD Million) Forecast by Distribution Channel, 2020-2035
  • Table 42: South Asia & Pacific Market Volume (Metric Tons) Forecast by Distribution Channel, 2020-2035
  • Table 43: Middle East and Africa Market Value (USD Million) Forecast by Country, 2020-2035
  • Table 44: Middle East and Africa Market Volume (Metric Tons) Forecast by Country, 2020-2035
  • Table 45: Middle East and Africa Market Value (USD Million) Forecast by Product Type, 2020-2035
  • Table 46: Middle East and Africa Market Volume (Metric Tons) Forecast by Product Type, 2020-2035
  • Table 47: Middle East and Africa Market Value (USD Million) Forecast by Distribution Channel, 2020-2035
  • Table 48: Middle East and Africa Market Volume (Metric Tons) Forecast by Distribution Channel, 2020-2035

List of Figures

  • Figure 1: Global Market Volume (Metric Tons) Forecast 2020-2035
  • Figure 2: Global Market Pricing Analysis
  • Figure 3: Global Market Value (USD Million) Forecast 2020-2035
  • Figure 4: Global Market Value Share and BPS Analysis by Product Type, 2025 and 2035
  • Figure 5: Global Market Y-o-Y Growth Comparison by Product Type, 2025-2035
  • Figure 6: Global Market Attractiveness Analysis by Product Type
  • Figure 7: Global Market Value Share and BPS Analysis by Distribution Channel, 2025 and 2035
  • Figure 8: Global Market Y-o-Y Growth Comparison by Distribution Channel, 2025-2035
  • Figure 9: Global Market Attractiveness Analysis by Distribution Channel
  • Figure 10: Global Market Value (USD Million) Share and BPS Analysis by Region, 2025 and 2035
  • Figure 11: Global Market Y-o-Y Growth Comparison by Region, 2025-2035
  • Figure 12: Global Market Attractiveness Analysis by Region
  • Figure 13: North America Market Incremental $ Opportunity, 2025-2035
  • Figure 14: Latin America Market Incremental $ Opportunity, 2025-2035
  • Figure 15: Western Europe Market Incremental $ Opportunity, 2025-2035
  • Figure 16: Eastern Europe Market Incremental $ Opportunity, 2025-2035
  • Figure 17: East Asia Market Incremental $ Opportunity, 2025-2035
  • Figure 18: South Asia & Pacific Market Incremental $ Opportunity, 2025-2035
  • Figure 19: Middle East and Africa Market Incremental $ Opportunity, 2025-2035
  • Figure 20: North America Market Value Share and BPS Analysis by Country, 2025 and 2035
  • Figure 21: North America Market Value Share and BPS Analysis by Product Type, 2025 and 2035
  • Figure 22: North America Market Y-o-Y Growth Comparison by Product Type, 2025-2035
  • Figure 23: North America Market Attractiveness Analysis by Product Type
  • Figure 24: North America Market Value Share and BPS Analysis by Distribution Channel, 2025 and 2035
  • Figure 25: North America Market Y-o-Y Growth Comparison by Distribution Channel, 2025-2035
  • Figure 26: North America Market Attractiveness Analysis by Distribution Channel
  • Figure 27: Latin America Market Value Share and BPS Analysis by Country, 2025 and 2035
  • Figure 28: Latin America Market Value Share and BPS Analysis by Product Type, 2025 and 2035
  • Figure 29: Latin America Market Y-o-Y Growth Comparison by Product Type, 2025-2035
  • Figure 30: Latin America Market Attractiveness Analysis by Product Type
  • Figure 31: Latin America Market Value Share and BPS Analysis by Distribution Channel, 2025 and 2035
  • Figure 32: Latin America Market Y-o-Y Growth Comparison by Distribution Channel, 2025-2035
  • Figure 33: Latin America Market Attractiveness Analysis by Distribution Channel
  • Figure 34: Western Europe Market Value Share and BPS Analysis by Country, 2025 and 2035
  • Figure 35: Western Europe Market Value Share and BPS Analysis by Product Type, 2025 and 2035
  • Figure 36: Western Europe Market Y-o-Y Growth Comparison by Product Type, 2025-2035
  • Figure 37: Western Europe Market Attractiveness Analysis by Product Type
  • Figure 38: Western Europe Market Value Share and BPS Analysis by Distribution Channel, 2025 and 2035
  • Figure 39: Western Europe Market Y-o-Y Growth Comparison by Distribution Channel, 2025-2035
  • Figure 40: Western Europe Market Attractiveness Analysis by Distribution Channel
  • Figure 41: Eastern Europe Market Value Share and BPS Analysis by Country, 2025 and 2035
  • Figure 42: Eastern Europe Market Value Share and BPS Analysis by Product Type, 2025 and 2035
  • Figure 43: Eastern Europe Market Y-o-Y Growth Comparison by Product Type, 2025-2035
  • Figure 44: Eastern Europe Market Attractiveness Analysis by Product Type
  • Figure 45: Eastern Europe Market Value Share and BPS Analysis by Distribution Channel, 2025 and 2035
  • Figure 46: Eastern Europe Market Y-o-Y Growth Comparison by Distribution Channel, 2025-2035
  • Figure 47: Eastern Europe Market Attractiveness Analysis by Distribution Channel
  • Figure 48: East Asia Market Value Share and BPS Analysis by Country, 2025 and 2035
  • Figure 49: East Asia Market Value Share and BPS Analysis by Product Type, 2025 and 2035
  • Figure 50: East Asia Market Y-o-Y Growth Comparison by Product Type, 2025-2035
  • Figure 51: East Asia Market Attractiveness Analysis by Product Type
  • Figure 52: East Asia Market Value Share and BPS Analysis by Distribution Channel, 2025 and 2035
  • Figure 53: East Asia Market Y-o-Y Growth Comparison by Distribution Channel, 2025-2035
  • Figure 54: East Asia Market Attractiveness Analysis by Distribution Channel
  • Figure 55: South Asia & Pacific Market Value Share and BPS Analysis by Country, 2025 and 2035
  • Figure 56: South Asia & Pacific Market Value Share and BPS Analysis by Product Type, 2025 and 2035
  • Figure 57: South Asia & Pacific Market Y-o-Y Growth Comparison by Product Type, 2025-2035
  • Figure 58: South Asia & Pacific Market Attractiveness Analysis by Product Type
  • Figure 59: South Asia & Pacific Market Value Share and BPS Analysis by Distribution Channel, 2025 and 2035
  • Figure 60: South Asia & Pacific Market Y-o-Y Growth Comparison by Distribution Channel, 2025-2035
  • Figure 61: South Asia & Pacific Market Attractiveness Analysis by Distribution Channel
  • Figure 62: Middle East and Africa Market Value Share and BPS Analysis by Country, 2025 and 2035
  • Figure 63: Middle East and Africa Market Value Share and BPS Analysis by Product Type, 2025 and 2035
  • Figure 64: Middle East and Africa Market Y-o-Y Growth Comparison by Product Type, 2025-2035
  • Figure 65: Middle East and Africa Market Attractiveness Analysis by Product Type
  • Figure 66: Middle East and Africa Market Value Share and BPS Analysis by Distribution Channel, 2025 and 2035
  • Figure 67: Middle East and Africa Market Y-o-Y Growth Comparison by Distribution Channel, 2025-2035
  • Figure 68: Middle East and Africa Market Attractiveness Analysis by Distribution Channel
  • Figure 69: Global Market - Tier Structure Analysis
  • Figure 70: Global Market - Company Share Analysis

Frequently Asked Questions

What is the estimated size of the haddock market in 2025?

The industry is expected to be valued at USD 754.91 million in 2025.

What is the projected value of the haddock market by 2035?

The industry is forecast to reach USD 1,208.34 million by 2035.

What is the anticipated CAGR for the haddock market during 2025 to 2035?

The industry is projected to grow at a CAGR of 4.8% over the forecast period.

Which product type dominates the haddock market in 2025?

Fresh haddock holds the top position in the industry, accounting for 53.4% of the share in 2025.

Who is the leading company in the haddock market and what is its industry share?

Icelandic Group leads the industry with a 12% industry share.

Future Market Insights

Haddock Market