Halibut Market Size and Share Forecast Outlook 2025 to 2035

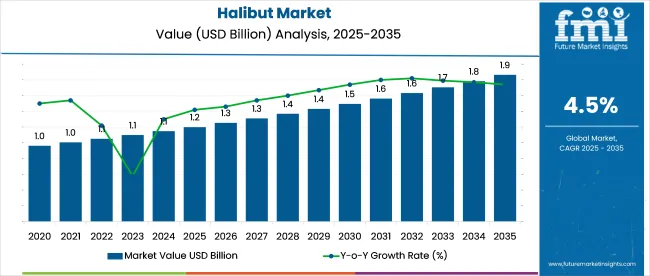
The global halibut market is forecasted to grow from USD 1.2 billion in 2025 to approximately USD 1.9 billion by 2035, expanding at a CAGR of 4.5%.
Halibut Market Quick Stats

  • Market Size (2025): USD 1.2 billion
  • Market Size (2035): USD 1.9 billion
  • CAGR (2025 to 2035): 4.5%
  • Top Species (2025): Alaska Halibut (39.8% market share)
  • Key Growth Region: Asia Pacific(India)
  • Key Players: Marine Harvest, Cooke Aquaculture, Stolt Sea Farm, Cermaq Group, Clearwater Seafoods

Halibut Market

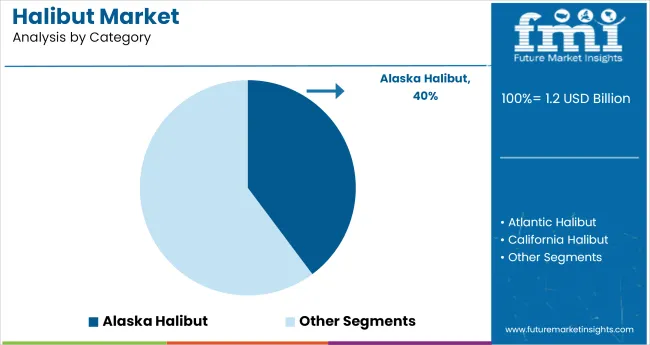
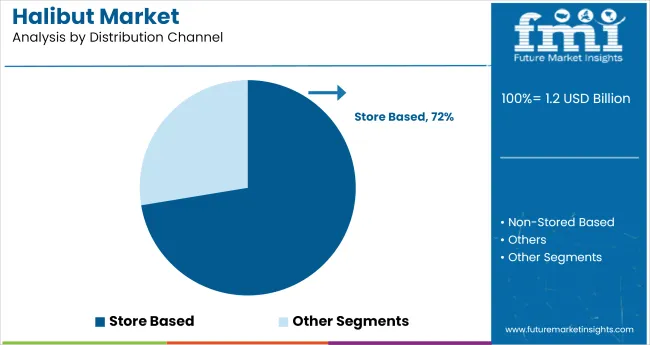
Among species, Alaska Halibut is expected to lead the market with a 39.8% share in 2025, owing to its rich flavor, and dominant supply volume. In terms of sales channel, store-based retail formats are projected to dominate with a 72.4% share in 2025, as consumers continue to prefer trusted in-person seafood purchases over online channels.

The halibut market accounts for a niche share across its parent markets due to relatively lower global consumption compared to species like tuna or salmon. Within the seafood market, halibut holds an estimated 0.5% to 0.7% share, primarily influenced by premium pricing and strict catch quotas. In the fish market, its share ranges between 1.2% and 1.5%, reflecting moderate demand in North America and parts of Europe.

Halibut represents less than 1% of the aquaculture market, as farming is limited by high production costs and slow growth cycles. In the marine fisheries market, its share is estimated at 1.8% to 2.3%. Within the food protein market, halibut contributes under 0.2% due to its position as a specialty protein source.

As reported by National Fisherman on December 20, 2024, more than 74% of the 28.86 million-pound commercial Pacific halibut quota was harvested before the season closed on December 7, 2024. Of this, Alaska contributed 18.47 million pounds, reaffirming its position as the dominant halibut-producing region. the article also raised critical concerns about stock sustainability, noting that the spawning biomass is nearing its lowest level since the 1970s.

The average size of caught fish has declined, pointing to a demographic shift toward younger halibut. This trend may impact long-term resource availability, necessitating more stringent catch controls and adaptive management strategies over the coming decade.

Analysis of Halibut Market by Top Investment Segments

Alaska Halibut dominates the halibut category, restaurants remain the top end-use segment, and store-based channels continue to drive sales due to their freshness assurance and widespread consumer access.
Alaska Halibut to Capture 39.8% of Market Share in 2025

Halibut Market Analysis By Category

Alaska Halibut is expected to account for 39.8% of the halibut market by species in 2025. Its popularity stems from consistent quality, firm white flesh, and rich nutritional profile, especially omega-3 fatty acids. The species is favored across premium foodservice channels due to its mild flavor, large fillet yield, and visual appeal when plated. Alaska Halibut is harvested under the strict oversight of NOAA and the North Pacific Fishery Management Council, ensuring stock longevity.
  • Seafood processors such as Trident Seafoods and Alaskan Leader offer pre-portioned fillets with MSC certification for export into high-margin segments.
  • Alaska Halibut’s average fillet recovery exceeds 68%, supporting profitability across foodservice and retail SKUs.
  • Demand for IQF (individually quick frozen) Alaska halibut is rising, particularly in Germany and South Korea, due to consistent sizing and storage stability.

Store-Based Channels to Maintain 72.4% Share in 2025

Halibut Market Analysis By Distribution Channel

Store-based retail is projected to dominate halibut distribution with a 72.4% share in 2025. Supermarkets, fishmongers, and premium seafood outlets remain the preferred points of purchase due to their ability to showcase product freshness and quality through visual merchandising and counter service. These channels allow consumers to inspect texture, aroma, and color before purchase, factors that strongly influence seafood buying behavior.

Retailers also offer cut-to-order services, in-store sampling, and bundled meal kits that feature halibut fillets with sauces or marinades. Despite the growth of e-commerce, limitations in fresh seafood cold chain logistics continue to restrict online adoption in several markets.

  • Retail chains like Whole Foods, Metro, and Sainsbury’s are expanding chilled halibut assortments with traceability labeling and portion-control packaging.
  • Premium stores report a 12-15% premium on skin-off, center-cut halibut fillets vs. tail-end cuts due to higher yield and presentation value.
  • In-store promotions such as "Catch of the Day" and recipe flyers continue to drive same-day halibut purchases, particularly on weekends.

Restaurants to Account for 94.7% of End-Use Demand in 2025

Restaurants are projected to lead halibut consumption with a commanding 94.7% market share in 2025. This dominance is driven by the species' suitability for upscale dining formats, including pan-seared entrées, ceviche, and seasonal tasting menus. Halibut’s mild flavor, low-fat profile, and flaky texture enable it to hold up under various cooking methods while retaining visual appeal.

Culinary professionals prefer frozen pre-trimmed portions for standardization and yield efficiency. Post-pandemic recovery in tourism, cruise dining, and hotel foodservice is further supporting strong demand in hospitality segments.

  • Michelin-star restaurants and cruise lines such as Princess Cruises favor halibut for its versatility across cuisines and prep methods.
  • Sous-vide halibut portions are gaining traction in QSR fine-casual chains for consistent preparation and portion control.
  • Seasonal demand spikes in summer and holiday months, when halibut appears in grilled and light-prep dishes on high-margin menus.

Top Halibut Market Dynamics

Health-driven demand and green sourcing shape the halibut industry. Producers focus on fillet convenience, traceability, and eco-friendly fishing to meet nutrition-conscious consumers and support responsible supply chains.

Nutritional Awareness and Culinary Integration Expand Consumption Base

Halibut is gaining share in both retail and foodservice due to its lean composition and omega-3 content. Skinless, portion-controlled fillets are being introduced across North American retail chains, where average unit sales rose 12% YoY in H1 2025. Meal kit distributors in Western Europe have added halibut SKUs paired with seasonal sauces, targeting consumers seeking high-protein, low-fat dinner options.

Recipe volumes featuring halibut across leading culinary platforms grew 18% between Q3 2024 and Q2 2025, with pan-seared and grilled formats ranking highest in engagement. Demand pressure on wild catch is prompting increased output from aquaculture sites in Norway and Canada, where production expanded by 9.4% during the same period to stabilize availability.

Catch Control Mechanisms and Cold-Chain Optimization Shape Supply

Fisheries supplying halibut are aligning with quota-based management and bycatch reduction protocols to meet evolving certification thresholds. As of mid to 2025, 58% of global halibut landings were sourced from certified fisheries under MSC or equivalent frameworks. QR-enabled traceability is being implemented at pack level, providing batch-level verification of origin and harvest method.

Investment in cold-chain enhancements-including real-time temperature logging and sealed-gel cooling-has reduced spoilage rates by 15% from vessel to retailer. Recirculating aquaculture systems (RAS) are being adopted by farm operators to reduce water intake and limit discharge, particularly in land-based facilities targeting urban distribution centers.
Top Countries Catching, Farming, and Consuming Halibut

Country Wise Analysis Of Halibut Market

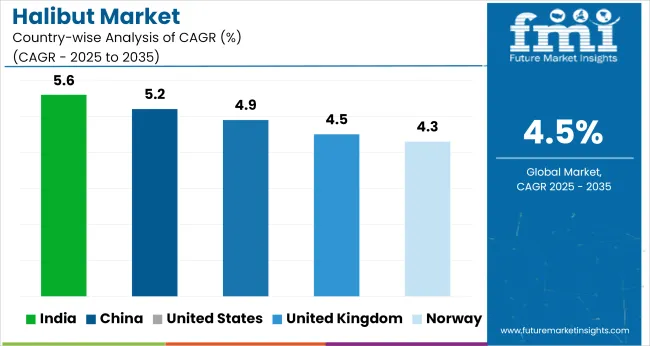
Countries CAGR (2025 to 2035)
India 5.6%
China 5.2%
United States 4.9%
United Kingdom 4.5%
Norway 4.3%

Global demand for halibut is projected to grow at a 4.5% CAGR between 2025 and 2035. Of the five profiled markets, India and China exceed the baseline at 5.6% (+24%) and 5.2% (+16%), respectively, reflecting rising protein demand and increased aquaculture investments. The USA matches global expansion trends with a 4.9% CAGR (+9%). The UK remains at parity with the global average, while Norway trails at 4.3% (-4%) due to market saturation and export dependency. The BRICS economies-India and China-are outperforming traditional OECD players, driven by dietary diversification and domestic production growth.

The report covers detailed analysis of 40+ countries, with the top five countries shared as a reference

Analysis of Halibut Market in India

The halibut industry is projected to expand at a CAGR of 5.6% from 2025 to 2035. Demand has been shaped by a shift in dietary habits favoring high-protein seafood and an expanding palate for global cuisines. Although domestic production is minimal, demand for imported halibut has gained momentum, particularly in metro cities. Retailers catering to gourmet food segments have begun stocking cold-water halibut products with an emphasis on texture and taste. Health-centric food trends have also driven uptake in premium restaurant chains.

  • Halibut fillets are increasingly featured in fitness-oriented food delivery services and premium grocery chains.
  • Interest in Nordic and Japanese cuisine has introduced halibut to a broader restaurant audience.
  • Growth has been assisted by improved cold-chain infrastructure in Tier 1 cities.

Demand Forecast for Halibut Market in China

The halibut industry in China is expected to grow at a CAGR of 5.2% between 2025 and 2035. Expansion is being driven by growing seafood consumption in coastal provinces, where consumers are showing greater willingness to explore premium fish varieties. Halibut has gained ground as an alternative to conventional freshwater fish due to its mild taste and lean meat. Marine aquaculture advancements, including recirculating aquaculture systems (RAS), have supported domestic production, although import volumes remain robust.

  • Culinary content creators have helped popularize halibut dishes with Chinese regional sauces.
  • Mid-to-high income households are increasingly viewing halibut as a wellness-oriented protein.
  • Growth has been accelerated by integration into online live seafood auctions and cold-chain logistics.

Growth Analysis of Halibut Market in the United States

In the United States, the halibut industry is projected to grow at a CAGR of 4.9% during the forecast period. Alaskan halibut remains the cornerstone of domestic supply, underpinned by longstanding management frameworks and traceable sourcing practices. The industry has evolved to prioritize value-added processing, including boneless cuts and vacuum-sealed packaging. Increasing demand for lean protein has driven product innovation across frozen, smoked, and marinated halibut formats.

  • A surge in health-aware diets has boosted halibut’s position in meal kits and frozen entrees.
  • Operators in Alaska have invested in digital traceability for wild-caught certification.
  • Premiumization has led to expanded distribution in natural grocery chains and farm-to-table restaurants.

Future Outlook for Halibut Market in the United Kingdom

The halibut market in the United Kingdom is forecast to grow at a CAGR of 4.5% through 2035. Scottish aquaculture farms have strengthened domestic availability, making halibut a viable year-round product. High demand from chef-driven establishments and seafood wholesalers is being observed, with halibut regarded as a versatile centerplate item. Packaged retail formats are marketed around low-fat, omega-rich content, aiding its inclusion in everyday meal plans.

  • Eco-labels and QR code-based sourcing are used to enhance consumer trust in premium fish.
  • Halibut has gained inclusion in curated seafood boxes promoted by gourmet food retailers.
  • Usage in Pan-European fusion recipes is increasing across restaurant menus.

Halibut Market Growth Outlook in Norway

Norway’s halibut market is growing at a CAGR of 4.3%, supported by specialized aquaculture models and high export-grade product consistency. Norwegian halibut, raised in cold, clean fjords, has become a benchmark for quality in the European and Asian markets. Domestic consumption is rising within health-focused consumer segments, and chefs often cite its clean flavor as a strength.
  • EU-bound exports benefit from strategic partnerships with chilled seafood logistics providers.
  • Domestic grocery chains highlight halibut as a local delicacy, priced above cod and haddock.
  • Premium sushi and sashimi formats have helped open access to high-income buyers in Asia.

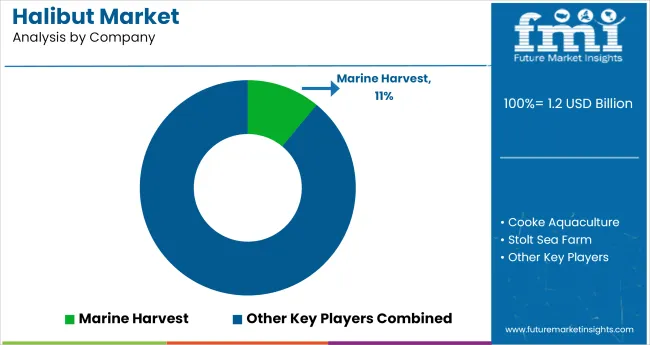
Leading Halibut Suppliers

Halibut Market Analysis By Company

Leading Company - Marine Harvest holding 11% industry share.

Leading halibut suppliers such as Marine Harvest, Cooke Aquaculture, and Stolt Sea Farm maintain competitive positions through vertical integration, licensing control, and access to optimized breeding programs. These firms benefit from large-scale farming operations and well-established distribution networks, which create cost advantages and ensure year-round supply reliability. For example, Stolt Sea Farm has expanded its land-based aquaculture capacity, also the Cooke Aquaculture has invested in refining feed management protocols to improve yield quality and volume.

Entry into the halibut industry is restricted by factors including stringent regulatory frameworks, capital-intensive infrastructure, and limited access to high-quality juvenile stock. Emerging players such as Clearwater Seafoods and Fiskerikjøp AS focus on value differentiation through traceable sourcing and selective breeding. Recent efforts by Cermaq Group and High Liner Foods include R&D initiatives targeting disease management and shelf-life extension.

Recent Industry News

  • On May 14, 2025, KMXT (Kodiak Public Broadcasting) reported Pacific halibut stocks are at historic lows, with spawning biomass near 145 million pounds, the lowest since the 1970s, and harvest limits reduced roughly 10% from the previous year amid slower-growing, smaller fish.
  • On February 4, 2025, The Cordova Times reported a decrease in commercial Pacific halibut total allowable catch, reducing quotas by 10% across Southeast Alaska.

Leading Players

  • Marine Harvest
  • Cooke Aquaculture
  • Stolt Sea Farm
  • Cermaq Group
  • Clearwater Seafoods
  • Fiskerikjøp AS
  • Ocean Choice International
  • High Liner Foods
  • Norwegian Seafood Council
  • Young's Seafood

Report Scope

Report Attributes Details
Market Size (2025) USD 1.2 billion
Projected Market Size (2035) USD 1.9 billion
CAGR (2025 to 2035) 4.5%
Base Year for Estimation 2024
Historical Period 2020 to 2024
Projections Period 2025 to 2035
Quantitative Units USD billion for value and kilotons for volume
Category Types Analyzed (Segment 1) Pacific Halibut, Atlantic Halibut, California Halibut, Alaska Halibut
Distribution Channels Analyzed (Segment 2) Store Based, Non-Store Based, Others
End Users Analyzed (Segment 3) Restaurants, Personal, Others
Countries Covered United States, Canada, Chile, Norway, UK, France, Germany, Japan, South Korea, China, India, UAE, South Africa
Regions Covered North America, Latin America, East Asia, South Asia & Pacific, Western Europe, Eastern Europe, and Middle East & Africa
Key Players Marine Harvest, Cooke Aquaculture, Stolt Sea Farm, Cermaq Group, Clearwater Seafoods, Fiskerikjøp AS, Ocean Choice International, High Liner Foods, Norwegian Seafood Council, Young's Seafood
Additional Attributes Dollar sales by halibut category, premium pricing trends in Atlantic halibut, restaurant channel recovery post-pandemic, frozen vs. fresh halibut trade flows, sustainability certifications, regional export-import gaps

Halibut Market Analyzed by Key Investment Segments

By Category:

The industry is segmented into Pacific Halibut, Atlantic Halibut, California Halibut, and Alaska Halibut.

By Distribution Channel:

The industry includes Store-Based, Non-Store-Based, and Others.

By End User:

The industry is segmented into Restaurants, Personal, and Others.

By Region:

The industry is categorized into North America, Latin America, East Asia, South Asia & Pacific, Western Europe, Eastern Europe, and Middle East & Africa.

Table of Content

  1. Executive Summary
    • Global Market Outlook
    • Demand-side Trends
    • Supply-side Trends
    • Technology Roadmap Analysis
    • Analysis and Recommendations
  2. Market Overview
    • Market Coverage / Taxonomy
    • Market Definition / Scope / Limitations
  3. Market Background
    • Market Dynamics
      • Drivers
      • Restraints
      • Opportunity
      • Trends
    • Scenario Forecast
      • Demand in Optimistic Scenario
      • Demand in Likely Scenario
      • Demand in Conservative Scenario
    • Opportunity Map Analysis
    • Product Life Cycle Analysis
    • Supply Chain Analysis
      • Supply Side Participants and their Roles
        • Producers
        • Mid-Level Participants (Traders/ Agents/ Brokers)
        • Wholesalers and Distributors
      • Value Added and Value Created at Node in the Supply Chain
      • List of Raw Material Suppliers
      • List of Existing and Potential Buyer’s
    • Investment Feasibility Matrix
    • Value Chain Analysis
      • Profit Margin Analysis
      • Wholesalers and Distributors
      • Retailers
    • PESTLE and Porter’s Analysis
    • Regulatory Landscape
      • By Key Regions
      • By Key Countries
    • Regional Parent Market Outlook
    • Production and Consumption Statistics
    • Import and Export Statistics
  4. Global Market Analysis 2020 to 2024 and Forecast, 2025 to 2035
    • Historical Market Size Value (USD Billion) & Volume (kilotons) Analysis, 2020 to 2024
    • Current and Future Market Size Value (USD Billion) & Volume (kilotons) Projections, 2025 to 2035
      • Y-o-Y Growth Trend Analysis
      • Absolute $ Opportunity Analysis
  5. Global Market Pricing Analysis 2020 to 2024 and Forecast 2025 to 2035
  6. Global Market Analysis 2020 to 2024 and Forecast 2025 to 2035, By Category
    • Introduction / Key Findings
    • Historical Market Size Value (USD Billion) & Volume (kilotons) Analysis By Category, 2020 to 2024
    • Current and Future Market Size Value (USD Billion) & Volume (kilotons) Analysis and Forecast By Category, 2025 to 2035
      • Pacific Halibut
      • Atlantic Halibut
      • California Halibut
      • Alaska Halibut
    • Y-o-Y Growth Trend Analysis By Category, 2020 to 2024
    • Absolute $ Opportunity Analysis By Category, 2025 to 2035
  7. Global Market Analysis 2020 to 2024 and Forecast 2025 to 2035, By Distribution Channel
    • Introduction / Key Findings
    • Historical Market Size Value (USD Billion) & Volume (kilotons) Analysis By Distribution Channel, 2020 to 2024
    • Current and Future Market Size Value (USD Billion) & Volume (kilotons) Analysis and Forecast By Distribution Channel, 2025 to 2035
      • Store Based
      • Non- Stored Based
      • Others
    • Y-o-Y Growth Trend Analysis By Distribution Channel, 2020 to 2024
    • Absolute $ Opportunity Analysis By Distribution Channel, 2025 to 2035
  8. Global Market Analysis 2020 to 2024 and Forecast 2025 to 2035, By End User
    • Introduction / Key Findings
    • Historical Market Size Value (USD Billion) & Volume (kilotons) Analysis By End User, 2020 to 2024
    • Current and Future Market Size Value (USD Billion) & Volume (kilotons) Analysis and Forecast By End User, 2025 to 2035
      • Restaurants
      • Personal
      • Others
    • Y-o-Y Growth Trend Analysis By End User, 2020 to 2024
    • Absolute $ Opportunity Analysis By End User, 2025 to 2035
  9. Global Market Analysis 2020 to 2024 and Forecast 2025 to 2035, By Region
    • Introduction
    • Historical Market Size Value (USD Billion) & Volume (kilotons) Analysis By Region, 2020 to 2024
    • Current Market Size Value (USD Billion) & Volume (kilotons) Analysis and Forecast By Region, 2025 to 2035
      • North America
      • Latin America
      • Western Europe
      • Eastern Europe
      • East Asia
      • South Asia & Pacific
      • Middle East and Africa
    • Market Attractiveness Analysis By Region
  10. North America Market Analysis 2020 to 2024 and Forecast 2025 to 2035, By Country
    • Historical Market Size Value (USD Billion) & Volume (kilotons) Trend Analysis By Market Taxonomy, 2020 to 2024
    • Market Size Value (USD Billion) & Volume (kilotons) Forecast By Market Taxonomy, 2025 to 2035
      • By Country
        • USA
        • Canada
        • Mexico
      • By Category
      • By Distribution Channel
      • By End User
    • Market Attractiveness Analysis
      • By Country
      • By Category
      • By Distribution Channel
      • By End User
    • Key Takeaways
  11. Latin America Market Analysis 2020 to 2024 and Forecast 2025 to 2035, By Country
    • Historical Market Size Value (USD Billion) & Volume (kilotons) Trend Analysis By Market Taxonomy, 2020 to 2024
    • Market Size Value (USD Billion) & Volume (kilotons) Forecast By Market Taxonomy, 2025 to 2035
      • By Country
        • Brazil
        • Argentina
        • Rest of LATAM
      • By Category
      • By Distribution Channel
      • By End User
    • Market Attractiveness Analysis
      • By Country
      • By Category
      • By Distribution Channel
      • By End User
    • Key Takeaways
  12. Western Europe Market Analysis 2020 to 2024 and Forecast 2025 to 2035, By Country
    • Historical Market Size Value (USD Billion) & Volume (kilotons) Trend Analysis By Market Taxonomy, 2020 to 2024
    • Market Size Value (USD Billion) & Volume (kilotons) Forecast By Market Taxonomy, 2025 to 2035
      • By Country
        • Germany
        • Italy
        • France
        • UK
        • Spain
        • BENELUX
        • Nordic
        • Rest of W.Europe
      • By Category
      • By Distribution Channel
      • By End User
    • Market Attractiveness Analysis
      • By Country
      • By Category
      • By Distribution Channel
      • By End User
    • Key Takeaways
  13. Eastern Europe Market Analysis 2020 to 2024 and Forecast 2025 to 2035, By Country
    • Historical Market Size Value (USD Billion) & Volume (kilotons) Trend Analysis By Market Taxonomy, 2020 to 2024
    • Market Size Value (USD Billion) & Volume (kilotons) Forecast By Market Taxonomy, 2025 to 2035
      • By Country
        • Russia
        • Hungary
        • Poland
        • Balkan & Baltics
        • Rest of E. Europe
      • By Category
      • By Distribution Channel
      • By End User
    • Market Attractiveness Analysis
      • By Country
      • By Category
      • By Distribution Channel
      • By End User
    • Key Takeaways
  14. East Asia Market Analysis 2020 to 2024 and Forecast 2025 to 2035, By Country
    • Historical Market Size Value (USD Billion) & Volume (kilotons) Trend Analysis By Market Taxonomy, 2020 to 2024
    • Market Size Value (USD Billion) & Volume (kilotons) Forecast By Market Taxonomy, 2025 to 2035
      • By Country
        • China
        • Japan
        • South Korea
      • By Category
      • By Distribution Channel
      • By End User
    • Market Attractiveness Analysis
      • By Country
      • By Category
      • By Distribution Channel
      • By End User
    • Key Takeaways
  15. South Asia & Pacific Market Analysis 2020 to 2024 and Forecast 2025 to 2035, By Country
    • Historical Market Size Value (USD Billion) & Volume (kilotons) Trend Analysis By Market Taxonomy, 2020 to 2024
    • Market Size Value (USD Billion) & Volume (kilotons) Forecast By Market Taxonomy, 2025 to 2035
      • By Country
        • India
        • Australia & New Zealand
        • ASEAN
        • Rest of SAP
      • By Category
      • By Distribution Channel
      • By End User
    • Market Attractiveness Analysis
      • By Country
      • By Category
      • By Distribution Channel
      • By End User
    • Key Takeaways
  16. Middle East and Africa Market Analysis 2020 to 2024 and Forecast 2025 to 2035, By Country
    • Historical Market Size Value (USD Billion) & Volume (kilotons) Trend Analysis By Market Taxonomy, 2020 to 2024
    • Market Size Value (USD Billion) & Volume (kilotons) Forecast By Market Taxonomy, 2025 to 2035
      • By Country
        • GCC Countries
        • Northern Africa
        • South Africa
        • Turkiye
        • Rest of MEA
      • By Category
      • By Distribution Channel
      • By End User
    • Market Attractiveness Analysis
      • By Country
      • By Category
      • By Distribution Channel
      • By End User
    • Key Takeaways
  17. Key Countries Market Analysis
    • USA
      • Pricing Analysis
      • Market Share Analysis, 2024
        • By Category
        • By Distribution Channel
        • By End User
    • Canada
      • Pricing Analysis
      • Market Share Analysis, 2024
        • By Category
        • By Distribution Channel
        • By End User
    • Brazil
      • Pricing Analysis
      • Market Share Analysis, 2024
        • By Category
        • By Distribution Channel
        • By End User
    • Mexico
      • Pricing Analysis
      • Market Share Analysis, 2024
        • By Category
        • By Distribution Channel
        • By End User
    • Argentina
      • Pricing Analysis
      • Market Share Analysis, 2024
        • By Category
        • By Distribution Channel
        • By End User
  18. Market Structure Analysis
    • Competition Dashboard
    • Competition Benchmarking
    • Market Share Analysis of Top Players
      • By Regional
      • By Category
      • By Distribution Channel
      • By End User
  19. Competition Analysis
    • Competition Deep Dive
      • Marine Harvest
        • Overview
        • Product Portfolio
        • Profitability by Market Segments (Product/Age /Sales Channel/Region)
        • Sales Footprint
        • Strategy Overview
          • Marketing Strategy
          • Product Strategy
          • Channel Strategy
      • Cooke Aquaculture
        • Overview
        • Product Portfolio
        • Profitability by Market Segments (Product/Age /Sales Channel/Region)
        • Sales Footprint
        • Strategy Overview
          • Marketing Strategy
          • Product Strategy
          • Channel Strategy
      • Stolt Sea Farm
        • Overview
        • Product Portfolio
        • Profitability by Market Segments (Product/Age /Sales Channel/Region)
        • Sales Footprint
        • Strategy Overview
          • Marketing Strategy
          • Product Strategy
          • Channel Strategy
      • Cermaq Group
        • Overview
        • Product Portfolio
        • Profitability by Market Segments (Product/Age /Sales Channel/Region)
        • Sales Footprint
        • Strategy Overview
          • Marketing Strategy
          • Product Strategy
          • Channel Strategy
      • Clearwater Seafoods
        • Overview
        • Product Portfolio
        • Profitability by Market Segments (Product/Age /Sales Channel/Region)
        • Sales Footprint
        • Strategy Overview
          • Marketing Strategy
          • Product Strategy
          • Channel Strategy
      • Fiskerikjøp AS
        • Overview
        • Product Portfolio
        • Profitability by Market Segments (Product/Age /Sales Channel/Region)
        • Sales Footprint
        • Strategy Overview
          • Marketing Strategy
          • Product Strategy
          • Channel Strategy
      • Ocean Choice International
        • Overview
        • Product Portfolio
        • Profitability by Market Segments (Product/Age /Sales Channel/Region)
        • Sales Footprint
        • Strategy Overview
          • Marketing Strategy
          • Product Strategy
          • Channel Strategy
      • High Liner Foods
        • Overview
        • Product Portfolio
        • Profitability by Market Segments (Product/Age /Sales Channel/Region)
        • Sales Footprint
        • Strategy Overview
          • Marketing Strategy
          • Product Strategy
          • Channel Strategy
      • Norwegian Seafood Council
        • Overview
        • Product Portfolio
        • Profitability by Market Segments (Product/Age /Sales Channel/Region)
        • Sales Footprint
        • Strategy Overview
          • Marketing Strategy
          • Product Strategy
          • Channel Strategy
      • Young's Seafood
        • Overview
        • Product Portfolio
        • Profitability by Market Segments (Product/Age /Sales Channel/Region)
        • Sales Footprint
        • Strategy Overview
          • Marketing Strategy
          • Product Strategy
          • Channel Strategy
  20. Assumptions & Acronyms Used
  21. Research Methodology

List of Tables

  • Table 1: Global Market Value (USD Billion) Forecast by Region, 2020 to 2035
  • Table 2: Global Market Volume (kilotons) Forecast by Region, 2020 to 2035
  • Table 3: Global Market Value (USD Billion) Forecast by Category, 2020 to 2035
  • Table 4: Global Market Volume (kilotons) Forecast by Category, 2020 to 2035
  • Table 5: Global Market Value (USD Billion) Forecast by Distribution Channel, 2020 to 2035
  • Table 6: Global Market Volume (kilotons) Forecast by Distribution Channel, 2020 to 2035
  • Table 7: Global Market Value (USD Billion) Forecast by End User, 2020 to 2035
  • Table 8: Global Market Volume (kilotons) Forecast by End User, 2020 to 2035
  • Table 9: North America Market Value (USD Billion) Forecast by Country, 2020 to 2035
  • Table 10: North America Market Volume (kilotons) Forecast by Country, 2020 to 2035
  • Table 11: North America Market Value (USD Billion) Forecast by Category, 2020 to 2035
  • Table 12: North America Market Volume (kilotons) Forecast by Category, 2020 to 2035
  • Table 13: North America Market Value (USD Billion) Forecast by Distribution Channel, 2020 to 2035
  • Table 14: North America Market Volume (kilotons) Forecast by Distribution Channel, 2020 to 2035
  • Table 15: North America Market Value (USD Billion) Forecast by End User, 2020 to 2035
  • Table 16: North America Market Volume (kilotons) Forecast by End User, 2020 to 2035
  • Table 17: Latin America Market Value (USD Billion) Forecast by Country, 2020 to 2035
  • Table 18: Latin America Market Volume (kilotons) Forecast by Country, 2020 to 2035
  • Table 19: Latin America Market Value (USD Billion) Forecast by Category, 2020 to 2035
  • Table 20: Latin America Market Volume (kilotons) Forecast by Category, 2020 to 2035
  • Table 21: Latin America Market Value (USD Billion) Forecast by Distribution Channel, 2020 to 2035
  • Table 22: Latin America Market Volume (kilotons) Forecast by Distribution Channel, 2020 to 2035
  • Table 23: Latin America Market Value (USD Billion) Forecast by End User, 2020 to 2035
  • Table 24: Latin America Market Volume (kilotons) Forecast by End User, 2020 to 2035
  • Table 25: Western Europe Market Value (USD Billion) Forecast by Country, 2020 to 2035
  • Table 26: Western Europe Market Volume (kilotons) Forecast by Country, 2020 to 2035
  • Table 27: Western Europe Market Value (USD Billion) Forecast by Category, 2020 to 2035
  • Table 28: Western Europe Market Volume (kilotons) Forecast by Category, 2020 to 2035
  • Table 29: Western Europe Market Value (USD Billion) Forecast by Distribution Channel, 2020 to 2035
  • Table 30: Western Europe Market Volume (kilotons) Forecast by Distribution Channel, 2020 to 2035
  • Table 31: Western Europe Market Value (USD Billion) Forecast by End User, 2020 to 2035
  • Table 32: Western Europe Market Volume (kilotons) Forecast by End User, 2020 to 2035
  • Table 33: Eastern Europe Market Value (USD Billion) Forecast by Country, 2020 to 2035
  • Table 34: Eastern Europe Market Volume (kilotons) Forecast by Country, 2020 to 2035
  • Table 35: Eastern Europe Market Value (USD Billion) Forecast by Category, 2020 to 2035
  • Table 36: Eastern Europe Market Volume (kilotons) Forecast by Category, 2020 to 2035
  • Table 37: Eastern Europe Market Value (USD Billion) Forecast by Distribution Channel, 2020 to 2035
  • Table 38: Eastern Europe Market Volume (kilotons) Forecast by Distribution Channel, 2020 to 2035
  • Table 39: Eastern Europe Market Value (USD Billion) Forecast by End User, 2020 to 2035
  • Table 40: Eastern Europe Market Volume (kilotons) Forecast by End User, 2020 to 2035
  • Table 41: East Asia Market Value (USD Billion) Forecast by Country, 2020 to 2035
  • Table 42: East Asia Market Volume (kilotons) Forecast by Country, 2020 to 2035
  • Table 43: East Asia Market Value (USD Billion) Forecast by Category, 2020 to 2035
  • Table 44: East Asia Market Volume (kilotons) Forecast by Category, 2020 to 2035
  • Table 45: East Asia Market Value (USD Billion) Forecast by Distribution Channel, 2020 to 2035
  • Table 46: East Asia Market Volume (kilotons) Forecast by Distribution Channel, 2020 to 2035
  • Table 47: East Asia Market Value (USD Billion) Forecast by End User, 2020 to 2035
  • Table 48: East Asia Market Volume (kilotons) Forecast by End User, 2020 to 2035
  • Table 49: South Asia & Pacific Market Value (USD Billion) Forecast by Country, 2020 to 2035
  • Table 50: South Asia & Pacific Market Volume (kilotons) Forecast by Country, 2020 to 2035
  • Table 51: South Asia & Pacific Market Value (USD Billion) Forecast by Category, 2020 to 2035
  • Table 52: South Asia & Pacific Market Volume (kilotons) Forecast by Category, 2020 to 2035
  • Table 53: South Asia & Pacific Market Value (USD Billion) Forecast by Distribution Channel, 2020 to 2035
  • Table 54: South Asia & Pacific Market Volume (kilotons) Forecast by Distribution Channel, 2020 to 2035
  • Table 55: South Asia & Pacific Market Value (USD Billion) Forecast by End User, 2020 to 2035
  • Table 56: South Asia & Pacific Market Volume (kilotons) Forecast by End User, 2020 to 2035
  • Table 57: Middle East and Africa Market Value (USD Billion) Forecast by Country, 2020 to 2035
  • Table 58: Middle East and Africa Market Volume (kilotons) Forecast by Country, 2020 to 2035
  • Table 59: Middle East and Africa Market Value (USD Billion) Forecast by Category, 2020 to 2035
  • Table 60: Middle East and Africa Market Volume (kilotons) Forecast by Category, 2020 to 2035
  • Table 61: Middle East and Africa Market Value (USD Billion) Forecast by Distribution Channel, 2020 to 2035
  • Table 62: Middle East and Africa Market Volume (kilotons) Forecast by Distribution Channel, 2020 to 2035
  • Table 63: Middle East and Africa Market Value (USD Billion) Forecast by End User, 2020 to 2035
  • Table 64: Middle East and Africa Market Volume (kilotons) Forecast by End User, 2020 to 2035

List of Figures

  • Figure 1: Global -Market Volume (kilotons) Forecast 2020 to 2035
  • Figure 2: Global -Market Pricing Analysis
  • Figure 3: Global -Market Value (USD Billion) Forecast 2020 to 2035
  • Figure 4: Global -Market Value Share and BPS Analysis by Category, 2025 and 2035
  • Figure 5: Global -Market Y-o-Y Growth Comparison by Category, 2025 to 2035
  • Figure 6: Global -Market Attractiveness Analysis by Category
  • Figure 7: Global -Market Value Share and BPS Analysis by Distribution Channel, 2025 and 2035
  • Figure 8: Global -Market Y-o-Y Growth Comparison by Distribution Channel, 2025 to 2035
  • Figure 9: Global -Market Attractiveness Analysis by Distribution Channel
  • Figure 10: Global -Market Value Share and BPS Analysis by End User, 2025 and 2035
  • Figure 11: Global -Market Y-o-Y Growth Comparison by End User, 2025 to 2035
  • Figure 12: Global -Market Attractiveness Analysis by End User
  • Figure 13: Global -Market Value (USD Billion) Share and BPS Analysis by Region, 2025 and 2035
  • Figure 14: Global -Market Y-o-Y Growth Comparison by Region, 2025 to 2035
  • Figure 15: Global -Market Attractiveness Analysis by Region
  • Figure 16: North America -Market Incremental $ Opportunity, 2025 to 2035
  • Figure 17: Latin America -Market Incremental $ Opportunity, 2025 to 2035
  • Figure 18: Western Europe -Market Incremental $ Opportunity, 2025 to 2035
  • Figure 19: Eastern Europe -Market Incremental $ Opportunity, 2025 to 2035
  • Figure 20: East Asia -Market Incremental $ Opportunity, 2025 to 2035
  • Figure 21: South Asia & Pacific -Market Incremental $ Opportunity, 2025 to 2035
  • Figure 22: Middle East and Africa -Market Incremental $ Opportunity, 2025 to 2035
  • Figure 23: North America -Market Value Share and BPS Analysis by Country, 2025 and 2035
  • Figure 24: North America -Market Value Share and BPS Analysis by Category, 2025 and 2035
  • Figure 25: North America -Market Y-o-Y Growth Comparison by Category, 2025 to 2035
  • Figure 26: North America -Market Attractiveness Analysis by Category
  • Figure 27: North America -Market Value Share and BPS Analysis by Distribution Channel, 2025 and 2035
  • Figure 28: North America -Market Y-o-Y Growth Comparison by Distribution Channel, 2025 to 2035
  • Figure 29: North America -Market Attractiveness Analysis by Distribution Channel
  • Figure 30: North America -Market Value Share and BPS Analysis by End User, 2025 and 2035
  • Figure 31: North America -Market Y-o-Y Growth Comparison by End User, 2025 to 2035
  • Figure 32: North America -Market Attractiveness Analysis by End User
  • Figure 33: Latin America -Market Value Share and BPS Analysis by Country, 2025 and 2035
  • Figure 34: Latin America -Market Value Share and BPS Analysis by Category, 2025 and 2035
  • Figure 35: Latin America -Market Y-o-Y Growth Comparison by Category, 2025 to 2035
  • Figure 36: Latin America -Market Attractiveness Analysis by Category
  • Figure 37: Latin America -Market Value Share and BPS Analysis by Distribution Channel, 2025 and 2035
  • Figure 38: Latin America -Market Y-o-Y Growth Comparison by Distribution Channel, 2025 to 2035
  • Figure 39: Latin America -Market Attractiveness Analysis by Distribution Channel
  • Figure 40: Latin America -Market Value Share and BPS Analysis by End User, 2025 and 2035
  • Figure 41: Latin America -Market Y-o-Y Growth Comparison by End User, 2025 to 2035
  • Figure 42: Latin America -Market Attractiveness Analysis by End User
  • Figure 43: Western Europe -Market Value Share and BPS Analysis by Country, 2025 and 2035
  • Figure 44: Western Europe -Market Value Share and BPS Analysis by Category, 2025 and 2035
  • Figure 45: Western Europe -Market Y-o-Y Growth Comparison by Category, 2025 to 2035
  • Figure 46: Western Europe -Market Attractiveness Analysis by Category
  • Figure 47: Western Europe -Market Value Share and BPS Analysis by Distribution Channel, 2025 and 2035
  • Figure 48: Western Europe -Market Y-o-Y Growth Comparison by Distribution Channel, 2025 to 2035
  • Figure 49: Western Europe -Market Attractiveness Analysis by Distribution Channel
  • Figure 50: Western Europe -Market Value Share and BPS Analysis by End User, 2025 and 2035
  • Figure 51: Western Europe -Market Y-o-Y Growth Comparison by End User, 2025 to 2035
  • Figure 52: Western Europe -Market Attractiveness Analysis by End User
  • Figure 53: Eastern Europe -Market Value Share and BPS Analysis by Country, 2025 and 2035
  • Figure 54: Eastern Europe -Market Value Share and BPS Analysis by Category, 2025 and 2035
  • Figure 55: Eastern Europe -Market Y-o-Y Growth Comparison by Category, 2025 to 2035
  • Figure 56: Eastern Europe -Market Attractiveness Analysis by Category
  • Figure 57: Eastern Europe -Market Value Share and BPS Analysis by Distribution Channel, 2025 and 2035
  • Figure 58: Eastern Europe -Market Y-o-Y Growth Comparison by Distribution Channel, 2025 to 2035
  • Figure 59: Eastern Europe -Market Attractiveness Analysis by Distribution Channel
  • Figure 60: Eastern Europe -Market Value Share and BPS Analysis by End User, 2025 and 2035
  • Figure 61: Eastern Europe -Market Y-o-Y Growth Comparison by End User, 2025 to 2035
  • Figure 62: Eastern Europe -Market Attractiveness Analysis by End User
  • Figure 63: East Asia -Market Value Share and BPS Analysis by Country, 2025 and 2035
  • Figure 64: East Asia -Market Value Share and BPS Analysis by Category, 2025 and 2035
  • Figure 65: East Asia -Market Y-o-Y Growth Comparison by Category, 2025 to 2035
  • Figure 66: East Asia -Market Attractiveness Analysis by Category
  • Figure 67: East Asia -Market Value Share and BPS Analysis by Distribution Channel, 2025 and 2035
  • Figure 68: East Asia -Market Y-o-Y Growth Comparison by Distribution Channel, 2025 to 2035
  • Figure 69: East Asia -Market Attractiveness Analysis by Distribution Channel
  • Figure 70: East Asia -Market Value Share and BPS Analysis by End User, 2025 and 2035
  • Figure 71: East Asia -Market Y-o-Y Growth Comparison by End User, 2025 to 2035
  • Figure 72: East Asia -Market Attractiveness Analysis by End User
  • Figure 73: South Asia & Pacific -Market Value Share and BPS Analysis by Country, 2025 and 2035
  • Figure 74: South Asia & Pacific -Market Value Share and BPS Analysis by Category, 2025 and 2035
  • Figure 75: South Asia & Pacific -Market Y-o-Y Growth Comparison by Category, 2025 to 2035
  • Figure 76: South Asia & Pacific -Market Attractiveness Analysis by Category
  • Figure 77: South Asia & Pacific -Market Value Share and BPS Analysis by Distribution Channel, 2025 and 2035
  • Figure 78: South Asia & Pacific -Market Y-o-Y Growth Comparison by Distribution Channel, 2025 to 2035
  • Figure 79: South Asia & Pacific -Market Attractiveness Analysis by Distribution Channel
  • Figure 80: South Asia & Pacific -Market Value Share and BPS Analysis by End User, 2025 and 2035
  • Figure 81: South Asia & Pacific -Market Y-o-Y Growth Comparison by End User, 2025 to 2035
  • Figure 82: South Asia & Pacific -Market Attractiveness Analysis by End User
  • Figure 83: Middle East and Africa -Market Value Share and BPS Analysis by Country, 2025 and 2035
  • Figure 84: Middle East and Africa -Market Value Share and BPS Analysis by Category, 2025 and 2035
  • Figure 85: Middle East and Africa -Market Y-o-Y Growth Comparison by Category, 2025 to 2035
  • Figure 86: Middle East and Africa -Market Attractiveness Analysis by Category
  • Figure 87: Middle East and Africa -Market Value Share and BPS Analysis by Distribution Channel, 2025 and 2035
  • Figure 88: Middle East and Africa -Market Y-o-Y Growth Comparison by Distribution Channel, 2025 to 2035
  • Figure 89: Middle East and Africa -Market Attractiveness Analysis by Distribution Channel
  • Figure 90: Middle East and Africa -Market Value Share and BPS Analysis by End User, 2025 and 2035
  • Figure 91: Middle East and Africa -Market Y-o-Y Growth Comparison by End User, 2025 to 2035
  • Figure 92: Middle East and Africa -Market Attractiveness Analysis by End User
  • Figure 93: Global -Market - Tier Structure Analysis
  • Figure 94: Global -Market - Company Share Analysis

Frequently Asked Questions

What is the estimated market size of the halibut market in 2025?

The industry is expected to be valued at USD 1.2 billion in 2025.

What is the projected value of the halibut market by 2035?

The industry is forecast to reach USD 1.9 billion by 2035.

What is the anticipated CAGR for the halibut market during 2025 to 2035?

The industry is projected to grow at a CAGR of 4.5% over the forecast period.

Which species type dominates the halibut market in 2025?

Alaska halibut holds the top position in the halibut market, accounting for 39.8% of the share in 2025.

Who is the leading company in the halibut market?

Marine harvest leads the halibut market with an 11% market share.

Future Market Insights

Halibut Market