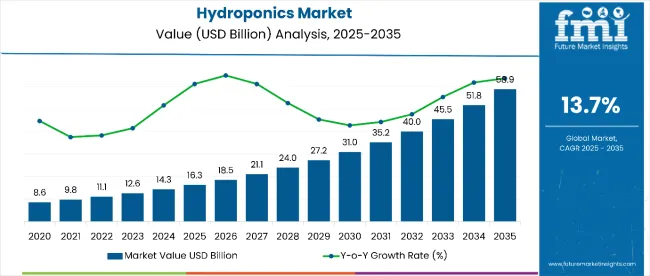
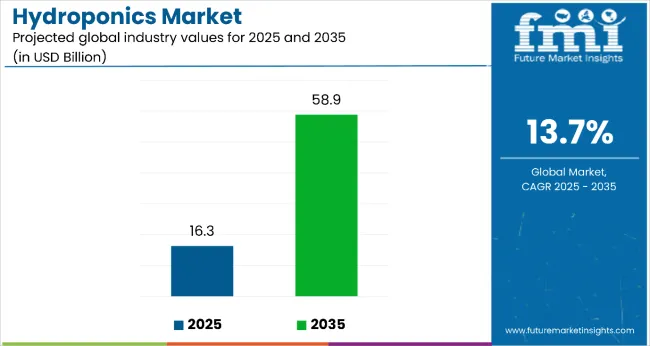
The hydroponics market is estimated to be valued at USD 16.3 billion in 2025 and is projected to reach USD 58.9 billion by 2035, registering a CAGR of 13.7% over the forecast period. The market is projected to add an absolute dollar opportunity of USD 42.6 billion over the forecast period. This reflects a 3.61 times growth at a compound annual growth rate of 13.7%. The market's evolution is expected to be shaped by increasing adoption of soilless farming methods, rising demand for year-round crop production, and growing awareness of resource-efficient agriculture in both developed and emerging economies.
By 2030, the market is likely to reach approximately USD 31.0 billion, accounting for USD 14.7 billion in incremental value over the first half of the decade. The market is projected to witness an absolute growth of USD 42.6 billion between 2025 and 2035. The remaining USD 27.9 billion is expected during the second half, suggesting a heavily back-loaded growth pattern. Technology integration in climate control, irrigation, and LED lighting is gaining traction due to advances in precision agriculture and automation solutions.
Companies such as ScottsMiracle-Gro, AeroFarms, and BrightFarms are advancing their competitive positions through investment in large-scale hydroponic facilities, R&D in high-yield crop varieties, and partnerships with retail and foodservice chains. Premium positioning strategies, sustainability certifications, and energy-efficient production systems are enabling market players to appeal to environmentally conscious consumers and institutional buyers. Market performance will remain anchored in technological innovation, operational scalability, and supply chain optimization.
| Metric | Value |
|---|---|
| Hydroponics Market Estimated Value in (2025E) | USD 16.3 billion |
| Hydroponics Market Forecast Value in (2035F) | USD 58.9 billion |
| Forecast CAGR (2025 to 2035) | 13.7% |
The market holds approximately 42% of the controlled-environment agriculture (CEA) market, driven by its high yield efficiency, reduced land use, and suitability for urban farming. It accounts for around 35% of the sustainable agriculture technology market, supported by growing awareness of resource-efficient farming methods. The market contributes nearly 28% to the premium fresh produce segment, particularly for incorporation into retail, foodservice, and high-end grocery chains. It holds close to 22% of the organic produce market, where hydroponically grown crops command premium pricing among health-conscious consumers. The share in the vertical farming market reaches about 31%, reflecting preference among growers for space-optimized cultivation systems with consistent output quality.
The market is undergoing structural change driven by increasing global food demand, climate change challenges, and expanding urban agriculture projects. Advanced system types, including aggregate and liquid-based setups, coupled with precision irrigation and nutrient delivery systems, have improved crop yield and quality consistency. Manufacturers and growers are introducing value-added solutions such as modular farms, fully automated climate-controlled greenhouses, and integrated LED lighting systems tailored for specific crop types. Strategic collaborations between technology providers and agricultural producers have accelerated adoption across both developed and emerging markets.
The Hydroponics Market is experiencing robust growth due to its ability to produce high yields in controlled environments, independent of soil quality or climatic conditions. This method allows year-round cultivation, efficient water usage, and reduced pesticide reliance. key factors attracting both commercial growers and urban farming initiatives.
Rising global demand for fresh, pesticide-free produce and the need to optimize agricultural output in regions with limited arable land are further driving adoption. Advancements in climate control, LED grow lighting, and automated irrigation systems are enhancing productivity, consistency, and cost efficiency, making hydroponics increasingly viable for large-scale operations.
As consumer preference shifts toward locally grown, sustainable, and nutrient-rich produce, and governments incentivize modern farming technologies, the market outlook remains highly favorable. Expanding adoption in high-value crops, coupled with technological integration and scalability, positions hydroponics as a cornerstone of the future agricultural landscape.
The market is segmented by product type, equipment, input, crop type, and region. By product type, the market is bifurcated into aggregate systems and liquid systems. Based on equipment, the market is divided into HVAC, irrigation systems, control systems, LED grow lights, material handling, and others such as sensors and automation modules. In terms of input, the market is bifurcated into nutrients and rockwool. By crop type, the market is divided into tomato, lettuce & leafy vegetables, pepper, cucumber, microgreens, herbs, fruits, and others such as berries and flowers. Regionally, the market is classified into North America, Latin America, Western Europe, Eastern Europe, South Asia & Pacific, East Asia, and the Middle East & Africa.
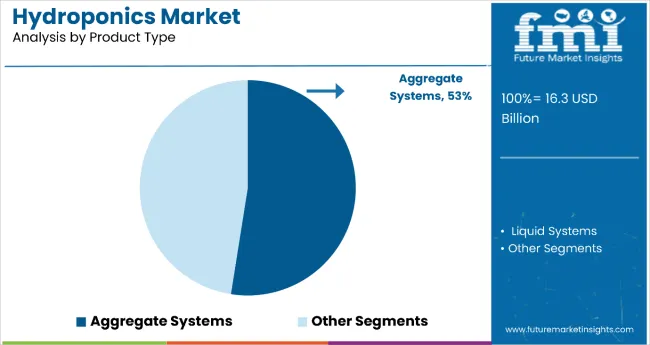
Aggregate systems dominate the hydroponics market with a 53% global market share in 2025, making them the most lucrative segment. These systems employ inert growing mediasuch as rockwool, perlite, or coconut coir to anchor plant roots, with nutrient solutions delivered via drip irrigation or flood-and-drain techniques. This design offers a balanced environment for plant growth, ensuring optimal aeration, nutrient absorption, and water retention.
One of the key advantages of aggregate systems is their versatility, as they can support a broad range of crops, from high-value vegetables like tomatoes and peppers to leafy greens and herbs. Their ease of installation, lower maintenance requirements compared to liquid systems, and scalability make them particularly attractive for both commercial growers and small-scale urban farms. Additionally, aggregate systems provide enhanced root stability, minimizing plant stress and improving yields.
With increasing global focus on sustainable agriculture, reduced water usage, and food security, aggregate systems are expected to see strong demand. Their adaptability to various climates and compatibility with advanced automation technologies will further reinforce their position as the leading hydroponic cultivation method over the forecast period.
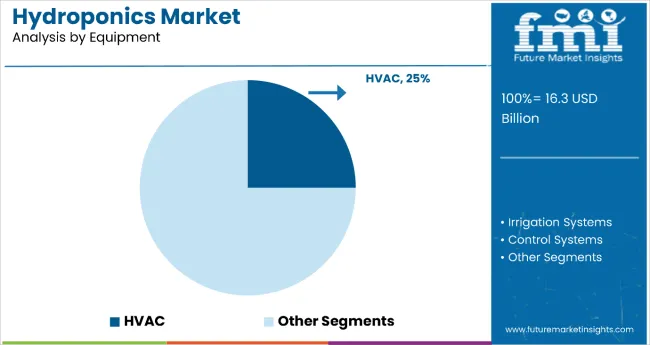
HVAC systems hold the largest share in the market equipment segment, accounting for 25% of global revenue in 2025, making them the most lucrative category. In controlled environment agriculture, precise temperature, humidity, and air circulation are critical to optimizing plant growth, nutrient uptake, and yield consistency. HVAC systems regulate these variables, ensuring year-round production regardless of external climate conditions.
Their importance is amplified in high-value crop cultivation such as tomatoes, lettuce, and herbs where even slight environmental fluctuations can impact quality and marketability. Modern HVAC setups integrate with automation and IoT-based monitoring systems, enabling real-time adjustments that improve energy efficiency while reducing operational costs.
The rising adoption of vertical farms and large-scale hydroponic greenhouses in urban centers, particularly in North America, Europe, and East Asia, is driving HVAC demand. As sustainability standards tighten, innovations like energy recovery ventilators, variable-speed drives, and renewable-powered climate control systems will further strengthen HVAC’s position as the backbone of advanced hydroponic facilities from 2025 to 2035.
From 2025 to 2035, heightened awareness of nutrition science and preventive healthcare will significantly drive the market. With growing concerns over food safety, pesticide residues, and nutrient loss in conventional farming, hydroponically grown produce is increasingly recognized for its higher nutritional value, freshness, and chemical-free quality.
Sustainability and Efficiency Drive Hydroponics Market Growth
The market faces notable limitations, particularly the high initial capital investment required for commercial-scale systems, which can deter small and medium growers. Setting up advanced infrastructure such as climate control, irrigation automation, and LED lighting demands significant financial resources. In addition, operating these systems requires skilled labor and technical expertise, creating barriers in regions lacking trained personnel. The dependency on electricity and technology makes hydroponic operations vulnerable to power outages or equipment malfunctions, potentially leading to rapid crop losses. Moreover, ongoing maintenance costs and the need for consistent monitoring can discourage adoption in cost-sensitive markets.
Technological Innovation Creates Market Opportunities
From 2025 to 2035, the industry is witnessing accelerated integration of AI, IoT, and automation for precise nutrient dosing, climate regulation, and yield optimization. Vertical farming is emerging as a prominent application, particularly in urban centers where land scarcity and food security concerns drive demand for high-density, year-round production. Environmental responsibility is becoming a core purchasing driver, with consumers increasingly seeking produce grown with minimal pesticides, reduced water usage, and eco-friendly practices. Organic certification and traceability are gaining importance as premium market entry requirements.
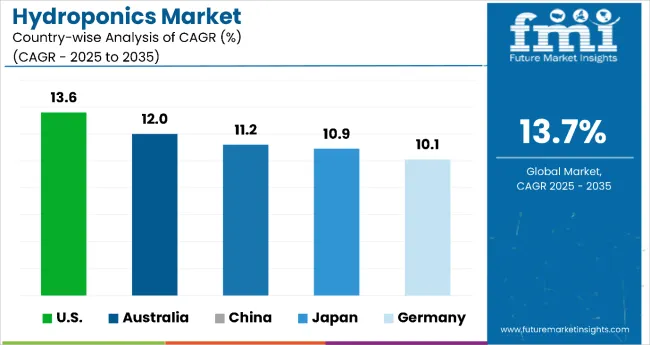
| Country | CAGR |
|---|---|
| USA | 13.6% |
| Australia | 12% |
| China | 11.2% |
| Japan | 10.9% |
| Germany | 10.1% |
In the hydroponics market, growth rates among the USA, China, Germany, Japan, and Australia reflect varying levels of technological adoption, market demand, and production conditions. The USA, with a CAGR of 13.6%, leads in growth, driven by advanced agri-tech, automation, and strong distribution networks. Australia follows at 12.0%, propelled by water-efficient farming and export-oriented production. China’s 11.2% growth is supported by large-scale modernization, cost-effective systems, and government-backed urban farming. Japan, at 10.9%, benefits from precision urban agriculture and high-tech plant factories, catering to premium quality demand. Germany records the slowest yet steady growth at 10.1%, focusing on sustainability, organic production, and technology exports within the EU.
The report covers an in-depth analysis of 40+ countries; five top-performing OECD countries are highlighted below.
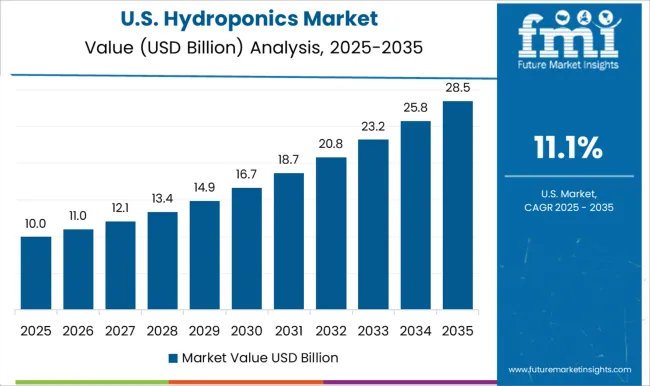
The USA hydroponics revenue is projected to expand significantly, with a CAGR of 13.6%, supported by advanced agri-tech adoption and a strong commercial greenhouse network. With high-tech infrastructure and favorable state-level policies, it remains the largest global revenue contributor. Growth is fueled by rising demand for fresh, locally grown produce and efficient resource utilization. Increasing investment in vertical farming and automation, along with robust retail and wholesale networks, further boosts expansion. High penetration of LED grow lighting and climate control systems enhances productivity. Expanding consumer preference for pesticide-free vegetables drives adoption. Leading companies like ScottsMiracle-Gro continue to consolidate the market through acquisitions and innovation.
Revenue from hydroponics in Australia is growing with a CAGR of 12.0%, largely due to water scarcity challenges and the push for sustainable farming. Adoption is strong in both domestic markets and export-focused agriculture for high-value crops. Water-efficient irrigation systems are increasingly used to adapt to climate variability. Research collaborations between universities and growers foster innovation. Hydroponic strawberries, tomatoes, and herbs dominate production, supported by greenhouse clusters in Queensland and Victoria. Premium produce exports to Asia-Pacific markets strengthen Australia’s agricultural competitiveness.
Demand for hydroponics in China is witnessing steady growth with a CAGR of 11.2%, fueled by government-backed modernization of agriculture and urban farming projects. The shift from traditional to soilless cultivation supports food security and environmental goals. Leveraging strong manufacturing capacity, China is a leading producer of hydroponics equipment. Rapid controlled-environment agriculture development and significant public-private smart farming investments accelerate adoption. Urban and peri-urban adoption is expanding, focusing on year-round production. Local manufacturers offer cost-effective systems, improving accessibility. These trends position China as a key player in the global hydroponics market.
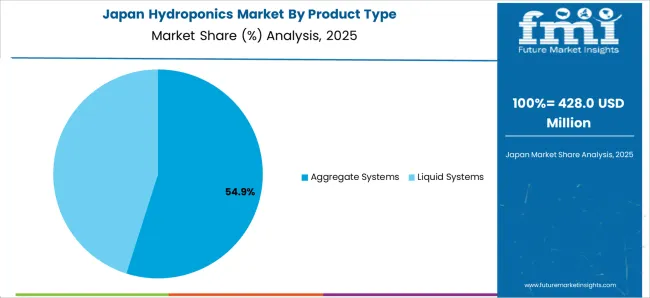
Sales of hydroponics in Japan are growing at a CAGR of 10.9%, driven by urban space constraints and a cultural preference for fresh produce. Vertical farms in metropolitan areas supply supermarkets directly, preserving freshness. High-tech plant factories with environmental automation are becoming common, alongside rooftop and basement projects. Leafy greens, herbs, and strawberries dominate production due to local demand patterns. Government incentives support smart agriculture, while collaborations between electronics firms and agri-businesses drive innovation. Japan remains a leader in precision urban agriculture in Asia.
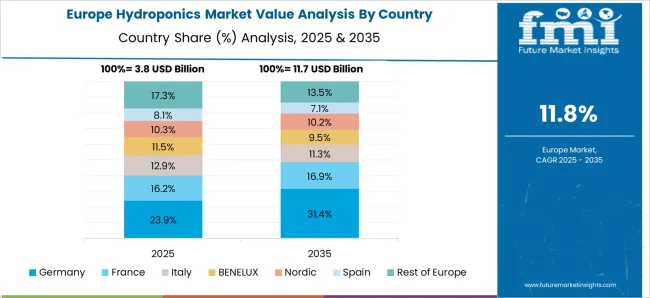
Demand for hydroponics in Germany is growing at a CAGR of 10.1%, backed by strong greenhouse traditions, advanced agricultural engineering, and sustainability policies. Consumer demand for premium, chemical-free produce aligns with environmental goals. Energy-efficient LED lighting and integration of IoT and AI for crop monitoring improve yields. EU and national funding for agri-tech initiatives strengthen the industry’s foundation. Demand for organic-certified produce drives system adoption. Germany also exports advanced hydroponic equipment across Europe, reinforcing its leadership in sustainable farming technology.
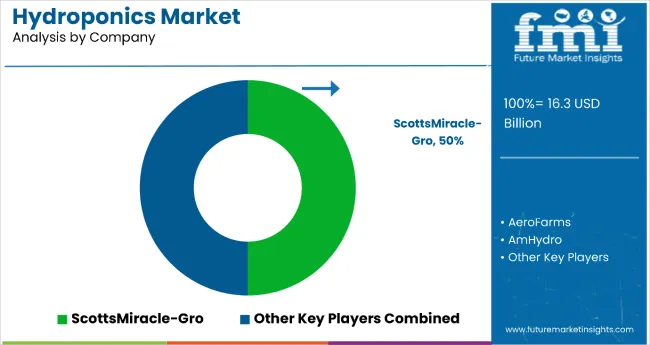
The market is moderately consolidated, led by ScottsMiracle-Gro with a dominant 50.0% market share, benefiting from strong vertical integration, extensive retail distribution, and a diversified portfolio spanning nutrient solutions, growing media, and hydroponic systems.
Key players include AeroFarms, AmHydro, VitaLink, BrightFarms, and several regional innovators focusing on high-tech, resource-efficient cultivation solutions. These companies offer a range of products and services including aggregate and liquid system setups, HVAC and irrigation technologies, LED grow lighting, and smart control systems, supported by robust supply chains and specialized expertise.
Market growth is fueled by increasing demand for year-round crop production, advancements in controlled environment agriculture, urban population expansion, and heightened awareness of water-efficient farming methods across both developed and emerging regions.
| Item | Value |
| Quantitative Units | USD 16.3 billion |
| Product Type | Aggregate Systems and Liquid Systems |
| Equipment | HVAC, Irrigation Systems, Control Systems, LED Grow Lights, Material Handling, and Others (including water filtration units, nutrient dosing systems, and sensors). |
| Input | Nutrients and Rockwool |
| Crop Type | Tomato, Lettuce and Leafy Vegetables, Pepper, Cucumber, Microgreens, Herbs, Fruits, and Others (including root vegetables, flowers, and specialty crops) |
| Regions Covered | North America, Europe, Asia-Pacific, Latin America, Middle East & Africa |
| Country Covered | United States, Canada, United Kingdom, Germany, France, China, Japan, South Korea, Brazil, Australia and 40+ countries |
| Key Companies Profiled | AeroFarms , LLC, Scotts Miracle Gro , AmHydro , Emerald Harvest, Argus Control Systems Limited, Hydroponic Systems International, Emirates Farms, Advanced Nutrients, Freight Farms, Inc., Vitalink , Green Sense Farms Holdings, Inc., Heliospectra AB, LumiGrow , Inc., Signify Holding B.V., Hydrofarm LLC, Terra Tech Corp. |
| Additional Attributes | Strong adoption in high-yield crop production, technological integration (automation, AI), rising demand for sustainable agriculture, and increasing urban farming initiatives |
The global hydroponics market is estimated to be valued at USD 16.3 billion in 2025.
The market size for the hydroponics market is projected to reach USD 55.4 billion by 2035.
The hydroponics market is expected to grow at a 13.0% CAGR between 2025 and 2035.
The key product types in hydroponics market are aggregate systems and liquid systems.
In terms of equipment, LED grow lights segment to command 47.1% share in the hydroponics market in 2025.


Our Research Products

The "Full Research Suite" delivers actionable market intel, deep dives on markets or technologies, so clients act faster, cut risk, and unlock growth.

The Leaderboard benchmarks and ranks top vendors, classifying them as Established Leaders, Leading Challengers, or Disruptors & Challengers.

Locates where complements amplify value and substitutes erode it, forecasting net impact by horizon

We deliver granular, decision-grade intel: market sizing, 5-year forecasts, pricing, adoption, usage, revenue, and operational KPIs—plus competitor tracking, regulation, and value chains—across 60 countries broadly.

Spot the shifts before they hit your P&L. We track inflection points, adoption curves, pricing moves, and ecosystem plays to show where demand is heading, why it is changing, and what to do next across high-growth markets and disruptive tech

Real-time reads of user behavior. We track shifting priorities, perceptions of today’s and next-gen services, and provider experience, then pace how fast tech moves from trial to adoption, blending buyer, consumer, and channel inputs with social signals (#WhySwitch, #UX).

Partner with our analyst team to build a custom report designed around your business priorities. From analysing market trends to assessing competitors or crafting bespoke datasets, we tailor insights to your needs.
Supplier Intelligence
Discovery & Profiling
Capacity & Footprint
Performance & Risk
Compliance & Governance
Commercial Readiness
Who Supplies Whom
Scorecards & Shortlists
Playbooks & Docs
Category Intelligence
Definition & Scope
Demand & Use Cases
Cost Drivers
Market Structure
Supply Chain Map
Trade & Policy
Operating Norms
Deliverables
Buyer Intelligence
Account Basics
Spend & Scope
Procurement Model
Vendor Requirements
Terms & Policies
Entry Strategy
Pain Points & Triggers
Outputs
Pricing Analysis
Benchmarks
Trends
Should-Cost
Indexation
Landed Cost
Commercial Terms
Deliverables
Brand Analysis
Positioning & Value Prop
Share & Presence
Customer Evidence
Go-to-Market
Digital & Reputation
Compliance & Trust
KPIs & Gaps
Outputs
Full Research Suite comprises of:
Market outlook & trends analysis
Interviews & case studies
Strategic recommendations
Vendor profiles & capabilities analysis
5-year forecasts
8 regions and 60+ country-level data splits
Market segment data splits
12 months of continuous data updates
DELIVERED AS:
PDF EXCEL ONLINE

Thank you!
You will receive an email from our Business Development Manager. Please be sure to check your SPAM/JUNK folder too.
Chat With
MaRIA